. 2017 Apr 20;7(1):978.
doi: 10.1038/s41598-017-00981-4.

Combination of High-density Microelectrode Array and Patch Clamp Recordings to Enable Studies of Multisynaptic Integration

Affiliations

Combination of High-density Microelectrode Array and Patch Clamp Recordings to Enable Studies of Multisynaptic Integration

David Jäckel et al. Sci Rep. .

Abstract

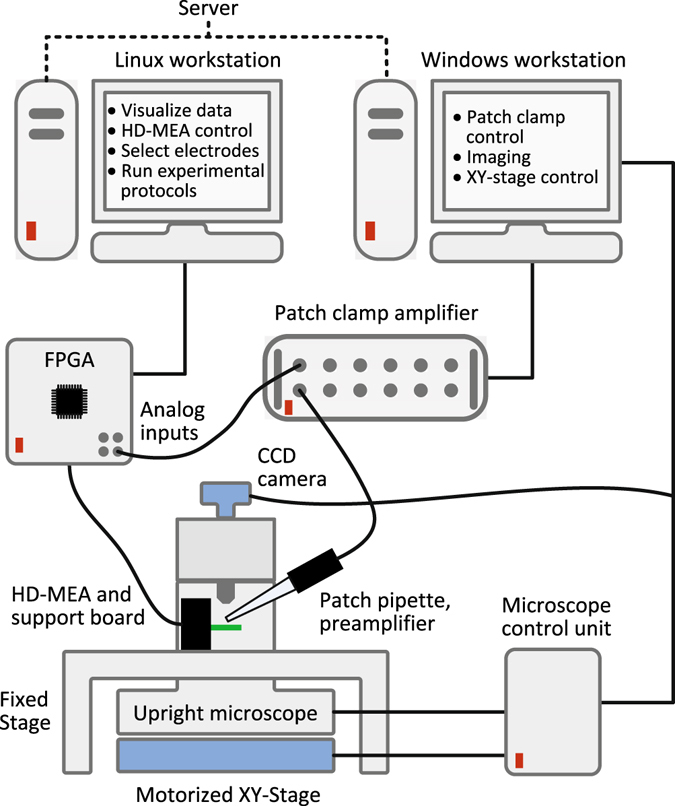
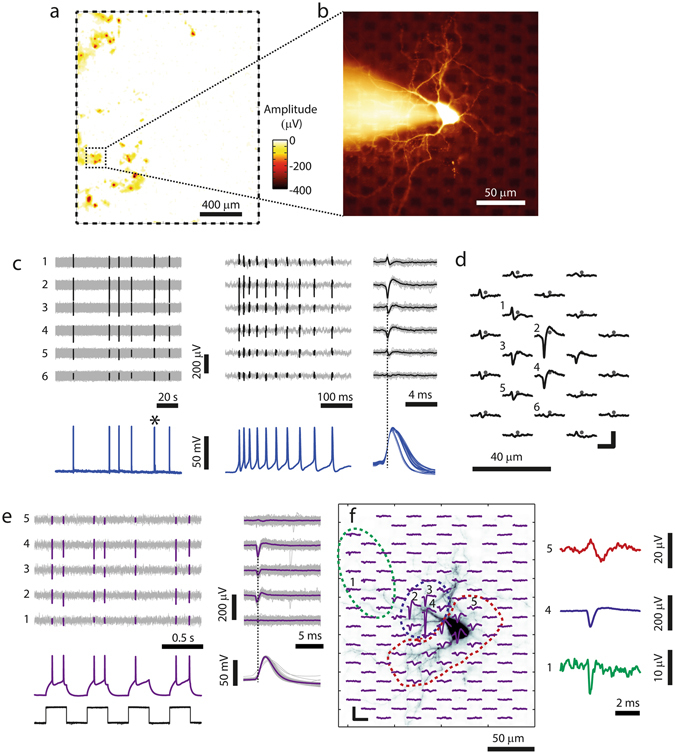
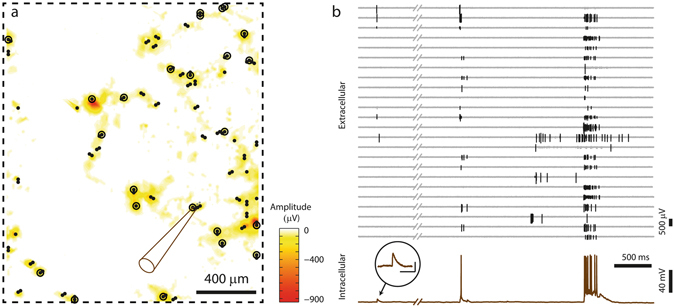
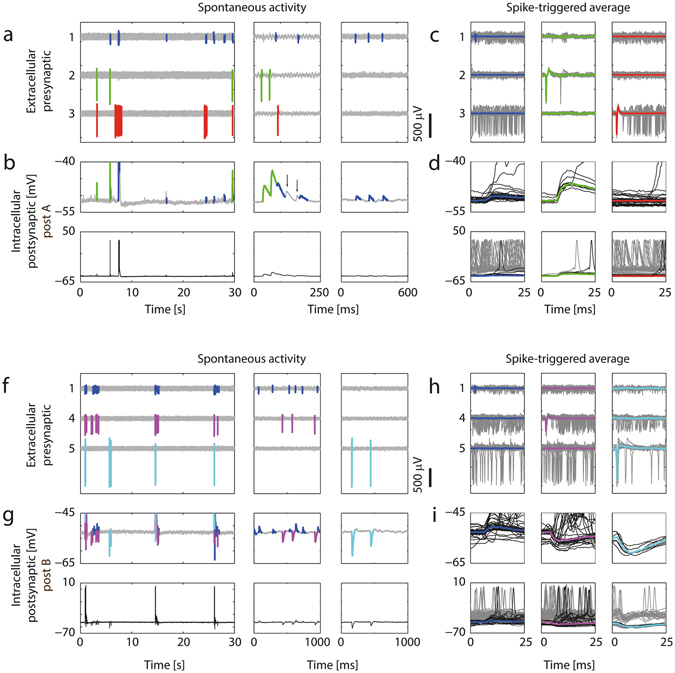
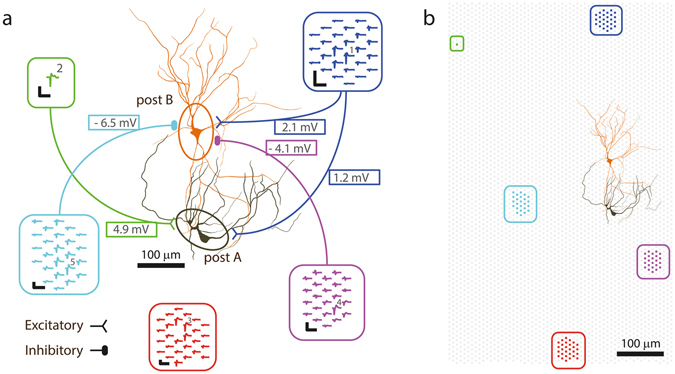
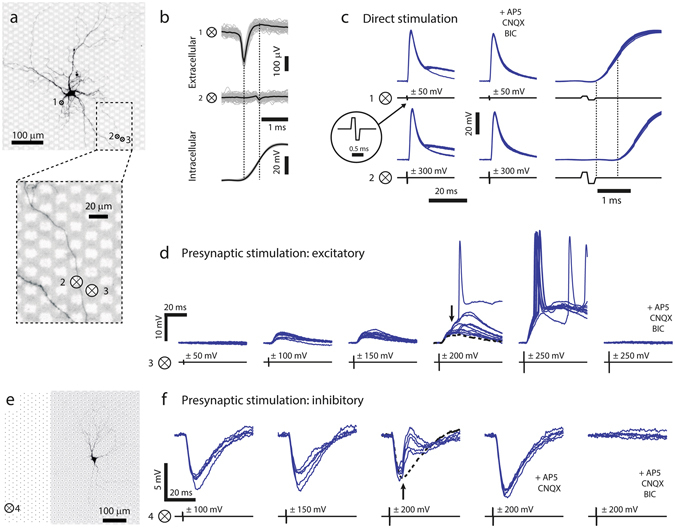
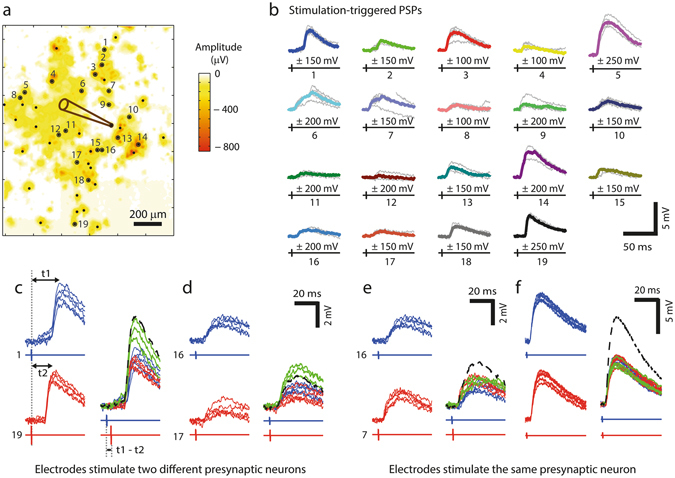
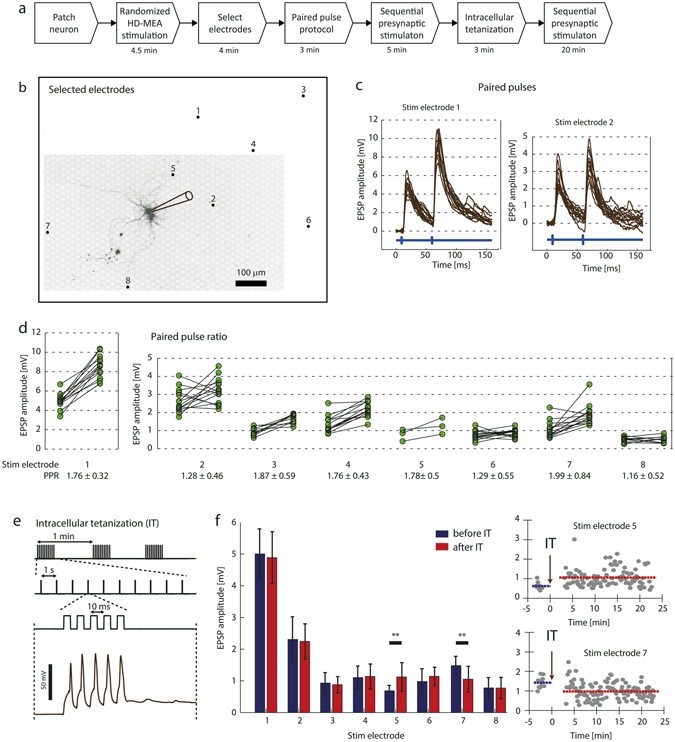
We present a novel, all-electric approach to record and to precisely control the activity of tens of individual presynaptic neurons. The method allows for parallel mapping of the efficacy of multiple synapses and of the resulting dynamics of postsynaptic neurons in a cortical culture. For the measurements, we combine an extracellular high-density microelectrode array, featuring 11'000 electrodes for extracellular recording and stimulation, with intracellular patch-clamp recording. We are able to identify the contributions of individual presynaptic neurons - including inhibitory and excitatory synaptic inputs - to postsynaptic potentials, which enables us to study dendritic integration. Since the electrical stimuli can be controlled at microsecond resolution, our method enables to evoke action potentials at tens of presynaptic cells in precisely orchestrated sequences of high reliability and minimum jitter. We demonstrate the potential of this method by evoking short- and long-term synaptic plasticity through manipulation of multiple synaptic inputs to a specific neuron.


Conflict of interest statement

J.M. and U.F. are co-founders of MaxWell Biosystems AG (Mattenstrasse 26, Basel 4058, Switzerland), commercializing HD-MEAs.

Figures

Figure 1
Figure 1
Experimental setup. Experimental setup consisting of a HD-MEA system, a patch clamp system, and an upright microscope. The HD-MEA is controlled through an FPGA and a Linux computer. A windows computer controls the patch-clamp amplifier settings and the microscope. The microscope is mounted on an XY-stage, which allows for determining the exact positioning for every acquired image. The Linux workstation is used to record the combined intra- and extracellular data, to visualize the data, to align acquired images to the MEA coordinates, and to run the experimental protocols.
Figure 2
Figure 2
Patch-clamping of neurons on top of HD-MEAs. (a) Spontaneous spike amplitude map, with the color code indicating the negative-peak signal at each electrode. The electrode array outline is indicated by the dashed rectangle. (b) Fluorescence image of a neuron on the array, patched in the whole-cell configuration. In the background, the Pt-black-covered electrodes can be seen as black squares. (c) Left: Intracellular (bottom) and extracellular recordings from six selected MEA electrodes (top) of another example neuron. During the two minutes of displayed electrical activity, the neuron spontaneously fired APs in six bursts. Center: Close-up view of one individual burst marked with an asterisk in the left panel. Right: superposition of all detected waveforms where the black traces represent the spike-triggered average (STA) waveforms. The dashed vertical lines in (c) and (e) were aligned with the negative peak of the largest extracellular spike for timing visualization. (d) Footprint (spatially distributed STA signals) of the neuron in (c) with the grey dots representing electrode positions. The numbers mark the 6 electrodes that produced the signals displayed in (c). Scale bars: 2 ms/50 µV. (e) Extracellular and intracellular recordings from the neuron displayed in (f), the recording electrodes are labeled 1–5 in (f). Left: APs were evoked by injecting current pulses of 100 pA (250-ms pulses at 2 Hz, black signal at the bottom), where every pulse evoked 1–2 APs. Right: Extracellular and intracellular STA waveforms of the evoked spikes. (f) Left: Footprint superimposed to a fluorescence image of the patched neuron, scale bars: 100 µV/5 ms. Right: Magnified spike signals representing typical axonal (electrode 1, green), somatic (electrode 4, blue) and dendritic (electrode 5, red) shapes. Note that the neuron in (e,f) is the same as displayed in (b).
Figure 3
Figure 3
Simultaneous recording of network activity and intracellular activity. (a) Visualization of the array area (dashed box), and the corresponding SSAM. A neuron (position indicated by pipette drawing) was recorded intracellularly, while spontaneous extracellular activity was recorded by sparsely distributed electrodes (all recording electrodes are marked with black spots, while circled dots indicate the subset of electrodes, the signals of which are shown in (b)). (b) Top: Extracellular signals (detected spikes) of 24 electrodes distributed over the array at the locations of the circled dots in (a). Bottom: Intracellular signal of the patched neuron. The close-up shows an individual, enlarged PSP (scale bars 100 ms/4 mV).
Figure 4
Figure 4
Mapping excitatory and inhibitory PSPs based on recordings of spontaneous activity. (a) Three data segments with different time scales (left, center, right) of recorded extracellular data from 3 electrodes. Spikes from 3 sorted neuronal units were colored; the blue and the green neuron were found to be presynaptically connected to the patched neuron ‘post A’, while the red neuron was not. (b) Top: Intracellular recordings from the patched cell. The signal trace after spikes of the blue and green neuron was colored in order to visualize excitatory PSPs originating from these two neurons, as determined by PSP averaging in (d). Note the summation of the synaptic events in the center plot, and that two additional EPSPs were measured, which, however, were not correlated to activity of the blue or green neurons (black arrows). Bottom: The same signal displayed with a larger amplitude range so that also postsynaptic APs can be seen. (c) STA of the extracellular APs extracted from a total of 2.5 minutes of recorded data (individual traces: gray; averaged waveforms are colored). (d) Top: Intracellular postsynaptic traces for the spikes of the colored neurons. Only traces that started from a baseline membrane potential (MP) value (i.e., did not exceed −48 mV during the first 5 ms) are shown here. Note that the blue and the green neurons evoked EPSPs of different magnitude, and that no PSPs were seen following APs of the red neuron. The colored waveforms show the median MP trace. Bottom: The same traces on a wider MP range. Additionally, traces which were recorded at depolarized state (MP more positive than −48 mV during the first 5 ms) are plotted in gray. (fi) Equivalent plots for postsynaptic neuron B. In this example the violet and the cyan neurons evoked inhibitory PSPs (IPSPs) of different magnitudes, whereas the blue neuron evoked EPSPs. Note that the blue presynaptic neuron is the same than the one for ‘post A’ in Fig. 4(a–d). Spikes in h were extracted from 6 minutes of recorded data.
Figure 5
Figure 5
Connectivity diagram for the synaptic inputs mapped in Fig. 4. (a) Synaptic connections of the neurons in Fig. 4 and their average PSP amplitudes. Extracellular footprints of the presynaptic (inside rounded rectangles) and morphology of two postsynaptic neurons (in ellipses). The footprints were extracted from spontaneous activity recordings in the incubator prior to the experiment. The green neuron did not fire APs during the spontaneous scan, therefore its multi-electrode footprint could not be identified. Numbered electrodes correspond to the trace numbering in Fig. 4, scale bars of blue and violet footprint: 200 µV/3 ms; of other footprints: 400 µV/3 ms. (b) Locations of HD-MEA electrodes (gray background dots), electrodes used to record the footprints (colored dots) and patch-clamped neurons on the array.
Figure 6
Figure 6
Evoking postsynaptic signals through HD-MEA electrical stimulation. (a) Fluorescence image of a neuron patched on the array, the numbered crosses inside circles “⊗” indicate positions of stimulating and/or recording electrodes. The magnified part at the bottom shows that a neuronal process is situated on top of electrode 2. (be) Numbered ⊗ correspond to the electrodes indicated in a. (b) STA extracellular traces (gray) and average trace (black), measured at electrodes 1 and 2 (top) and intracellularly measured AP (bottom). Note differences in spike shape and the temporal delay between the waveforms at electrodes 1 and 2. (c) Left: Intracellular responses (blue traces, 10 trials each) to extracellular stimulation at electrodes 1 and 2 under control conditions. The stimulus timing is indicated by the black traces, and the inset shows a single biphasic voltage pulse. All stimuli evoked APs, some stimulation trials also evoked PSPs, which overlapped with the APs. Center: Responses in the presence of synaptic blockers, where no PSPs were evoked. Right: Zoom-in on responses under control conditions to better visualize the delay between stimulus end and AP onsets (depicted by the dashed lines). Also note the difference in stimulus amplitude required to elicit an action potential through electrodes 1 and 2. (d) Stimulation with voltage pulses of increasing amplitudes. APs of a presynaptic neuron were evoked with stimulation voltages of ±100 and ±150 mV leading to PSPs. Increasing the voltage to ±200 mV resulted in additional PSPs for some trials (indicated by the black arrow, the dashed black line represents the median response for ±150 mV pulses). Yet larger PSPs were seen for ±250 mV, along with the occurrence of postsynaptic APs in most of the trials. Addition of synaptic blockers resulted in complete blockade of evoked signals, indicating that all observed responses involved synaptic transmission. (e) Fluorescence image of another neuron and position of the stimulation electrode 4. Black dots represent the positions of MEA electrodes. (f) PSPs upon stimulating an inhibitory presynaptic neuron were evoked by applying ±100 and ±150 mV at electrode 4. An additional excitatory presynaptic neuron was evoked upon increasing the extracellular stimulus at electrode 4 to ±200 mV (black arrow, black dashed line represents the median response for ±150 mV). Application of excitatory blockers blocked the EPSPs at ±200 mV, whereas additional application of BIC completely blocked all responses.
Figure 7
Figure 7
Stimulation-triggered PSPs from multiple presynaptic inputs. (a) SSAM of a MEA region with the color code indicating negative peak amplitudes of the spikes at each electrode. The position of the patched cell is indicated by the pipette drawing. Electrode locations (depicted as black dots) were selected according to large negative peaks in the recorded signal amplitude map and then used for stimulation with bipolar voltage pulses of 100, 150, 200 and 250 mV amplitude. Small dots mark electrodes that either did not evoke any PSP response or could not be associated with individual monosynaptic PSPs; large dots mark electrodes through which the stimulation yielded individual PSPs. (b) PSP responses (gray: individual traces; median traces are colored) for stimulation through the numbered electrodes in (a), where the lowest PSP-evoking stimulation voltage was chosen for every electrode. The stimulus timing are visualized by the black signals below the PSPs. (c) Left: PSPs and stimulus for electrodes 1 and 19 (from b), which exhibited similar amplitudes but different latencies (t1, t2: time between stimulation pulse and PSP maximum). Right: Paired stimulation for electrodes 1 and 19, where the timing between the two stimuli was t1 – t2 = 3.65 ms. The green traces show responses to paired stimulation, and red respectively blue traces represent the PSP responses to the individual stimuli (as shown left). The green responses to paired stimulation featured clearly larger amplitudes than the responses to individual stimuli, suggesting that the PSPs obtained through stimulation at electrodes 1 and 19 originated from two different presynaptic inputs. The black dashed line visualizes the theoretical sum of the individual average PSP responses. (d) Second example showing significantly larger responses to paired stimulation as compared to individual stimulation, thus indicating two different presynaptic sources. (e) Example, where paired stimulation does not produce larger PSP amplitudes than individual stimuli, indicating that stimulation of electrodes 16 and 7 activated the same presynaptic neuron. Note the comparably large spatial distance between the two electrodes in (a). (f) Example from another dataset, where PSP responses upon stimulation through two different electrodes were also evoked by the same presynaptic neuron.
Figure 8
Figure 8
Short- and long-term plasticity measurements for multiple synaptic inputs. (a) Experimental steps. (b) Fluorescence image of a patched neuron (indicated by the pipette drawing) and position of eight electrodes, which were found to evoke PSPs at the patched cell. (c) Individual intracellular traces during application of paired-pulse stimulation through SE 1 and SE 2 (14 trials each). The blue signal at the bottom visualizes the timing of the extracellular stimulation. (d) Every connected pair of dots displays the PSP amplitude values for the first and the second evoked PSP upon application of a paired-pulse protocol. If the postsynaptic neuron depolarized before the second PSP peak occurred, the PSP values could not be measured and the trial was ignored for the Figure and PPR calculation. (e) Top: Current stimulus used for the intracellular tetanization protocol as described in Methods, consisting of three trains with 10 individual bursts while each burst included five current pulses (0.9 mA amplitude, 5 ms duration) evoking individual APs. Bottom: Five APs evoked by a burst. (f) Left: Average PSP amplitudes before and after IT and the corresponding standard deviations indicated by error bars. Right: Individual measured PSP values over the course of the IT experiment for SE 5 and SE 7. The blue and red lines visualize the average PSP amplitude before and after IT.

Similar articles

Cited by

References

    1. Poncer JC, McKinney RA, Gähwiler BH, Thompson SM. Either N- or P-type calcium channels mediate GABA release at distinct hippocampal inhibitory synapses. Neuron. 1997;18:463–472. doi: 10.1016/S0896-6273(00)81246-5. - DOI - PubMed
    1. Debanne D, Guérineau NC, Gähwiler BH, Thompson SM. Paired-pulse facilitation and depression at unitary synapses in rat hippocampus: quantal fluctuation affects subsequent release. J. Physiol. 1996;491(Pt 1):163–176. doi: 10.1113/jphysiol.1996.sp021204. - DOI - PMC - PubMed
    1. Debanne D, Gahwiler BH, Thompson SM. Long-term synaptic plasticity between pairs of individual CA3 pyramidal cells in rat hippocampal slice cultures. J. Physiol. 1998;507:237–247. doi: 10.1111/j.1469-7793.1998.237bu.x. - DOI - PMC - PubMed
    1. Markram H, Lubke J, Frotscher M, Sakmann B. Regulation of synaptic efficacy by coincidence of postsynaptic APs and EPSPs. Science (80-.) 1997;275:213–215. doi: 10.1126/science.275.5297.213. - DOI - PubMed
    1. Bi GQ, Poo MM. Synaptic modifications in cultured hippocampal neurons: dependence on spike timing, synaptic strength, and postsynaptic cell type. J. Neurosci. 1998;18:10464–72. - PMC - PubMed

Publication types

LinkOut - more resources