. 2017 Apr 20;7(1):982.
doi: 10.1038/s41598-017-01174-9.

Glucocorticoids Suppress Antimicrobial Autophagy and Nitric Oxide Production and Facilitate Mycobacterial Survival in Macrophages

Affiliations

Glucocorticoids Suppress Antimicrobial Autophagy and Nitric Oxide Production and Facilitate Mycobacterial Survival in Macrophages

Jinli Wang et al. Sci Rep. .

Abstract

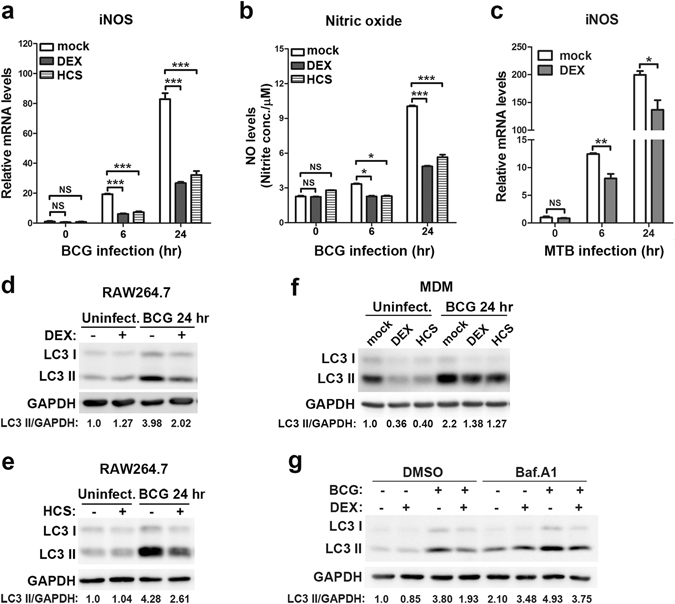
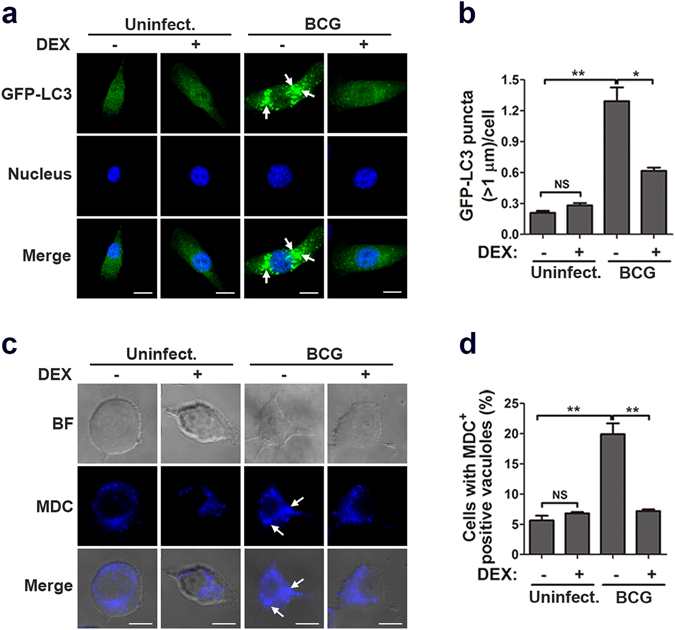
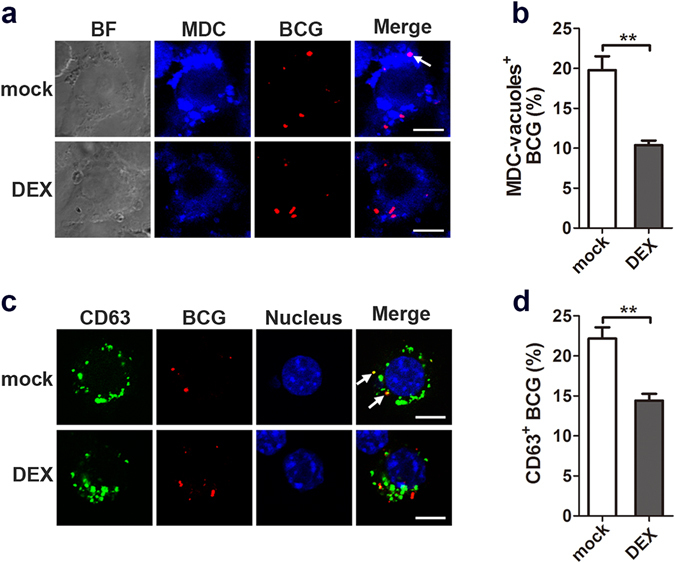
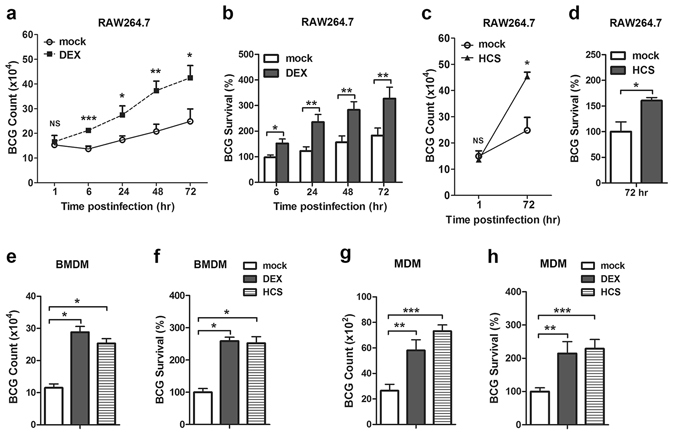
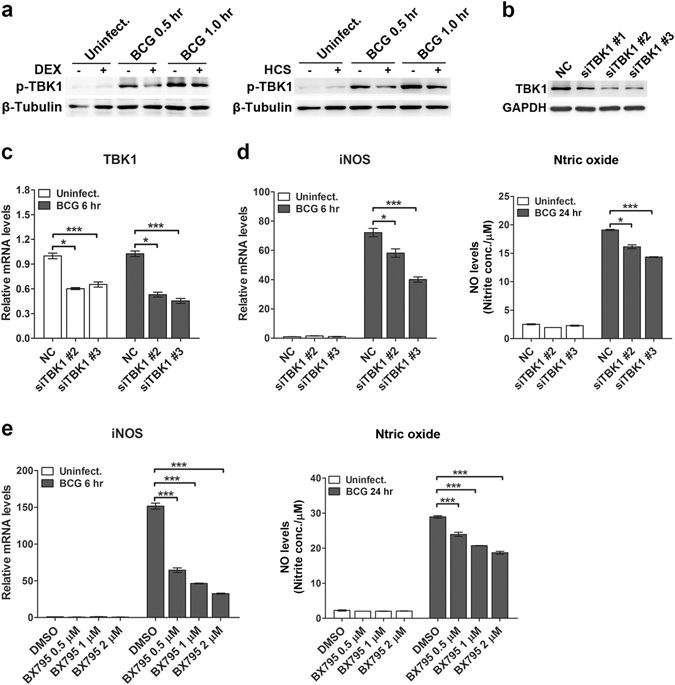
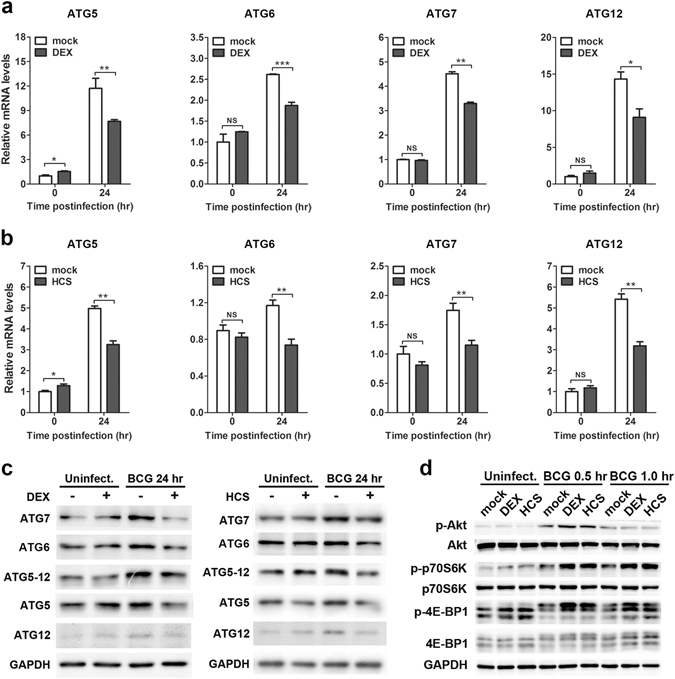
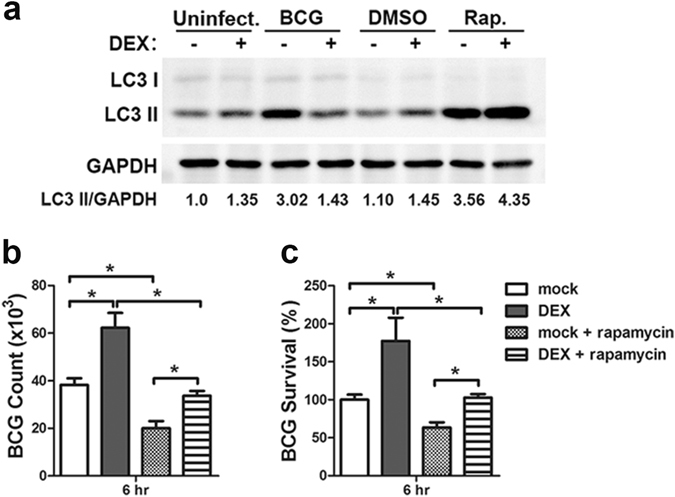
Chronic administration of glucocorticoids has been shown to render individuals highly susceptible to mycobacterial infection and lead to reactivation of latent bacilli. However, the effect of glucocorticoids on innate anti-mycobacterial defense, especially in macrophages remains largely unknown. Here, we found that glucocorticoids inhibited the innate immune response, antimicrobial nitric oxide production and autophagy in mycobacteria-challenged macrophages. Meanwhile, maturation and acidification of mycobacterial phagosomes were attenuated in RAW264.7 cells after glucocorticoids treatment. Consequently, we observed a glucocorticoid-induced increase in the survival of intracellular mycobacteria in both primary macrophages and cell lines. Glucocorticoids treatment decreased the activation of TBK1 kinase, which promotes the maturation of autophagosomes. Inhibition of TBK1 also decreased the production of nitric oxide. Furthermore, several autophagy-related genes were down-regulated, while activation of the Akt/mTOR signaling pathway was increased after glucocorticoids treatment, which may account for autophagy inhibition during mycobacterial infection. Restoration of autophagy with the agonist rapamycin abolished glucocorticoid-mediated enhancement of mycobacterial survival, suggesting that glucocorticoids blocked anti-mycobacterial defense via autophagy inhibition. Collectively, this study demonstrates that glucocorticoids impair innate antimicrobial autophagy and promote mycobacterial survival in macrophages, which is a novel mechanism for glucocorticoid-mediated immunosuppression. Our findings may provide important clues for tuberculosis prevention.


Conflict of interest statement

The authors declare that they have no competing interests.

Figures

Figure 1
Figure 1
Glucocorticoids suppress iNOS/NO and autophagy in mycobacteria-challenged macrophages. (a,b) RAW264.7 cells were pretreated with dexamethasone (DEX) (1 μM), hydrocortisone (HCS) (1 μM) or vehicle control ethanol (mock) for 6 hr and were then challenged with M. bovis BCG (MOI 5) for the indicated time. iNOS mRNA level was assessed with real-time PCR (a). NO in the supernatant was detected with the Griess assay (b). (c) RAW264.7 cells were pretreated with DEX (1 μM) or vehicle control ethanol (mock) for 6 hr and then challenged with M. tuberculosis H37Rv (MOI 5) for the indicated time. iNOS mRNA level was assessed with real-time PCR. (d,e) RAW264.7 cells were pretreated with DEX (1 μM) (d), HCS (1 μM) (e) or vehicle control ethanol (mock) for 6 hr and then challenged with M. bovis BCG (MOI 5) for 24 hr. The LC3 level was detected with Western blot analysis. Full-length blots are presented in Supplementary Figs 4 and 5, respectively. (f) MDMs were pretreated with DEX (1 μM), HCS (1 μM) or vehicle control ethanol (mock) for 6 hr and then challenged with M. bovis BCG (MOI 5) for 24 hr. The LC3 level was detected with Western blot analysis. Full-length blots are presented in Supplementary Fig. 6. (g) RAW264.7 cells were treated as described in (d), and cells were treated with Bafilomycin A1 (Baf. A1, 100 nM) 2 hr before cellular protein extraction for Western blot analysis. The LC3 level was detected with Western blot analysis. Full-length blots are presented in Supplementary Fig. 7. Relative band intensity of LC3 II was calculated after normalization by load control GAPDH and is shown below each lane. For Western blot analysis, GAPDH was used as the loading control, and data are representative of three independent experiments with similar results. For real-time PCR, the level of each mRNA was normalized to that of β-actin mRNA and is expressed relative to expression in unstimulated cells. Data are shown as the mean ± SEM of three independent experiments. *p < 0.05; **p < 0.01; ***p < 0.001. NS, not significant.
Figure 2
Figure 2
Glucocorticoids decrease autophagosome formation in mycobacteria-challenged macrophages. (a,b) RAW264.7 cells stably expressing GFP-LC3 were pretreated with dexamethasone (DEX) (1 μM) or vehicle control ethanol (mock) for 6 hr and then challenged with M. bovis BCG (MOI 5) for 24 hr. Nuclei were stained with DAPI (blue), and GFP-LC3 puncta were monitored with fluorescence microscopy (a). The average number of GFP-LC3 puncta (>1 μm) per cell was counted in at least 200 cells (b). (c,d) RAW264.7 cells were pretreated with DEX (1 μM) or vehicle control ethanol (mock) for 6 hr and then challenged with M. bovis BCG (MOI 5) for 24 hr. Autophagosomes were detected with MDC staining (c). The percentage of MDC vacuole-positive cells was calculated in at least 200 cells (d). Arrows indicate the GFP-LC3 puncta or MDC-positive vacuoles. Scale bar, 5 μm. *p < 0.05; **p < 0.01. NS, not significant.
Figure 3
Figure 3
Glucocorticoids inhibit the maturation of BCG phagosomes in macrophages. (a,b) RAW264.7 cells were pretreated with dexamethasone (DEX) (1 μM) or vehicle control ethanol for 24 hr and then challenged with Texas-Red-labeled M. bovis BCG (MOI 10) for 1 hr. Autophagosomes were detected with MDC staining (a). The percentage of BCG phagosome colocalizing with MDC-positive vacuoles was calculated in at least 100 phagosomes (b). (c,d) RAW264.7 cells were treated as described in (a,b), and lysosomes were labeled with CD63 (green) (c). The percentage of BCG phagosome colocalizing with CD63-positive vacuoles was calculated in at least 100 phagosomes. (d). Scale bar, 5 μm. **p < 0.01.
Figure 4
Figure 4
Increased mycobacterial survival in macrophages after glucocorticoids treatment. (ad) RAW264.7 cells were pretreated with dexamethasone (DEX) (1 μM), hydrocortisone (HCS) (1 μM) or vehicle control ethanol for 24 hr and then challenged with M. bovis BCG (MOI 10) for 1 hr. The intracellular viable bacilli were determined by CFU assays at the indicated time post-infection (a,c). Survival rate was calculated compared with that of mock-treated cells (b,d). (e–h) BMDMs (e,f) and MDMs (g,h) were treated like RAW264.7 cells as described in (a–d). The intracellular viable bacilli were determined by CFU assays at 72 hpi (e,g). Survival rate was calculated compared with that of the mock-treated cells (f,h). Data are shown as the mean ± SEM of three independent experiments. *p < 0.05; **p < 0.01; ***p < 0.001. NS, not significant.
Figure 5
Figure 5
Glucocorticoids inhibit TBK1 activation, and TBK1 silencing decreases iNOS expression and NO production in macrophages during mycobacterial infection. (a) RAW264.7 cells were pretreated with dexamethasone (DEX) (1 μM), hydrocortisone (HCS) (1 μM) or vehicle control ethanol (mock) for 24 hr and then challenged with M. bovis BCG (MOI 5) for the indicated times. Then the phosphorylation level of TBK1 was tested with Western blot analysis. Full-length blots are presented in Supplementary Fig. 8. (b) RAW264.7 cells were transfected with control siRNA (NC) or three TBK1 siRNAs (siTBK1 #1, #2, #3) with different sequences for 24 hr, and the protein level of TBK1 was tested with Western blot. Full-length blots are presented in Supplementary Fig. 9. (c,d) RAW264.7 cells were transfected with NC or siTBK1 #2 or #3 for 24 hr, and then infected with M. bovis BCG for the indicated times. TBK1 (c) and iNOS (d) mRNA level were tested with real-time PCR. NO in the supernatant was detected with the Griess assay (d). (e) RAW264.7 cells were pretreated with a TBK1 inhibitor (BX795) at the indicated concentration for 1 hr, and then infected with M. bovis BCG for the indicated times. iNOS mRNA levels were tested with real-time PCR. NO in the supernatant was detected with the Griess assay. For Western blot analysis, β-Tubulin or GAPDH was used as a loading control, and data are representative of three independent experiments with similar results. For real-time PCR, the level of each mRNA was normalized to that of β-actin mRNA and is expressed relative to expression in unstimulated cells. Data are shown as the mean ± SEM of three independent experiments. *p < 0.05; ***p < 0.001.
Figure 6
Figure 6
Glucocorticoids inhibit autophagy by suppressing the expression of ATGs and enhancing the activation of the Akt/mTOR pathway. (ac) RAW264.7 cells were pretreated with dexamethasone (DEX) (1 μM), hydrocortisone (HCS) (1 μM) or vehicle control ethanol (mock) for 6 hr and then challenged with M. bovis BCG (MOI 5) for 24 hr. mRNA and protein levels of ATGs were determined by real-time PCR (a,b) and Western blot (c), respectively. Full-length blots are presented in Supplementary Fig. 10. (d) RAW264.7 cells were pretreated with DEX (1 μM), HCS (1 μM) or vehicle control ethanol (mock) for 24 hr and then challenged with M. bovis BCG (MOI 5) for the indicated times. Phosphorylation and total protein levels of the indicated genes were determined by Western blot analysis. Full-length blots are presented in Supplementary Fig. 11. For Western blotting, GAPDH was used as the loading control. Data are representative of three independent experiments with similar results. For real-time PCR, the level of each mRNA was normalized to that of β-actin mRNA and is expressed relative to expression in unstimulated cells. Data are shown as the mean ± SEM of three independent experiments. *p < 0.05; **p < 0.01; ***p < 0.001. NS, not significant.
Figure 7
Figure 7
Glucocorticoids promote BCG survival in macrophages by inhibiting autophagy. (a) RAW264.7 cells were pretreated with dexamethasone (DEX) (1 μM) or vehicle control ethanol (mock) for 6 hr and then challenged with M. bovis BCG (MOI 5) or treated with the vehicle control DMSO or rapamycin (4 μM). LC3 level was detected with Western blot analysis. And GAPDH was used as the loading control. Full-length blots are presented in Supplementary Fig. 12. Data are representative of three independent experiments with similar results. (b,c) RAW264.7 cells were treated as described in (a), and viable bacilli were determined by CFU assays at 6 hpi (b). Survival rate was calculated compared with that of mock-treated cells (c). Data are shown as the mean ± SEM of three independent experiments. *p < 0.05.

References

    1. World Health Organization. Global tuberculosis control 2015. World Health Organization (2015).
    1. Getahun H, Matteelli A, Chaisson RE, Raviglione M. Latent Mycobacterium tuberculosis infection. New England Journal of Medicine. 2015;372:2127–2135. doi: 10.1056/NEJMra1405427. - DOI - PubMed
    1. Havlir DV, Barnes PF. Tuberculosis in patients with human immunodeficiency virus infection. New England Journal of Medicine. 1999;340:367–373. doi: 10.1056/NEJM199902043400507. - DOI - PubMed
    1. Bogunovic D, et al. Mycobacterial disease and impaired IFN-gamma immunity in humans with inherited ISG15 deficiency. Science. 2012;337:1684–1688. doi: 10.1126/science.1224026. - DOI - PMC - PubMed
    1. Lai CC, Lee MT, Lee SH, Chang SS, Lee CC. Risk of incident active tuberculosis and use of corticosteroids. International Journal of Tuberculosis and Lung Disease. 2015;19:936–942. doi: 10.5588/ijtld.15.0031. - DOI - PubMed

Publication types

MeSH terms