. 2017 Apr 6:10:92.
doi: 10.3389/fnmol.2017.00092. eCollection 2017.

Mutational Analysis at Intersubunit Interfaces of an Anionic Glutamate Receptor Reveals a Key Interaction Important for Channel Gating by Ivermectin

Affiliations

Mutational Analysis at Intersubunit Interfaces of an Anionic Glutamate Receptor Reveals a Key Interaction Important for Channel Gating by Ivermectin

Nurit Degani-Katzav et al. Front Mol Neurosci. .

Abstract

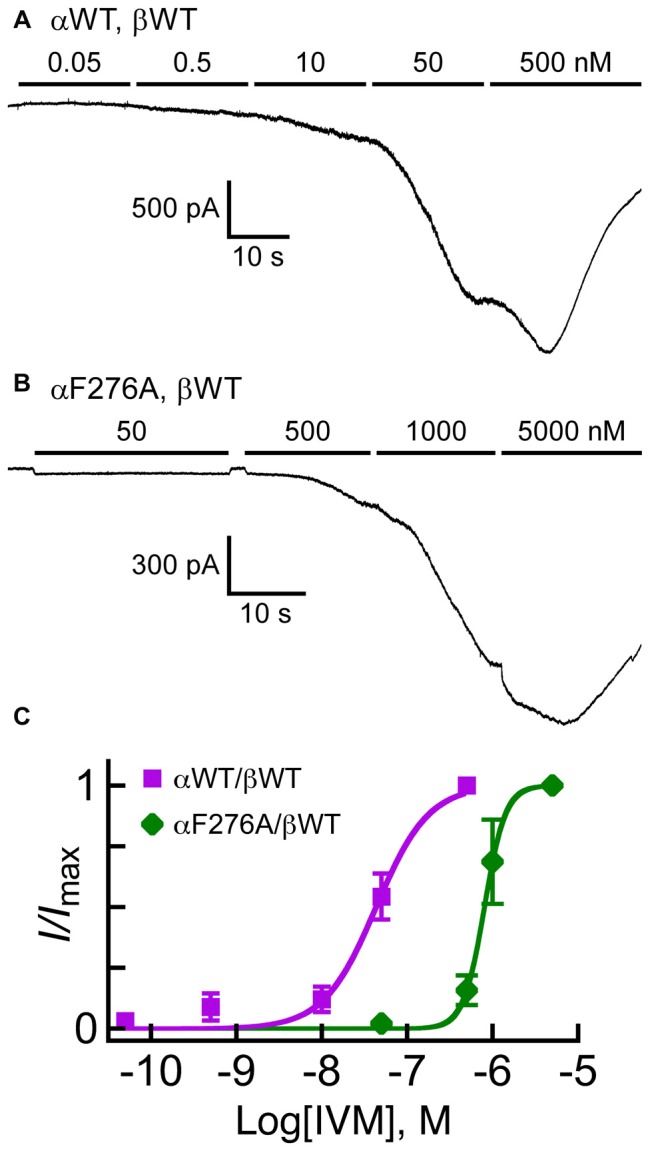
The broad-spectrum anthelmintic drug ivermectin (IVM) activates and stabilizes an open-channel conformation of invertebrate chloride-selective glutamate receptors (GluClRs), thereby causing a continuous inflow of chloride ions and sustained membrane hyperpolarization. These effects suppress nervous impulses and vital physiological processes in parasitic nematodes. The GluClRs are pentamers. Homopentameric receptors assembled from the Caenorhabditis elegans (C. elegans) GluClα (GLC-1) subunit can inherently respond to IVM but not to glutamate (the neurotransmitter). In contrast, heteromeric GluClα/β (GLC-1/GLC-2) assemblies respond to both ligands, independently of each other. Glutamate and IVM bind at the interface between adjacent subunits, far away from each other; glutamate in the extracellular ligand-binding domain, and IVM in the ion-channel pore periphery. To understand the importance of putative intersubunit contacts located outside the glutamate and IVM binding sites, we introduced mutations at intersubunit interfaces, between these two binding-site types. Then, we determined the effect of these mutations on the activation of the heteromeric mutant receptors by glutamate and IVM. Amongst these mutations, we characterized an α-subunit point mutation located close to the putative IVM-binding pocket, in the extracellular end of the first transmembrane helix (M1). This mutation (αF276A) moderately reduced the sensitivity of the heteromeric GluClαF276A/βWT receptor to glutamate, and slightly decreased the receptor subunits' cooperativity in response to glutamate. In contrast, the αF276A mutation drastically reduced the sensitivity of the receptor to IVM and significantly increased the receptor subunits' cooperativity in response to IVM. We suggest that this mutation reduces the efficacy of channel gating, and impairs the integrity of the IVM-binding pocket, likely by disrupting important interactions between the tip of M1 and the M2-M3 loop of an adjacent subunit. We hypothesize that this physical contact between M1 and the M2-M3 loop tunes the relative orientation of the ion-channel transmembrane helices M1, M2 and M3 to optimize pore opening. Interestingly, pre-exposure of the GluClαF276A/βWT mutant receptor to subthreshold IVM concentration recovered the receptor sensitivity to glutamate. We infer that IVM likely retained its positive modulation activity by constraining the transmembrane helices in a preopen orientation sensitive to glutamate, with no need for the aforementioned disrupted interactions between M1 and the M2-M3 loop.

Keywords: Cys-loop receptors; GluCls; ivermectin; ligand-gated ion channels; parasitic nematodes.


Figures

Figure 1
Figure 1
Structural characteristics of a GluCl receptor. (A) Two of five subunits of the homopentameric GluClαcrystR [Protein Data Bank (PDB) ID code 3RIF] are shown from the side in light and dark gray colors. Wide gray horizontal lines mark the putative membrane borders. The four coupling loops and the pre-M1 linker are colored as shown in (B,C). Glu and ivermectin (IVM) are shown as space-filling models with carbon, oxygen and nitrogen atoms colored in yellow, red and blue, respectively. They are bound at the α/α intersubunit interface far away from each other: Glu in the extracellular ligand-binding domain, and IVM in the upper part of the pore-domain periphery, between M1 (of the light gray subunit) and M3 (of the dark gray subunit). Hydrogen atoms were removed for better viewing. (B) Residues relevant to this study are shown as spheres with carbon atoms having the ribbon color, and oxygen, nitrogen and hydrogen atoms in red, blue and white colors, respectively. Only S237 is shown with its backbone atoms. (C) E273 (of the pre-M1 linker) is sandwiched between Q243 (gray) and S332 (green) that are located in the β9 strand and the M2-M3 loop of the adjacent subunit, respectively. Only the side chains of the three residues are shown, as space-filling models with their hydrogen atoms. E273 is colored with purple carbons, red oxygens and white hydrogens.
Figure 2
Figure 2
Sequence alignments of the coupling loops, pre-M1 linker and the first transmembrane segment (M1) in a few Cys-loop receptors. Colored amino acids in the first row match the colors in Figure 1. Asterisks indicate highly conserved amino acids. GluCl_cryst, a truncated α subunit used for crystallization and 3-D structure determination by X-ray crystallography (PDB ID 3RIF). CE, Caenorhabditis elegans; HS, Homo sapiens; MM, Mus musculus (mouse); TM, Torpedo marmorata (Marbled electric ray). UniProt Knowledgebase entry codes: CE_GluClR_alpha, G5EBR3; CE_GluClR_beta, Q17328; HS_GABAaR_alpha1, P14867; HS_GABAaR_rho1, P24046; HS_GlyR_alpha1, P23415; HS_GlyR_alpha3, O75311; HS_nAChR_alpha1, P02708; MM_nAChR_alpha1, P04756; TM_nAChR_alpha, P02711; TM_nAChR_beta, Q6S3I0; TM_nAChR_gamma, Q6S3H9; TM_nAChR_delta, Q6S3H8; HS_nAChR_alpha7, P36544; MM_5HT3aR, P23979.
Figure 3
Figure 3
Sensitivity of GluClα/β receptors to Glu. (A) Representative current traces measured in cells co-transfected with the indicated subunits (two upper rows). Horizontal bars correspond to 1-s applications of Glu in millimolar concentrations as indicated below the bars. Recordings were performed at +60 mV. The lowest row of this panel shows Glu dose-response curves for receptors assembled from the GluClα subunits indicated in the insets and the GluClβWT subunit. Curves were fitted to the averaged data points with a nonlinear regression using the Hill equation (Equation 1) (r2 > 0.99). Error bars correspond to SEM. (B) Current-voltage (I/V) relations obtained upon the application of Glu-EC50 concentrations over a voltage ramp lasting 250 ms in cells expressing the indicated subunits (see “Materials and Methods” Section). The I+60 mV/I-60 mV ratios calculated for the GluClαWT/βWT and the GluClαF276A/βWT receptors are 1.3 ± 0.03 and 1.44 ± 0.1 (mean ± SEM), respectively; P = 0.14 for three determinations each.
Figure 4
Figure 4
Sensitivity of GluClα/β receptors to IVM relatively to their responsiveness to Glu-EC50 concentrations. (A,B) Representative current traces elicited in response to EC50 concentrations of Glu (left, +60 mV) and 500 nM IVM (right, −60 mV). Cells were co-transfected with the indicated subunits. (C) Histogram corresponding to the ratio of IVM-elicited over Glu-elicited current peak amplitudes. EC50 concentrations of Glu (Table 2) and 500 nM IVM were used. Cells were co-transfected with the GluClα subunits indicated below the bar graph together with the GluClβWT subunit. ***P < 0.0001; no statistical difference was observed between the other mutants and the wild type receptor (P > 0.06). The number of cells is indicated in parentheses above the graph’s bars.
Figure 5
Figure 5
Effect of pre-exposure to IVM on the activation of GluClα/β receptors by Glu. (A) Representative current traces of the potentiation effect exerted by IVM on Glu-elicited responses in cells co-transfected with the indicated subunits. Glu concentrations before and after IVM application: 0.3 mM (upper trace); 1 mM (lower trace). IVM concentrations: 7 nM (upper trace); 50 nM (lower trace). Supplementary Figure S1 shows magnification of the lower trace. Inset, fold-potentiation for the GluClαWT/βWT (5.9 ± 0.6) and GluClαF276A/βWT (17.9 ± 1.8) receptors. Data are mean ± SEM. The number of determinations is indicated in white; ***P < 0.001. (B,C) Representative current traces elicited by increasing Glu concentrations after IVM pre-application. The time of delay between the end of IVM application and the beginning of Glu application was 20 s. IVM concentrations, as in (A). Oblique lettering indicate the expressed subunits. (D) Glu dose-response curves for experiments exemplified in (B,C). Dashed curves correspond to measurements performed after pre-exposure to IVM in cells expressing the GluClαWT/βWT (purple) or GluClαF276A/βWT (green) receptors. Curves were fitted as in Figure 3A (r2 > 0.98). Error bars correspond to SEM. Continuous curves correspond to measurements performed without pre-exposure to IVM (taken from Figure 3A). Glu-EC50 after pre-exposure to IVM: 0.3 ± 0.03 mM for the GluClαWT/βWT receptor, and 1.1 ± 0.1 mM for the GluClαF276A/βWT receptor (P < 0.0001). Hill coefficients of activation by Glu for the WT and mutant receptors (dashed curves): 1.2 ± 0.07 and 1.5 ± 0.03, respectively (P < 0.003). Statistical significance for the Hill coefficients before vs. after exposure to IVM: GluClαWT/βWT receptor, P < 0.001; and GluClαF276A/βWT receptor, P < 0.04. (E) Fold decrease in Glu-EC50 observed after pre-exposure to IVM. Data in (D,E) are mean ± SEM; number of determinations in white. ** 0.001 < P < 0.005.
Figure 6
Figure 6
Responses of GluClα/β receptors to cumulative concentrations of IVM. (A,B) Representative current traces measured in cells co-transfected with the indicated subunits. Horizontal bars correspond to applications of IVM in increasing nanomolar concentrations, as indicated above the bars. Recordings were performed at −60 mV. (C) IVM dose-response curves for experiments exemplified in (A,B). The Curves were fitted to the averaged data points with a nonlinear regression using the Hill equation (Equation 1) (r2 > 0.98). Error bars correspond to SEM. IVM-EC50 values for the GluClαWT/βWT and GluClαF276A/βWT receptors are 40 ± 10 nM and 802 ± 170 nM, respectively (mean ± SEM of six determinations for each receptor type; P = 0.01). Hill coefficients of activation by IVM for the GluClαWT/βWT and GluClαF276A/βWT receptors are 1.5 ± 0.2 and 3.5 ± 0.40, respectively (mean ± SEM; P = 0.001).

Similar articles

Cited by

References

    1. Absalom N. L., Lewis T. M., Kaplan W., Pierce K. D., Schofield P. R. (2003). Role of charged residues in coupling ligand binding and channel activation in the extracellular domain of the glycine receptor. J. Biol. Chem. 278, 50151–50157. 10.1074/jbc.M305357200 - DOI - PubMed
    1. Adelsberger H., Lepier A., Dudel J. (2000). Activation of rat recombinant α1β2γ2S GABAA receptor by the insecticide ivermectin. Eur. J. Pharmacol. 394, 163–170. 10.1016/s0014-2999(00)00164-3 - DOI - PubMed
    1. Akabas M. H., Karlin A. (1995). Identification of acetylcholine receptor channel-lining residues in the M1 segment of the α-subunit. Biochemistry 34, 12496–12500. 10.1021/bi00039a002 - DOI - PubMed
    1. Akk G., Steinbach J. H. (2011). Structural studies of the actions of anesthetic drugs on the γ-aminobutyric acid type A receptor. Anesthesiology 115, 1338–1348. 10.1097/ALN.0b013e3182315d93 - DOI - PMC - PubMed
    1. Arevalo E., Chiara D. C., Forman S. A., Cohen J. B., Miller K. W. (2005). Gating-enhanced accessibility of hydrophobic sites within the transmembrane region of the nicotinic acetylcholine receptor’s δ-subunit. A time-resolved photolabeling study. J. Biol. Chem. 280, 13631–13640. 10.1074/jbc.M413911200 - DOI - PubMed

LinkOut - more resources