

Gene expression profiling during the embryo-to-larva transition in the giant red sea urchin Mesocentrotus franciscanus
- PMID: 28428870
- PMCID: PMC5395446
- DOI: 10.1002/ece3.2850
Gene expression profiling during the embryo-to-larva transition in the giant red sea urchin Mesocentrotus franciscanus
Abstract
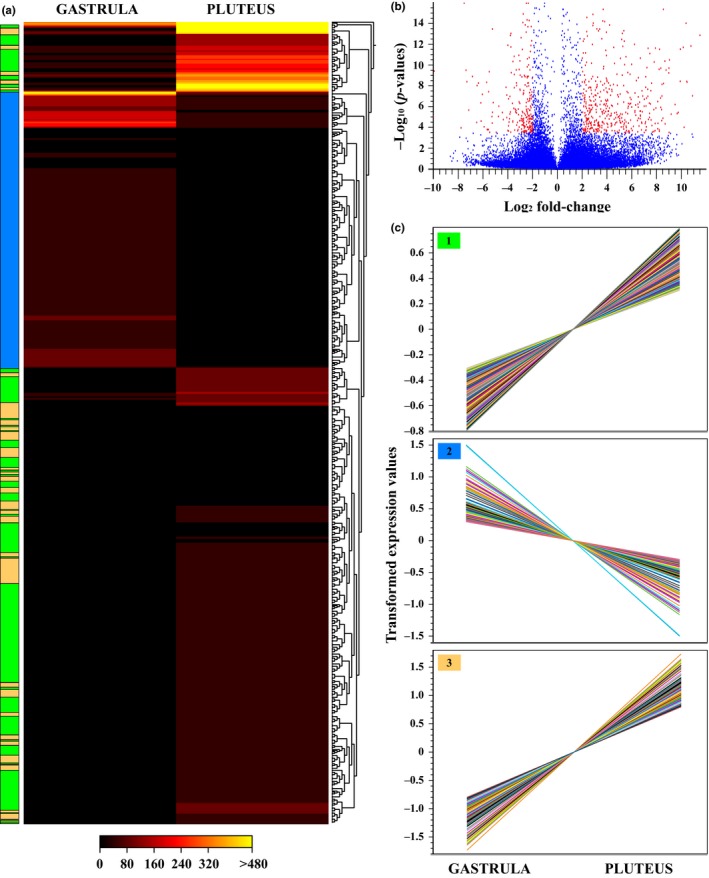
In echinoderms, major morphological transitions during early development are attributed to different genetic interactions and changes in global expression patterns that shape the regulatory program for the specification of embryonic territories. In order more thoroughly to understand these biological and molecular processes, we examined the transcriptome structure and expression profiles during the embryo-to-larva transition of a keystone species, the giant red sea urchin Mesocentrotus franciscanus. Using a de novo assembly approach, we obtained 176,885 transcripts from which 60,439 (34%) had significant alignments to known proteins. From these transcripts, ~80% were functionally annotated allowing the identification of ~2,600 functional, structural, and regulatory genes involved in developmental process. Analysis of expression profiles between gastrula and pluteus stages of M. franciscanus revealed 791 differentially expressed genes with 251 GO overrepresented terms. For gastrula, up-regulated GO terms were mainly linked to cell differentiation and signal transduction involved in cell cycle checkpoints. In the pluteus stage, major GO terms were associated with phosphoprotein phosphatase activity, muscle contraction, and olfactory behavior, among others. Our evolutionary comparative analysis revealed that several of these genes and functional pathways are highly conserved among echinoids, holothuroids, and ophiuroids.
Keywords: Mesocentrotus franciscanus; developmental transcriptome; early ontogeny; echinoderm; gene expression; larvae.
Figures


Similar articles
-
Transcriptional profiles of early stage red sea urchins (Mesocentrotus franciscanus) reveal differential regulation of gene expression across development.Mar Genomics. 2019 Dec;48:100692. doi: 10.1016/j.margen.2019.05.007. Epub 2019 Jun 19. Mar Genomics. 2019. PMID: 31227413
-
Gene expression patterns of red sea urchins (Mesocentrotus franciscanus) exposed to different combinations of temperature and pCO2 during early development.BMC Genomics. 2021 Jan 7;22(1):32. doi: 10.1186/s12864-020-07327-x. BMC Genomics. 2021. PMID: 33413121 Free PMC article.
-
Sequencing and analysis of the gastrula transcriptome of the brittle star Ophiocoma wendtii.Evodevo. 2012 Sep 3;3(1):19. doi: 10.1186/2041-9139-3-19. Evodevo. 2012. PMID: 22938175 Free PMC article.
-
Culturing echinoderm larvae through metamorphosis.Methods Cell Biol. 2019;150:125-169. doi: 10.1016/bs.mcb.2018.11.004. Epub 2018 Dec 27. Methods Cell Biol. 2019. PMID: 30777174 Review.
-
Developmental gene regulatory network evolution: insights from comparative studies in echinoderms.Genesis. 2014 Mar;52(3):193-207. doi: 10.1002/dvg.22757. Epub 2014 Mar 6. Genesis. 2014. PMID: 24549884 Review.
Cited by
-
The developmental transcriptomes of two sea biscuit species with differing larval types.BMC Genomics. 2018 May 18;19(1):368. doi: 10.1186/s12864-018-4768-9. BMC Genomics. 2018. PMID: 29776340 Free PMC article.
-
Dynamic Expression and Gene Regulation of MicroRNAs During Bighead Carp (Hypophthalmichthys nobilis) Early Development.Front Genet. 2022 Jan 19;12:821403. doi: 10.3389/fgene.2021.821403. eCollection 2021. Front Genet. 2022. PMID: 35126475 Free PMC article.
-
RNA-Seq reveals divergent gene expression between larvae with contrasting trophic modes in the poecilogonous polychaete Boccardia wellingtonensis.Sci Rep. 2021 Jul 22;11(1):14997. doi: 10.1038/s41598-021-94646-y. Sci Rep. 2021. PMID: 34294855 Free PMC article.
-
Conservation of cis-Regulatory Syntax Underlying Deuterostome Gastrulation.Cells. 2024 Jun 28;13(13):1121. doi: 10.3390/cells13131121. Cells. 2024. PMID: 38994973 Free PMC article.
-
Population structure, genetic connectivity, and adaptation in the Olympia oyster (Ostrea lurida) along the west coast of North America.Evol Appl. 2019 Feb 28;12(5):923-939. doi: 10.1111/eva.12766. eCollection 2019 Jun. Evol Appl. 2019. PMID: 31080505 Free PMC article.
References
-
- Angerer, L. M. , & Angerer, R. C. (2000). Animal‐vegetal axis patterning mechanisms in the early sea urchin embryo. Developmental Biology, 218, 1–12. - PubMed
-
- Arenas‐Mena, C. , Wong, K. S. Y. , & Arandi‐Foroshani, N. R. (2007). Histone H2A.Z expression in two indirectly developing marine invertebrates correlates with undifferentiated and multipotent cells. Evolution & Development, 9, 231–243. - PubMed
-
- Bilić, J. , Huang, Y. , Davidson, G. , Zimmermann, T. , Cruciat, C. , Bienz, M. , & Niehrs, C. (2007). Wnt induces LRP6 signalosomes and promotes dishevelled‐dependent LRP6 phosphorylation. Science, 316, 1619–1622. - PubMed
Associated data
LinkOut - more resources
Full Text Sources
Other Literature Sources
Miscellaneous
