

A systems biology approach to investigating the influence of exercise and fitness on the composition of leukocytes in peripheral blood
- PMID: 28428879
- PMCID: PMC5394617
- DOI: 10.1186/s40425-017-0231-8
A systems biology approach to investigating the influence of exercise and fitness on the composition of leukocytes in peripheral blood
Abstract
Background: Exercise immunology has become a growing field in the past 20 years, with an emphasis on understanding how different forms of exercise affect immune function. Mechanistic studies are beginning to shed light on how exercise may impair the development of cancer or be used to augment cancer treatment. The beneficial effects of exercise on the immune system may be exploited to improve patient responses to cancer immunotherapy.
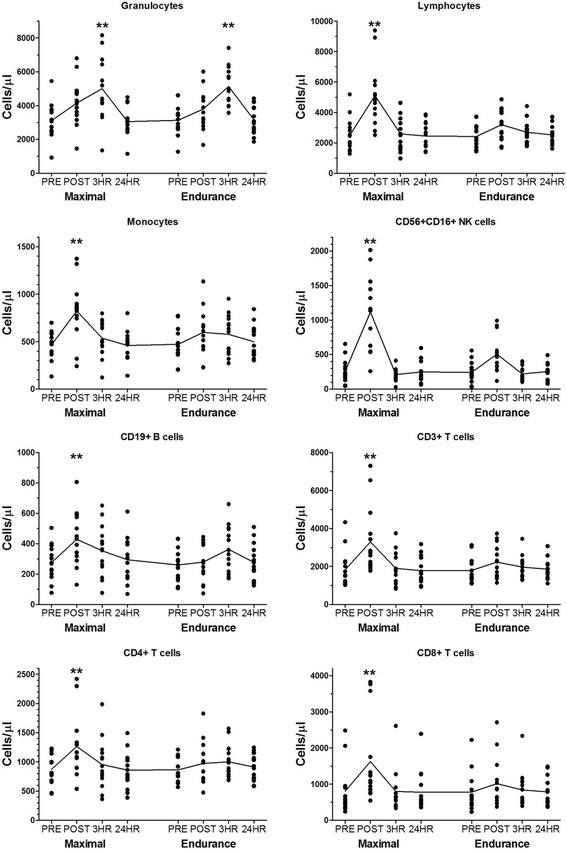
Methods: We investigated the effects of acute exercise on the composition of peripheral blood leukocytes over time in a male population of varying fitness. Subjects performed a brief maximal intensity cycling regimen and a longer less intense cycling regimen at separate visits. Leukocytes were measured by multi-parameter flow cytometry of more than 50 immunophenotypes for each collection sample.
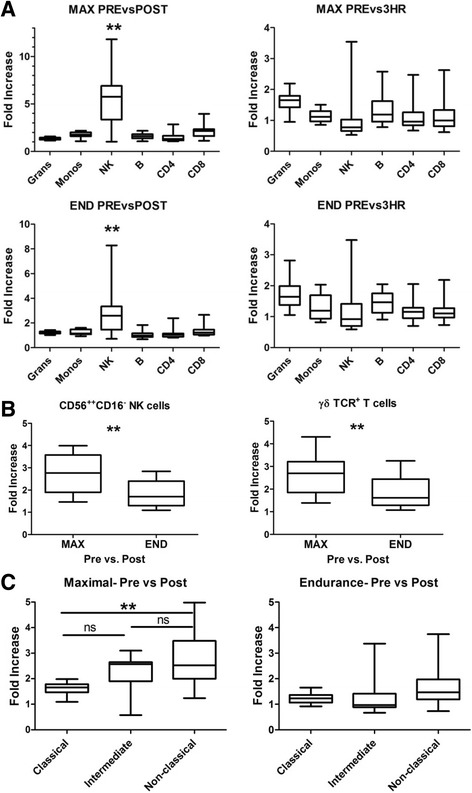
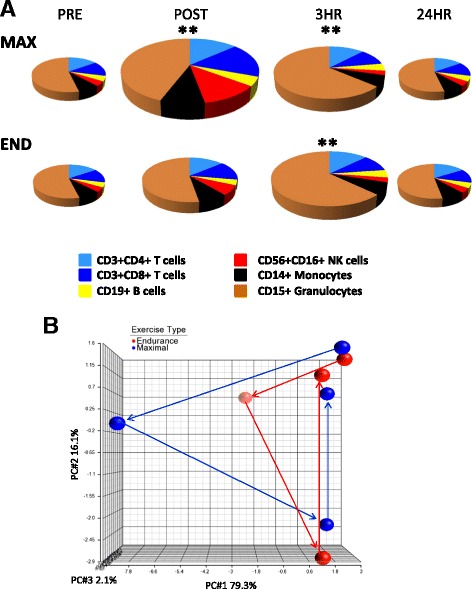
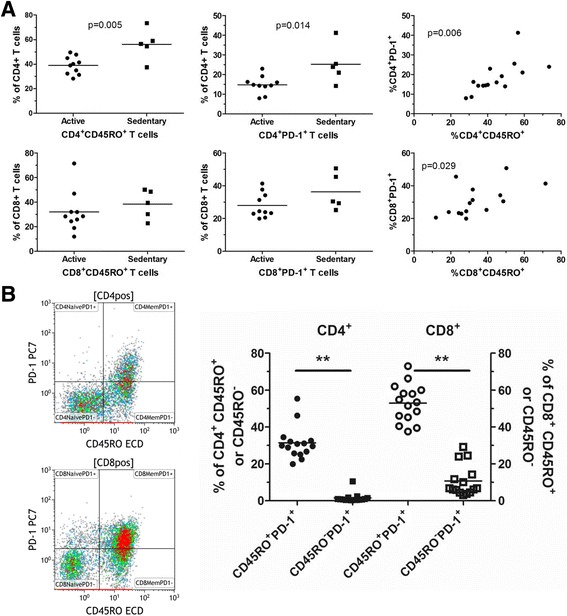
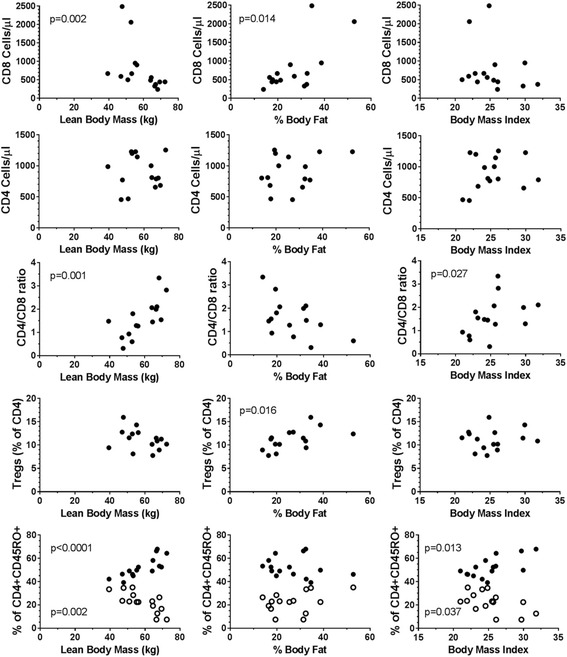
Results: We found a differential induction of leukocytosis dependent on exercise intensity and duration. Cytotoxic natural killer cells demonstrated the greatest increase (average of 5.6 fold) immediately post-maximal exercise whereas CD15+ granulocytes demonstrated the largest increase at 3 h post-maximal exercise (1.6 fold). The longer, less intense endurance exercise resulted in an attenuated leukocytosis. Induction of leukocytosis did not differ in our limited study of active (n = 10) and sedentary (n = 5) subjects to exercise although we found that in baseline samples, sedentary individuals had elevated percentages of CD45RO+ memory CD4+ T cells and elevated proportions of CD4+ T cells expressing the negative immune regulator programmed death-1 (PD-1). Finally, we identified several leukocytes whose presence correlated with obesity related fitness parameters.
Conclusions: Our data suggests that leukocytes subsets are differentially mobilized into the peripheral blood and dependent on the intensity and duration of exercise. Pre-existing compositional differences of leukocytes were associated with various fitness parameters.
Keywords: Exercise immunology; Fitness; Monocytes; NK cells; Peripheral blood leukocytes; T cells.
Figures
Similar articles
-
Exercise and blood lymphocyte subset responses: intensity, duration, and subject fitness effects.J Appl Physiol (1985). 1990 Jul;69(1):251-60. doi: 10.1152/jappl.1990.69.1.251. J Appl Physiol (1985). 1990. PMID: 2144268 Clinical Trial.
-
Differential leukocytosis and lymphocyte mitogenic response to acute maximal exercise in the young and old.Med Sci Sports Exerc. 1999 Jun;31(6):829-36. doi: 10.1097/00005768-199906000-00011. Med Sci Sports Exerc. 1999. PMID: 10378910
-
The effects of incremental submaximal exercise on circulating leukocytes in physically active and sedentary males and females.Eur J Appl Physiol Occup Physiol. 1996;74(3):211-8. doi: 10.1007/BF00377443. Eur J Appl Physiol Occup Physiol. 1996. PMID: 8897027 Clinical Trial.
-
The acute immune response to exercise: what does it mean?Int J Sports Med. 1997 Mar;18 Suppl 1:S28-45. doi: 10.1055/s-2007-972698. Int J Sports Med. 1997. PMID: 9129261 Review.
-
Exercise immunology: practical applications.Int J Sports Med. 1997 Mar;18 Suppl 1:S91-100. doi: 10.1055/s-2007-972705. Int J Sports Med. 1997. PMID: 9129268 Review.
Cited by
-
Individual immune cell and cytokine profiles determine platelet-rich plasma composition.Arthritis Res Ther. 2023 Jan 10;25(1):6. doi: 10.1186/s13075-022-02969-6. Arthritis Res Ther. 2023. PMID: 36627721 Free PMC article.
-
Immunosenescence, Physical Exercise, and their Implications in Tumor Immunity and Immunotherapy.Int J Biol Sci. 2025 Jan 6;21(3):910-939. doi: 10.7150/ijbs.100948. eCollection 2025. Int J Biol Sci. 2025. PMID: 39897036 Free PMC article. Review.
-
Combined effects of exercise and immuno-chemotherapy treatments on tumor growth in MC38 colorectal cancer-bearing mice.Front Immunol. 2024 Feb 15;15:1368550. doi: 10.3389/fimmu.2024.1368550. eCollection 2024. Front Immunol. 2024. PMID: 38426110 Free PMC article.
-
PD1 Expression in EGFRvIII-Directed CAR T Cell Infusion Product for Glioblastoma Is Associated with Clinical Response.Front Immunol. 2022 May 6;13:872756. doi: 10.3389/fimmu.2022.872756. eCollection 2022. Front Immunol. 2022. PMID: 35603165 Free PMC article.
-
Influence of Exercise on Exhausted and Senescent T Cells: A Systematic Review.Front Physiol. 2021 Aug 20;12:668327. doi: 10.3389/fphys.2021.668327. eCollection 2021. Front Physiol. 2021. PMID: 34489717 Free PMC article.
References
Publication types
MeSH terms
LinkOut - more resources
Full Text Sources
Other Literature Sources
Medical
Research Materials
Miscellaneous