. 2017 Jul;215(1):140-156.
doi: 10.1111/nph.14557. Epub 2017 Apr 21.

Finding a partner in the ocean: molecular and evolutionary bases of the response to sexual cues in a planktonic diatom

Affiliations

Finding a partner in the ocean: molecular and evolutionary bases of the response to sexual cues in a planktonic diatom

Swaraj Basu et al. New Phytol. 2017 Jul.

Abstract

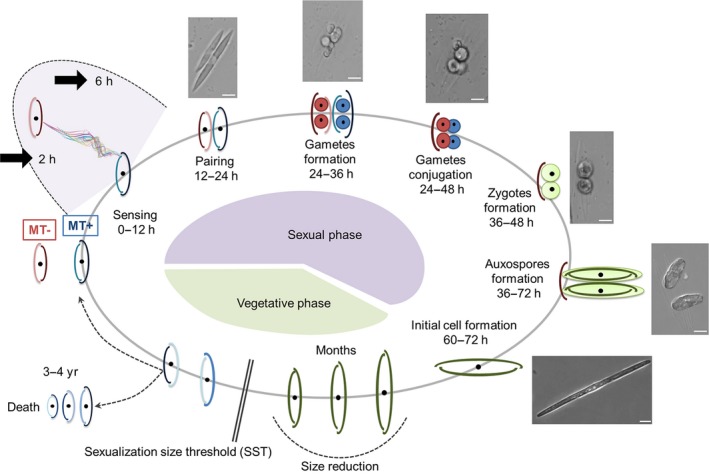
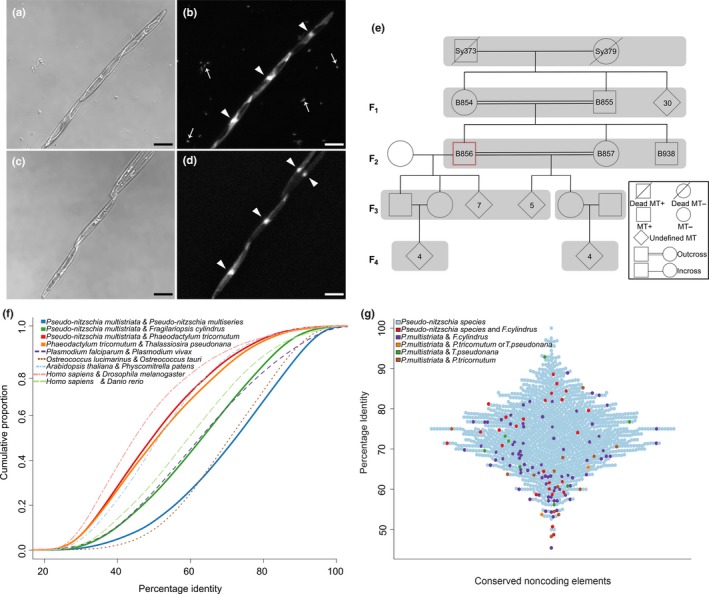
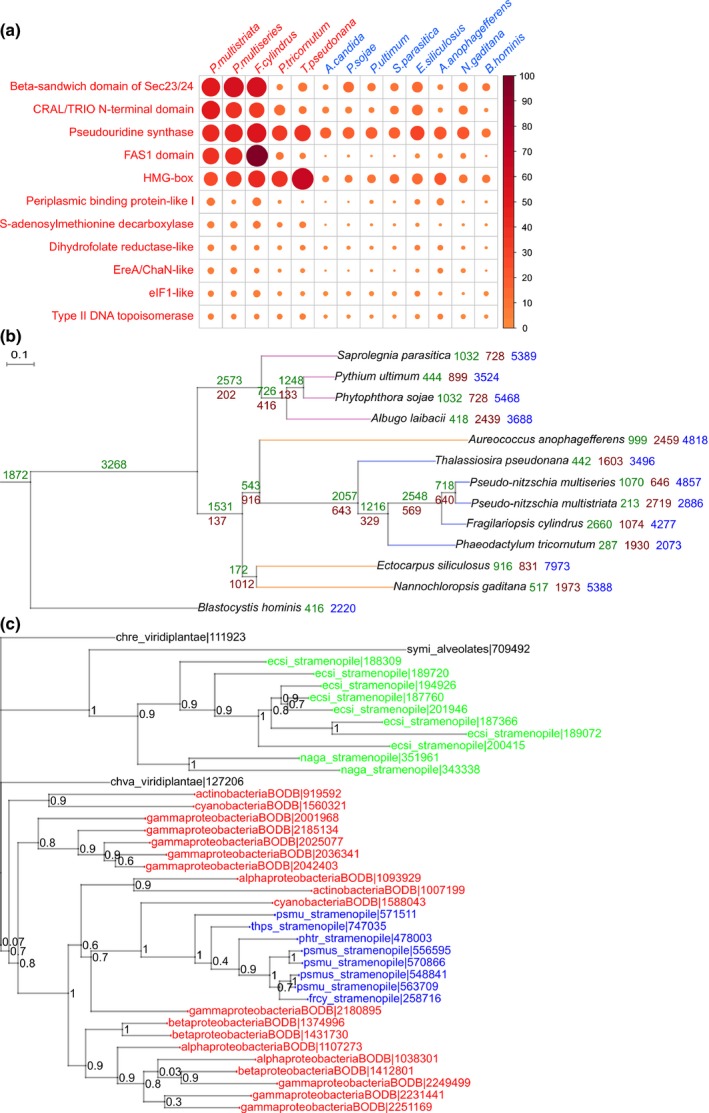
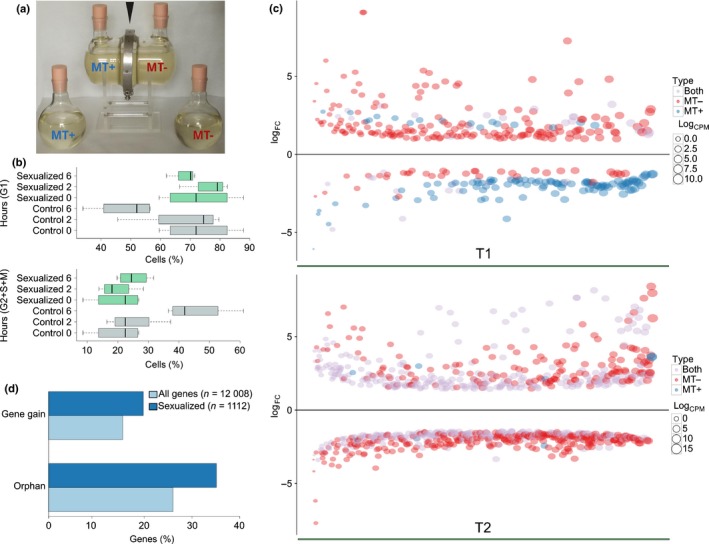
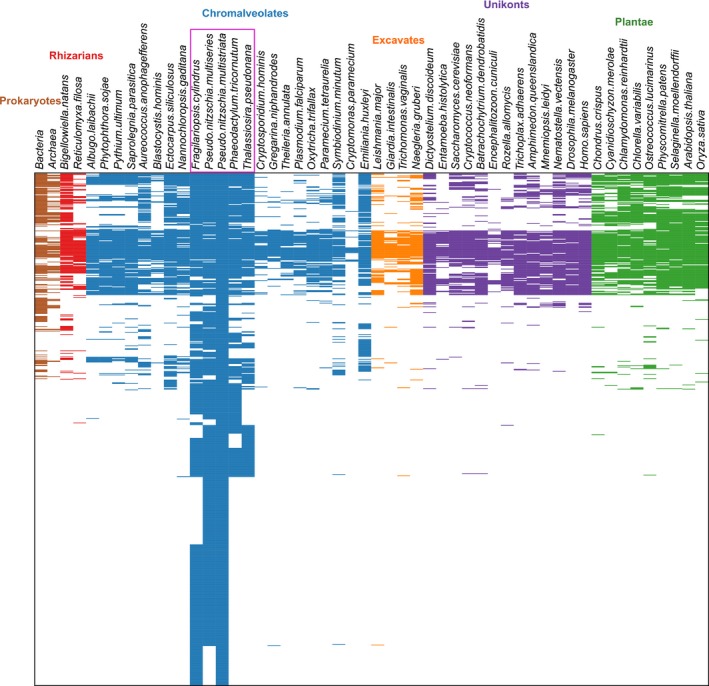
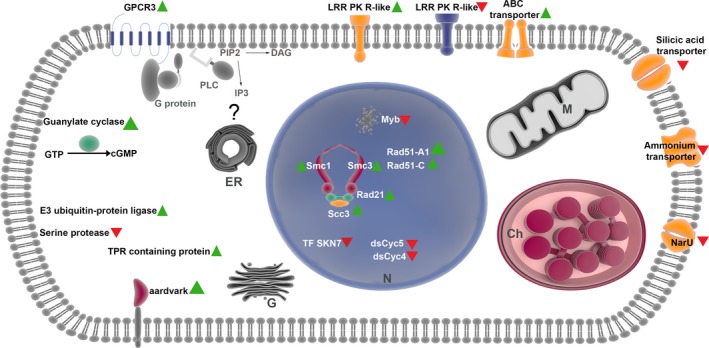
Microalgae play a major role as primary producers in aquatic ecosystems. Cell signalling regulates their interactions with the environment and other organisms, yet this process in phytoplankton is poorly defined. Using the marine planktonic diatom Pseudo-nitzschia multistriata, we investigated the cell response to cues released during sexual reproduction, an event that demands strong regulatory mechanisms and impacts on population dynamics. We sequenced the genome of P. multistriata and performed phylogenomic and transcriptomic analyses, which allowed the definition of gene gains and losses, horizontal gene transfers, conservation and evolutionary rate of sex-related genes. We also identified a small number of conserved noncoding elements. Sexual reproduction impacted on cell cycle progression and induced an asymmetric response of the opposite mating types. G protein-coupled receptors and cyclic guanosine monophosphate (cGMP) are implicated in the response to sexual cues, which overall entails a modulation of cell cycle, meiosis-related and nutrient transporter genes, suggesting a fine control of nutrient uptake even under nutrient-replete conditions. The controllable life cycle and the genome sequence of P. multistriata allow the reconstruction of changes occurring in diatoms in a key phase of their life cycle, providing hints on the evolution and putative function of their genes and empowering studies on sexual reproduction.

Keywords: Pseudo-nitzschia multistriata; algae; diatom; genomics; mating type; phytoplankton; sexual reproduction; signal transduction.


Figures

Figure 1
Figure 1
Schematic drawing of the life cycle of Pseudo‐nitzschia multistriata. Starting clockwise from the bottom portion of the cycle, the vegetative phase is characterized by progressive cell size reduction of the population imposed by the rigid silica wall, made up of two unequal thecae. During this process, the cells reach the sexualization size threshold (SST) and can either keep decreasing in size until death, or undergo sexual reproduction and escape the miniaturization process, producing large cells. In the heterothallic P. multistriata, sex can occur only if strains of opposite mating type come into contact. The perception of chemical cues deriving from the mating partner (0–12 h) brings cells of opposite mating type to pair (12–24 h). The formation of gametes (24–36 h) takes place following meiosis. Conjugation of the haploid gametes (24–48 h) produces two expandable zygotes (36–48 h) that develop into auxospores (36–72 h). Within each auxospore, an initial cell of maximum size is synthesized (60–72 h), restoring the vegetative phase of the cycle. The time interval for each stage is indicated. Representative microscopic images of the different stages are shown outside the circle; bar, 10 μm. Thick black arrows mark the sampling time points for the experiments described in this work. MT, mating type.
Figure 2
Figure 2
Main features of Pseudo‐nitzschia multistriata and its genome. (a, b) Microscopic images showing three cells in a chain in a normal culture with bacteria, in bright field and fluorescence, respectively, and (c, d) four cells in an axenic culture without bacteria. DAPI (4′,6‐diamidino‐2‐phenylindole) stains DNA in cell nuclei (arrowheads) and bacterial nucleoids (thin arrows). Bars, 10 μm. (e) Pseudo‐nitzschia multistriata pedigree showing four generations. Strain B856 was used to produce the genome sequence. (f) Estimation of species divergence based on amino acid identity of coding genes. The x‐axis represents the average percentage identity of BLASTp hits with maximum scores for the first species against the second. The y‐axis represents the cumulative proportion of the genes showing a given percentage identity. (g) Distribution of percentage identity for noncoding elements conserved between Pseudo‐nitzschia species (light blue dots), among P. multistriata, Pseudo‐nitzschia multiseries and Fragilariopsis cylindrus (red dots) and in other combinations. The x‐axis represents the identified conserved noncoding elements, stacked for best visualization of their distribution of conservation.
Figure 3
Figure 3
Evolution of gene families in diatoms. (a) Expansion of gene families within diatoms. Each column represents a stramenopile species and each row represents a given gene family showing expansion within diatoms as compared with other Stramenopiles. Names of diatom species are given in red, whereas names of other Stramenopiles are given in blue. The colour intensity and size of the circles are proportional to the number of genes falling under the given gene family. (b) A species tree of Stramenopiles derived using a maximum likelihood approach, built using 85 genes showing one‐to‐one orthology among the selected species. The selected genes include genes with a wide range of functions. Branch lengths are drawn to scale. At each branch point, the number of gene family gains and losses is indicated in green and brown, respectively. The number of orphans present in each organism is shown in blue. (c) Phylogenetic tree for a cluster containing proteins annotated with an uncharacterized cystatin‐like domain, conserved in bacteria. The tree topology depicts a potential horizontal gene transfer event which led to the introduction of the gene within diatoms. The regions coloured red, blue and green represent bacteria, diatoms and other Stramenopiles, respectively. Species codes used in the tree: ecsi, Ectocarpus siliculosus; naga, Nannochloropsis gaditana; symi, Symbiodinium minutum; psmu, Pseudo‐nitzschia multistriata; psmus, Pseudo‐nitzschia multiseries; frcy, Fragilariopsis cylindrus; phtr, Phaeodactylum tricornutum; thps, Thalassiosira pseudonana; chre, Chlamydomonas reinhardtii; chva, Chlorella variabilis; BODB suffix is used for all bacterial species. For the correspondence between protein IDs used in this tree and GenBank IDs, see Supporting Information Methods S1.
Figure 4
Figure 4
Cell cycle and gene expression changes in the early stages of sexual reproduction. (a) Co‐culture glass apparatus containing cultures of opposite mating type (MT) separated by a membrane held by a metal ring (black arrowhead), and control bottles containing each of the two MTs. (b) Cell cycle phases of MT+ and MT– control (grey) and sexualized (green) samples represented by the relative percentage of cells in G1 (upper) and S + G2 + M (lower) phases, at the beginning of the experiment (0) and 2 and 6 h later. Whiskers in the boxplot extend to ± 1.5 × interquartile range (IQR). (c) Plot showing the logFC (fold change) (y‐axis) of genes differentially expressed, ordered according to the logCPM (counts per million) on the x‐axis. (d) Percentage of orphan genes and gene gains in the set of genes differentially expressed at the onset of the sexual phase in Pseudo‐nitzschia multistriata compared with the percentages of the same classes in the entire gene set.
Figure 5
Figure 5
Conservation of the genes differentially expressed in the experiments described in this work. Conservation is shown as the presence/absence of a horizontal line in 52 different species belonging to Prokaryotes, Rhizarians, Chromalveolates, Excavates, Unikonts and Plantae.
Figure 6
Figure 6
Cell response to sexual cues. Diagrammatic representation of a Pseudo‐nitzschia multistriata cell with the principal genes involved in the response to chemical cues acting at the beginning of sexual reproduction. Green triangles represent upregulation and red triangles downregulation of expression. PLC, Phospholipase C; DAG, diacylglycerol; PIP2, phosphatidylinositol biphosphate; IP3, inositol trisphosphate; GTP, Guanosine‐5′‐triphosphate; N, nucleus; ER, endoplasmic reticulum; M, mitochondrion; Ch, chloroplast; G, Golgi; LRR, leucine‐rich repeat.

Similar articles

Cited by

References

    1. Adelfi MG, Borra M, Sanges R, Montresor M, Fontana A, Ferrante MI. 2014. Selection and validation of reference genes for qPCR analysis in the pennate diatoms Pseudo‐nitzschia multistriata and P. arenysensis . Journal of Experimental Marine Biology and Ecology 451: 74–81.
    1. Alvaro CG, Thorner J. 2016. Heterotrimeric G protein‐coupled receptor signaling in yeast mating pheromone response. Journal of Biological Chemistry 291: 7788–7795. - PMC - PubMed
    1. Armbrust EV. 2009. The life of diatoms in the world's oceans. Nature 459: 185–192. - PubMed
    1. Armbrust EV, Berges JA, Bowler C, Green BR, Martinez D, Putnam NH, Zhou S, Allen AE, Apt KE, Bechner M et al 2004. The genome of the diatom Thalassiosira pseudonana: ecology, evolution, and metabolism. Science 306: 79–86. - PubMed
    1. Barkai N, Rose MD, Wingreen NS. 1998. Protease helps yeast find mating partners. Nature 396: 422–423. - PubMed

LinkOut - more resources