. 2017 Apr 21:8:15099.
doi: 10.1038/ncomms15099.

Clonal evolution in myelodysplastic syndromes

Affiliations

Clonal evolution in myelodysplastic syndromes

Pedro da Silva-Coelho et al. Nat Commun. .

Abstract

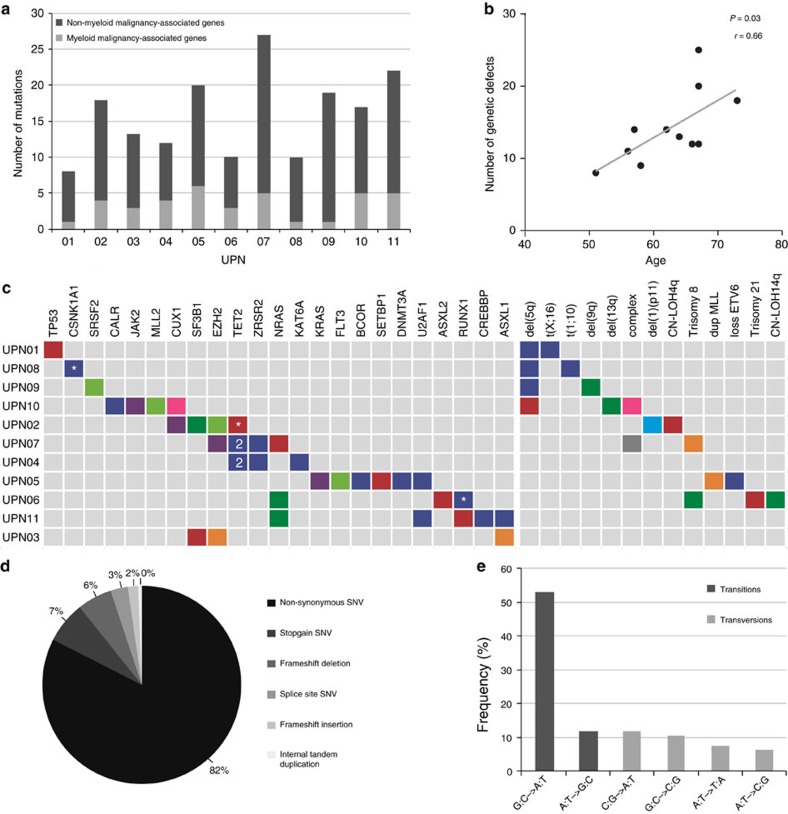
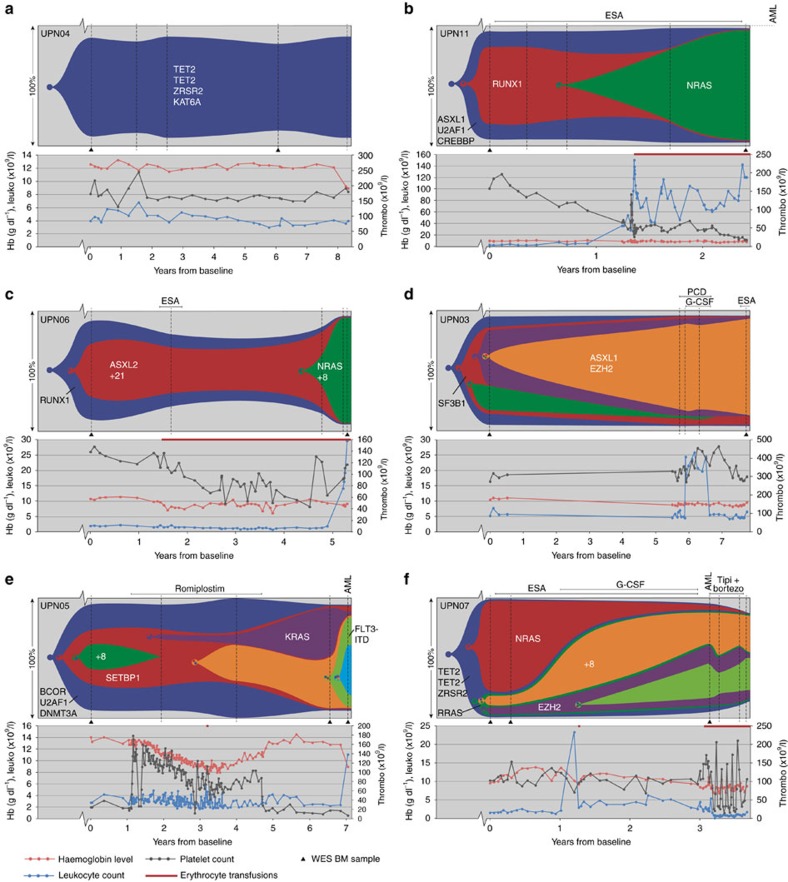
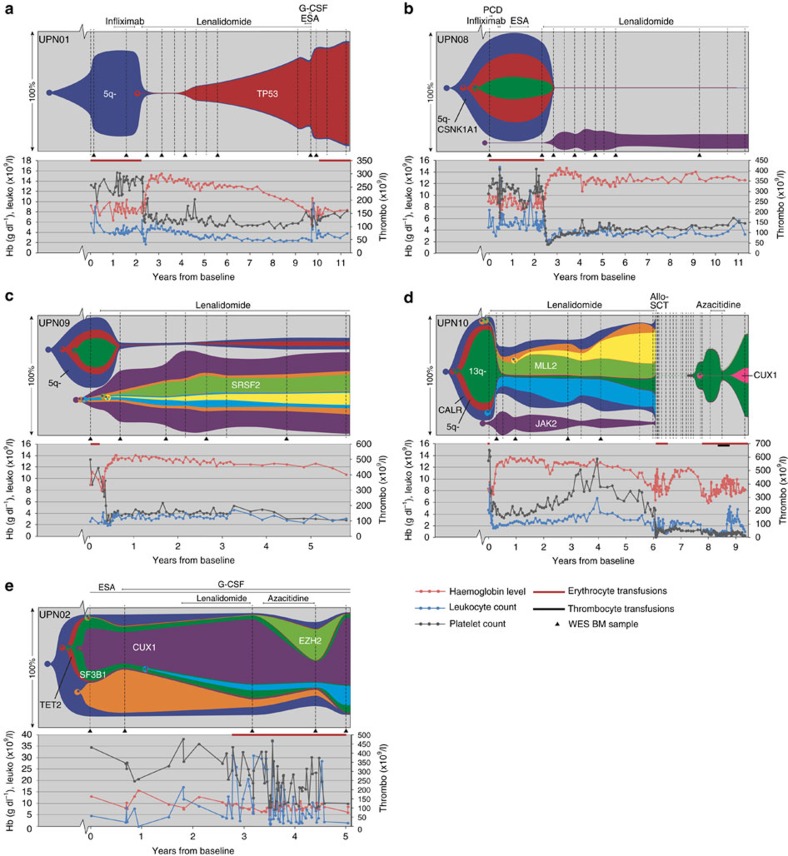
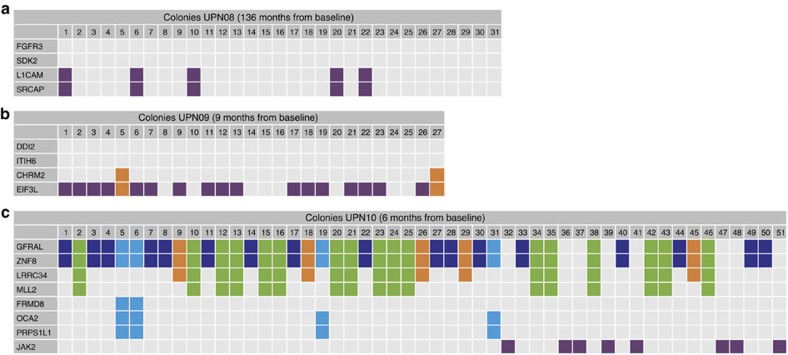
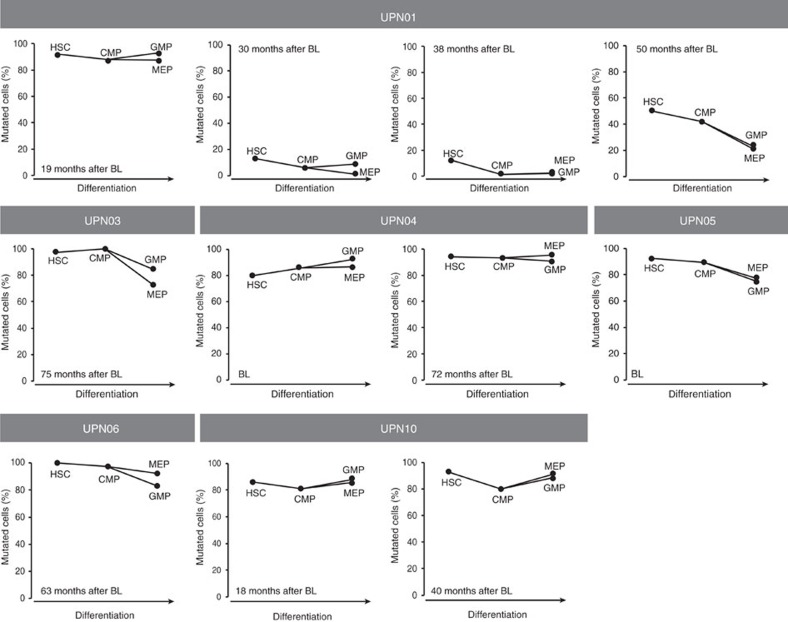
Cancer development is a dynamic process during which the successive accumulation of mutations results in cells with increasingly malignant characteristics. Here, we show the clonal evolution pattern in myelodysplastic syndrome (MDS) patients receiving supportive care, with or without lenalidomide (follow-up 2.5-11 years). Whole-exome and targeted deep sequencing at multiple time points during the disease course reveals that both linear and branched evolutionary patterns occur with and without disease-modifying treatment. The application of disease-modifying therapy may create an evolutionary bottleneck after which more complex MDS, but also unrelated clones of haematopoietic cells, may emerge. In addition, subclones that acquired an additional mutation associated with treatment resistance (TP53) or disease progression (NRAS, KRAS) may be detected months before clinical changes become apparent. Monitoring the genetic landscape during the disease may help to guide treatment decisions.


Conflict of interest statement

The authors declare no competing financial interests.

Figures

Figure 1
Figure 1. Genetic defects in 11 MDS patients.
(a) Number of acquired mutations in 11 patients with MDS, as determined by whole-exome sequencing at several time points (Supplementary Data 1) and confirmed by amplicon-based deep sequencing. In light grey, the number of mutations in genes previously implicated in the pathogenesis of myeloid malignancies are indicated (driver mutations), and in dark grey the number of mutations not previously implicated in myeloid malignancies (putative passenger mutations). (b) A positive correlation could be observed between age and the number of genetic defects (genetic and cytogenetic defects) at the time of first sampling. Pearson’s correlation coefficient (including a two-tailed P value calculated by Student’s t-test) was determined. (c) For each patient, all mutations in genes known to be recurrently mutated in myeloid malignancies are depicted as well as all cytogenetic defects detected by high-resolution SNP array and/or karyotype analysis. The colours match with the (sub)clones as depicted in Figs 2 and 3. *Indicates a mutated gene that is also affected by a copy number gain or loss or by a copy-neutral loss of heterozygosity (CN-LOH); ‘2’ indicates two different mutations affecting the same gene. (d) Distribution of the different types of alterations detected in the total set of patients. (e) Different types of single-nucleotide changes detected in all patients, with transitions in dark grey and transversions in light grey.
Figure 2
Figure 2. Clonal evolution patterns in the bone marrow of MDS patients who received supportive care only.
(a) Patient with one single MDS clone without clonal evolution during the 8 years of follow-up. (b,c) Two patients showing linear clonal evolution. In both cases, a heterozygous NRAS mutation was acquired (green clones), associated with increased leukocyte levels and disease progression. (df) Patients with a more complex branching clonal evolution pattern. Vertical dashed lines indicate the investigated sampling moments. The samples indicated with a triangle were analysed by WES. Subsequently, all samples were analysed with targeted deep sequencing. Only important genetic aberrations are indicated; a full list of genetic aberrations can be found in Supplementary Figs 3 and 4, Supplementary Table 3 and Supplementary Data 1 and 2. PCD, pentoxifylline, ciprofloxacin and dexamethasone; tipi+bortezo, tipifarnib and bortezomib.
Figure 3
Figure 3. Clonal evolution patterns in the bone marrow of MDS patients who were treated with lenalidomide.
(ad) Four patients harbouring a del(5q) who responded well to lenalidomide treatment. UPN01 (a) shows a linear evolution pattern. In UPN08, 09 and 10 (bd), non-MDS-related clonal populations increased in frequency under lenalidomide treatment. The MDS clonal populations followed a linear evolution in UPN08 and 09, and a branched evolution in UPN10. (e) Patient with a normal karyotype and without a major response to lenalidomide treatment. This patient shows a branching evolutionary pattern, with a change in clonal composition under 5-azacitidine treatment. Vertical dashed lines indicate the investigated sampling moments. The samples indicated with a triangle were analysed by WES. Subsequently, all samples were analysed with targeted deep sequencing. Only important genetic aberrations are indicated; a full list of genetic aberrations can be found in Supplementary Figs 3 and 4, Supplementary Table 3 and Supplementary Data 1 and 2. PCD, pentoxifylline, ciprofloxacin and dexamethasone.
Figure 4
Figure 4. Sequencing of single-cell-derived colonies.
To determine which mutations are present together in a single cell and to confirm that cells from the unrelated clones do not harbour any of the ancestral mutations present in the MDS clone, we performed sequencing on single-cell-derived CFU-GEMM colonies. Representative mutations are sequenced from each (sub)clone. (a) UPN08: only colonies harbouring the two mutations linked to the unrelated clone are found at this time point. The two investigated mutations from the MDS clone are absent in these colonies. (b) UPN09: most colonies only contain an EIF3L mutation corresponding to the major unrelated clone. Two colonies harbour an additional CHRM2 mutation corresponding to a descendent of the major unrelated clone. The mutations from the MDS clone are absent in these colonies. (c) UPN10: the JAK2 clone is an independent clone not containing mutations from the major MDS clone. Furthermore, this analysis confirms that LRRC34 is a descendent of the major MDS clone that later also acquired an MLL2 mutation. The mutations in FRMD8, OCA2 and PRPS1L1 never co-occur with the LRRC34 and MLL2 mutations, indicating that these are separate clones. The FRMD8 mutation appears to be a later event than the acquisition of OCA2 and PRPS1L1. The absence of a mutation (VAF <5%) is indicated in grey. The presence of a mutation (VAF >40%) is indicated with a colour that corresponds to the clones in Fig. 3.
Figure 5
Figure 5. Percentage of MDS cells in various bone marrow stem and progenitor cell fractions.
From six MDS patients with sufficient material (UPN01, 03, 04, 05, 06 and 10), we sorted different bone marrow stem and progenitor cell fractions at various time points. Some minor differences in tumour burden are observed between the various fractions. BL, baseline; HSC, haematopoietic stem cell; CMP, common myeloid progenitor; GMP, granulocyte–macrophage progenitor; MEP, megakaryocyte–erythroid progenitor.

References

    1. Bejar R. et al.. Clinical effect of point mutations in myelodysplastic syndromes. N. Engl. J. Med. 364, 2496–2506 (2011). - PMC - PubMed
    1. Papaemmanuil E. et al.. Clinical and biological implications of driver mutations in myelodysplastic syndromes. Blood 122, 3616–3627 quiz 3699 (2013). - PMC - PubMed
    1. Haferlach T. et al.. Landscape of genetic lesions in 944 patients with myelodysplastic syndromes. Leukemia 28, 241–247 (2014). - PMC - PubMed
    1. Welch J. S. et al.. The origin and evolution of mutations in acute myeloid leukemia. Cell 150, 264–278 (2012). - PMC - PubMed
    1. Walter M. J. et al.. Clonal architecture of secondary acute myeloid leukemia. N. Engl. J. Med. 366, 1090–1098 (2012). - PMC - PubMed

Publication types

MeSH terms