. 2017 Apr 21:8:15074.
doi: 10.1038/ncomms15074.

The glutamate/cystine xCT antiporter antagonizes glutamine metabolism and reduces nutrient flexibility

Affiliations

The glutamate/cystine xCT antiporter antagonizes glutamine metabolism and reduces nutrient flexibility

Chun-Shik Shin et al. Nat Commun. .

Abstract

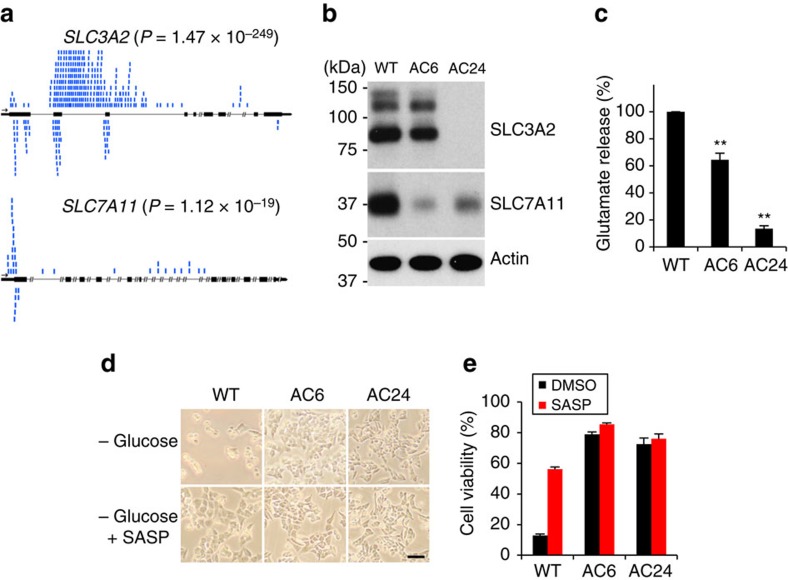
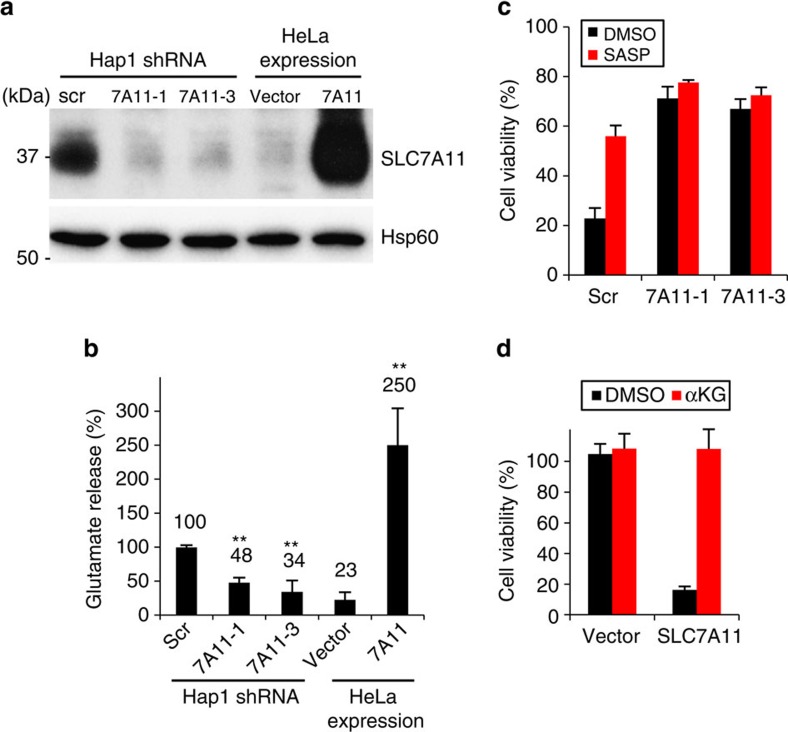
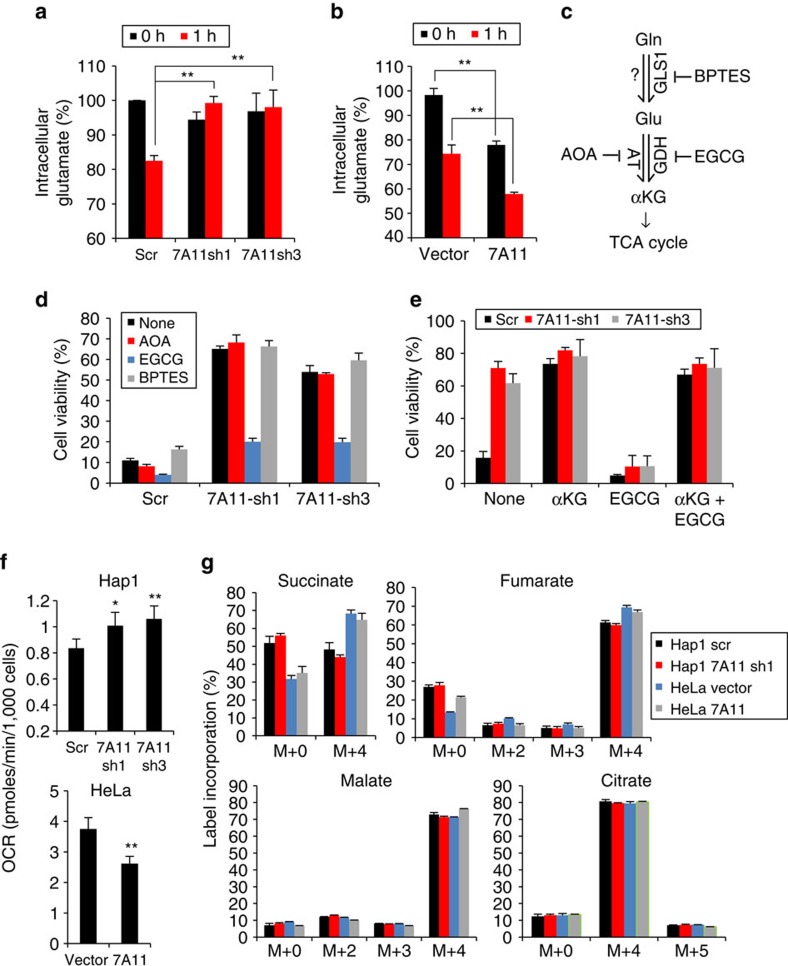
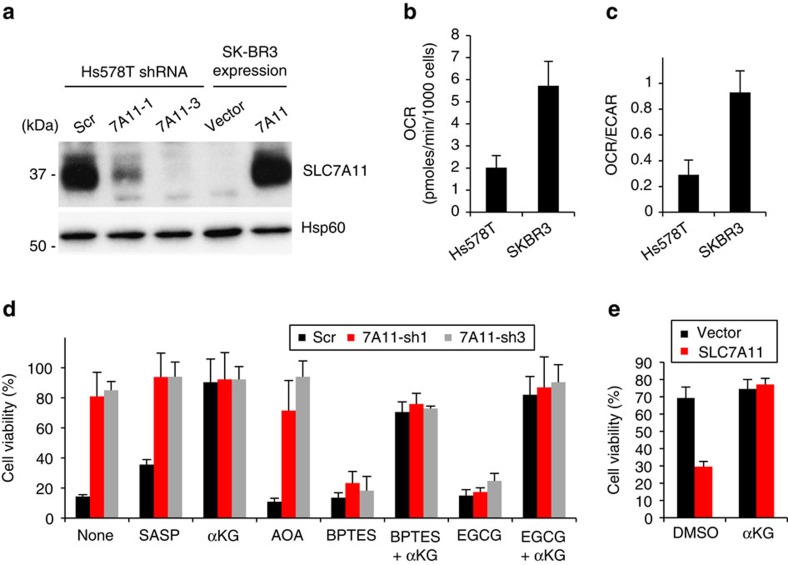
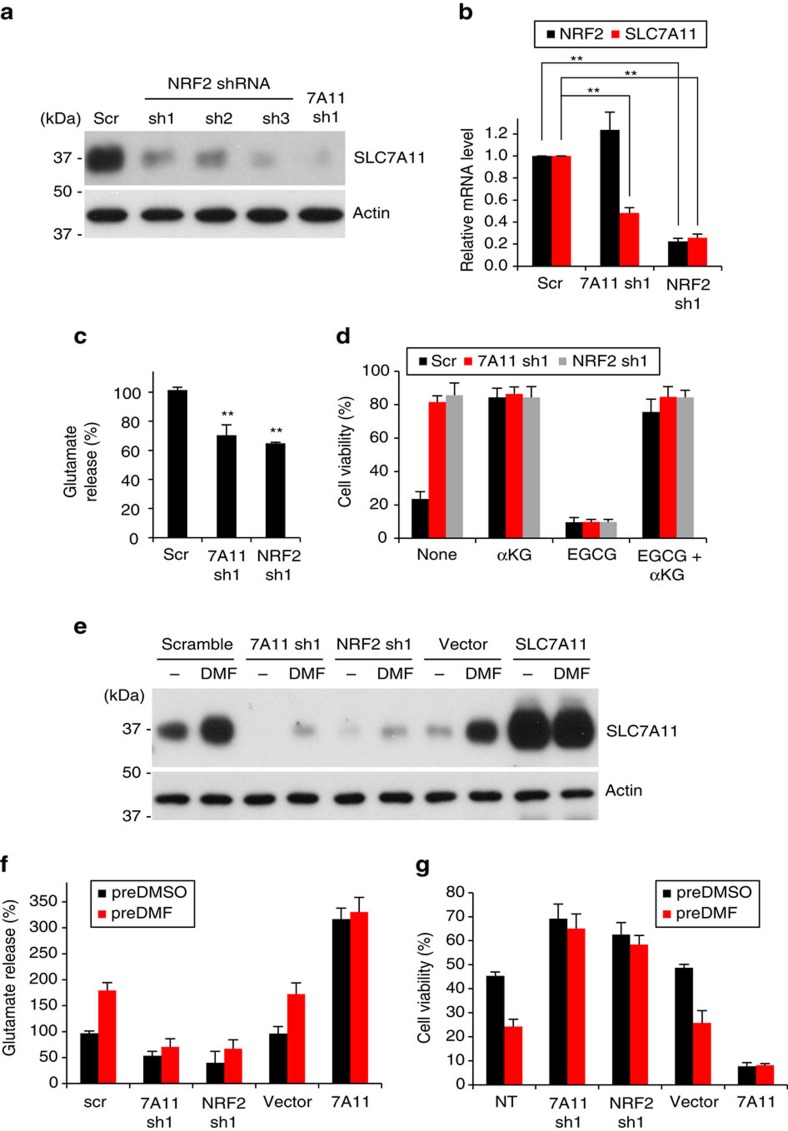
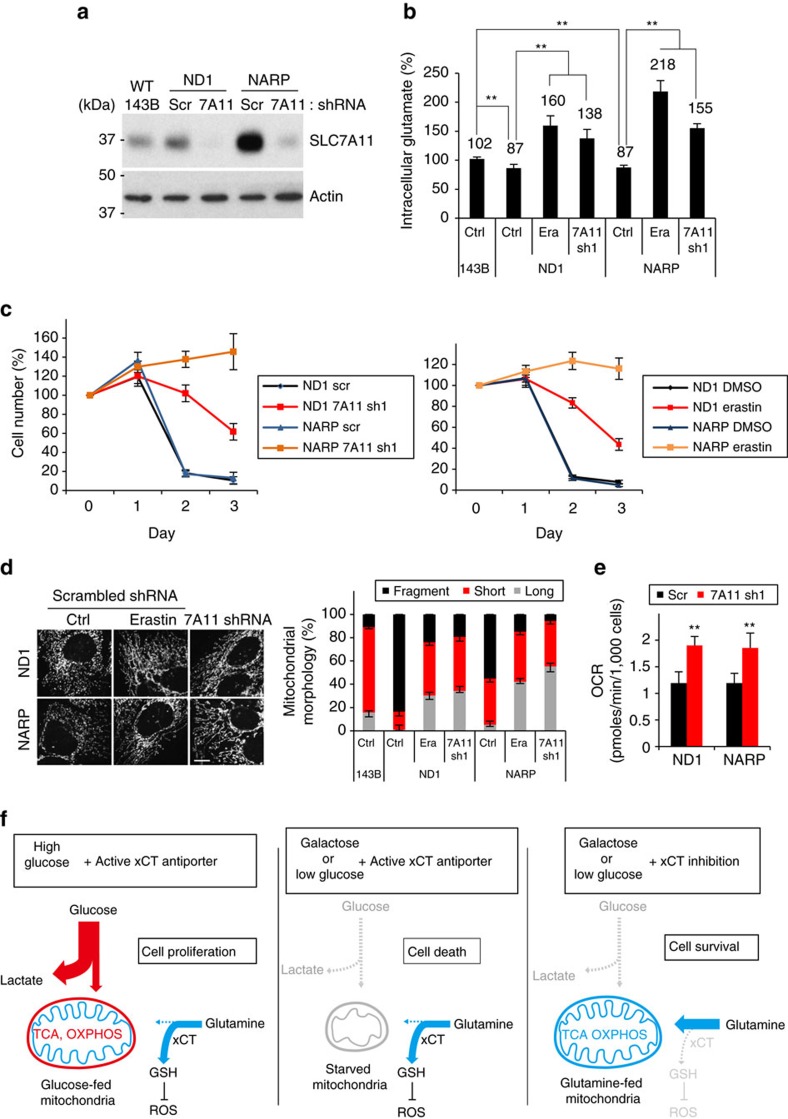
As noted by Warburg, many cancer cells depend on the consumption of glucose. We performed a genetic screen to identify factors responsible for glucose addiction and recovered the two subunits of the xCT antiporter (system xc-), which plays an antioxidant role by exporting glutamate for cystine. Disruption of the xCT antiporter greatly improves cell viability after glucose withdrawal, because conservation of glutamate enables cells to maintain mitochondrial respiration. In some breast cancer cells, xCT antiporter expression is upregulated through the antioxidant transcription factor Nrf2 and contributes to their requirement for glucose as a carbon source. In cells carrying patient-derived mitochondrial DNA mutations, the xCT antiporter is upregulated and its inhibition improves mitochondrial function and cell viability. Therefore, although upregulation of the xCT antiporter promotes antioxidant defence, it antagonizes glutamine metabolism and restricts nutrient flexibility. In cells with mitochondrial dysfunction, the potential utility of xCT antiporter inhibition should be further tested.


Conflict of interest statement

The authors declare no competing financial interests.

Figures

Figure 1
Figure 1. Identification of SLC3A2 or SLC7A11 as factors limiting cell viability under glucose-deficient conditions.
(a) Depiction of gene-trap insertions found in the SLC3A2 and SLC7A11 genes, in Hap1 cells surviving glucose depletion. Black rectangles represent exons, and blue marks represent insertion events. The number of gene-trap insertions from the unselected and selected populations was analysed by the one-sided Fisher exact test to calculate P values. (b) Western blot analysis of SLC3A2 and SLC7A11 levels in WT Hap1 (WT), AC6 (SLC7A11 gene-trap clone) and AC24 (SLC3A2 gene-trap clone) cells. (c) Quantification of glutamate release into the medium. Values were normalized to WT. Data represent the means±s.d. (n=3); **P<0.01; unpaired Student's t-test. (d,e) Representative images (d) and quantification (e) of cell viability at 24 h after glucose withdrawal, with vehicle (DMSO) or 500 μM sulfasalazine (SASP). Scale bar, 200 μm. Data represent the means±s.d. (n=3).
Figure 2
Figure 2. System xc negatively impacts Hap1 and HeLa cell viability after glucose withdrawal.
(a) Western blot analysis of SLC7A11 protein levels in SLC7A11 knockdown Hap1 and SLC7A11-overexpressing HeLa cells. (b) Quantification of glutamate release into the medium. Data represent the means±s.d. (n=4); **P<0.01; unpaired Student's t-test; scr, scrambled shRNA. (c,d) Cell viability at 24 h after glucose withdrawal. SLC7A11 knockdown Hap1 cells (c) and SLC7A11-overexpressing HeLa cells (d) were cultured in glucose-deficient medium with vehicle (DMSO), 500 μM SASP or 4 mM dm-αKG for 24 h. Data represent the means±s.d. (n=3); vector: empty vector.
Figure 3
Figure 3. The pro-survival effects of SLC7A11 depletion require glutamine metabolism.
(a,b) Quantification of intracellular glutamate in SLC7A11 knockdown Hap1 cells (a) and SLC7A11-overexpressing HeLa cells (b) before and 1 h after glucose removal. Data represent the means±s.d. (n=3); **P<0.01; unpaired Student's t-test. (c) Enzymes and inhibitors involved in glutamine/glutamate metabolism. (d,e) Hap1 cell viability at 24 h after glucose withdrawal. The following drugs were added as indicated: 0.5 mM AOA, 50 μM EGCG, 10 μM BPTES or 4 mM dm-αKG. Data represent the means±s.d. (n=3). (f) Oxygen consumption under glucose-deplete conditions. Cells were incubated for 3 h in glucose-deficient medium (1 mM glutamine) and OCR was measured. Data represent the means±s.d. (n=4); *P<0.05. **P<0.01; unpaired Student's t-test. (g) Isotope labelling patterns of the TCA intermediates. Cells were incubated for 8 h in glucose-free media containing U-13C5-glutamine before extracting metabolites. Data represent the means±s.d. (n=3).
Figure 4
Figure 4. Depletion of SLC7A11 promotes survival of breast cancer cells after glucose depletion.
(a) SLC7A11 protein levels in SLC7A11-knockdown Hs578T and SLC7A11-overexpressing SK-BR-3 cells. (b,c) Metabolic status under glucose-replete conditions. The OCR (b) and OCR/ECAR ratio (c) were measured in the presence of 10 mM glucose+2 mM glutamine. Data represent the means±s.d. (n=3). (d,e) Cell viability 24 h after glucose withdrawal. SLC7A11 knockdown Hs578T (d) and SLC7A11-overexpressing SK-BR-3 cells (e) were cultured in glucose-deficient medium for 24 h. The following drugs were added as indicated: 500 μM SASP, 0.5 mM AOA, 50 μM EGCG, 10 μM BPTES or 4 mM dm-αKG. Data represent the means±s.d. (n=3).
Figure 5
Figure 5. Nrf2 regulates SLC7A11 expression and survival of breast cancer cells upon glucose withdrawal.
(a) Western blot of SLC7A11 protein levels in Nrf2 and SLC7A11 knockdown Hs578T cells. (b) Real-time RT-PCR analysis of Nrf2 and SLC7A11 mRNA levels in Nrf2 and SLC7A11 knockdown MDA-MB-231 cells. Measurements were normalized to 18 s rRNA levels. Data represent the means±s.d. (n=3); **P<0.01, unpaired Student's t-test. (c,d) Analysis of Nrf2 and SLC7A11 knockdown Hs578T cells. (c) Glutamate release into the medium. Data represent the means±s.d. (n=3); **P<0.01; unpaired Student's t-test. (d) Cell viability 24 h after glucose withdrawal. EGCG (50 μM) and dm-αKG (4 mM) were added as indicated. Data represent the means±s.d. (n=4). (eg) MDA-MB-231 cells were treated with vehicle (DMSO) or 15 μM DMF for 24 h in glucose-replete medium. Additional manipulations included knockdown of SLC7A11 or Nrf2, and overexpression of SLC7A11. (e) Western blot of SLC7A11 levels upon treatment with DMF. (f) Glutamate release into media. After DMF-pretreatment, cells were incubated in fresh glucose-deficient medium without DMF, and glutamate released into the medium was measured at 2 h. Data represent the means±s.d. (n=4). (g) Cell viability 24 h after glucose depletion. After DMF-pretreatment, cells were incubated in fresh glucose-deficient medium without DMF for additional 24 h before measurement of cell viability. Data represent the means±s.d. (n=4); NT, no treatment.
Figure 6
Figure 6. Inhibition system xc enhances viability and mitochondrial function of cybrid cells harbouring mtDNA mutations.
(a) Western blot of SLC7A11 levels in 143B and isogenic mtDNA-mutant ND1 and NARP cells. (be) Analysis of SLC7A11 knockdown or erastin (Era)-treated (5 μM) ND1 and NARP cells cultured in the presence of 10 mM galactose and 2 mM glutamine. (b) Quantification of intracellular glutamate at 24 h after galactose culture. Data represent the means±s.d. (n=4); ** P<0.01; unpaired Student's t-test. (c) Cell viability in galactose medium for 3 days. Data represent the means±s.d. (n=4). (d) Representative images and quantification of mitochondrial morphology at 24 h after galactose culture. Data represent the means±s.d. (n=3). Scale bar, 10 μm. (e) Oxygen consumption was determined at 24 h after galactose culture. Data represent the means±s.d. (n=5); **P<0.01; unpaired Student's t-test. (f) Model for the dual effects of the xCT antiporter. The xCT antiporter diverts glutamine metabolism from the TCA cycle into GSH synthesis, which is important for antioxidant function. Under certain cellular conditions, excessive diversion of glutamine from the TCA cycle is detrimental (middle panel) and therefore inhibition of the antiporter improves survival (right panel).

Similar articles

Cited by

References

    1. Levine A. J. & Puzio-Kuter A. M. The control of the metabolic switch in cancers by oncogenes and tumor suppressor genes. Science 330, 1340–1344 (2010). - PubMed
    1. Vander Heiden M. G., Cantley L. C. & Thompson C. B. Understanding the Warburg effect: the metabolic requirements of cell proliferation. Science 324, 1029–1033 (2009). - PMC - PubMed
    1. DeBerardinis R. J. & Chandel N. S. Fundamentals of cancer metabolism. Sci. Adv. 2, e1600200 (2016). - PMC - PubMed
    1. DeBerardinis R. J., Lum J. J., Hatzivassiliou G. & Thompson C. B. The biology of cancer: metabolic reprogramming fuels cell growth and proliferation. Cell Metab. 7, 11–20 (2008). - PubMed
    1. Wise D. R. & Thompson C. B. Glutamine addiction: a new therapeutic target in cancer. Trends Biochem. Sci. 35, 427–433 (2010). - PMC - PubMed

Publication types

MeSH terms