

Fluoxetine attenuates the impairment of spatial learning ability and prevents neuron loss in middle-aged APPswe/PSEN1dE9 double transgenic Alzheimer's disease mice
- PMID: 28430602
- PMCID: PMC5438600
- DOI: 10.18632/oncotarget.15398
Fluoxetine attenuates the impairment of spatial learning ability and prevents neuron loss in middle-aged APPswe/PSEN1dE9 double transgenic Alzheimer's disease mice
Abstract
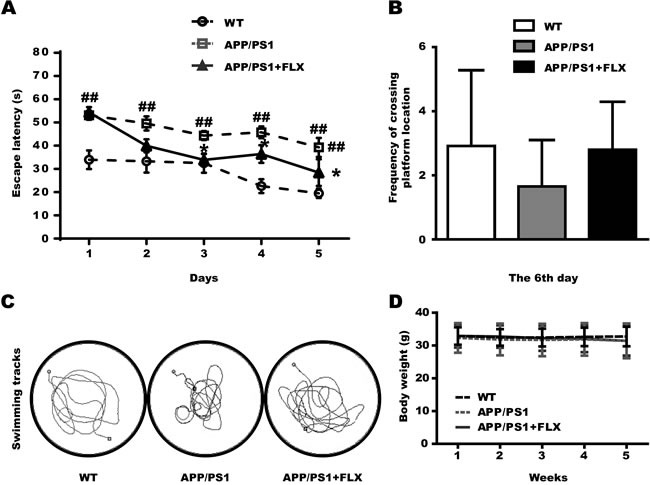
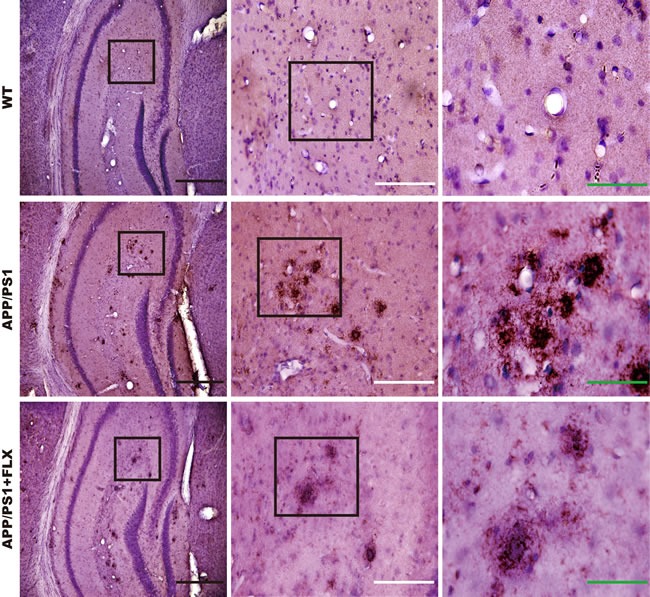
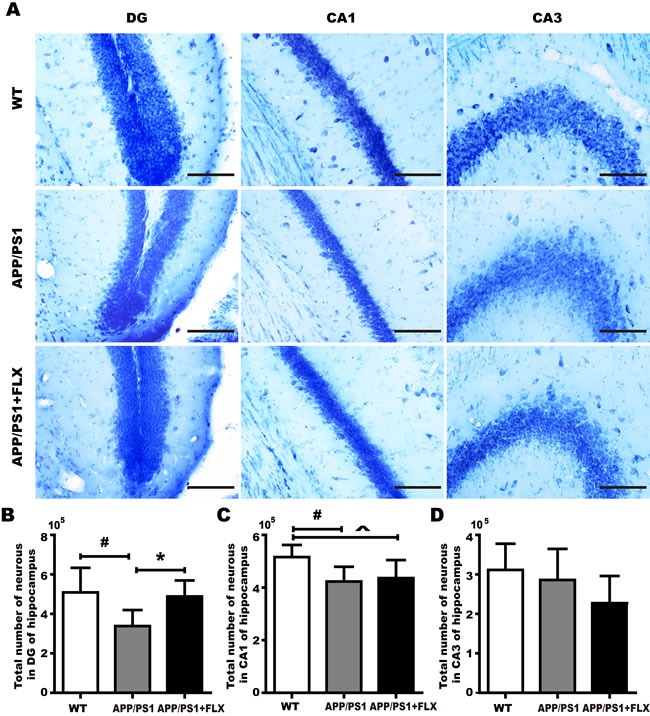
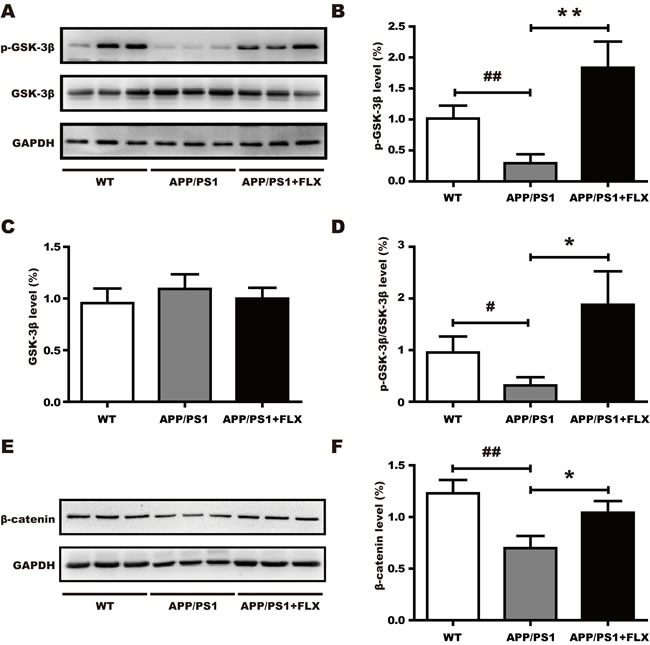
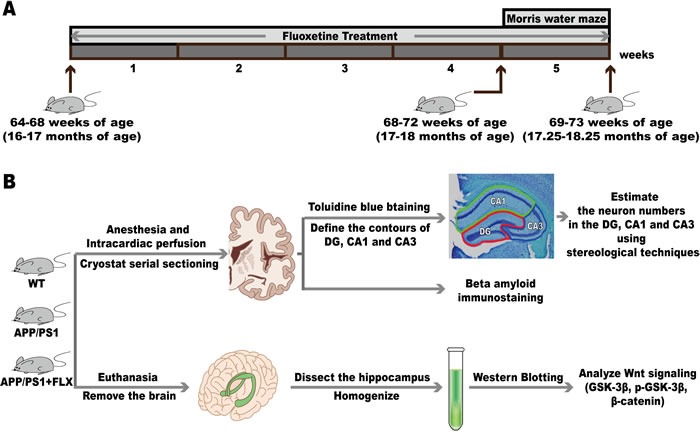
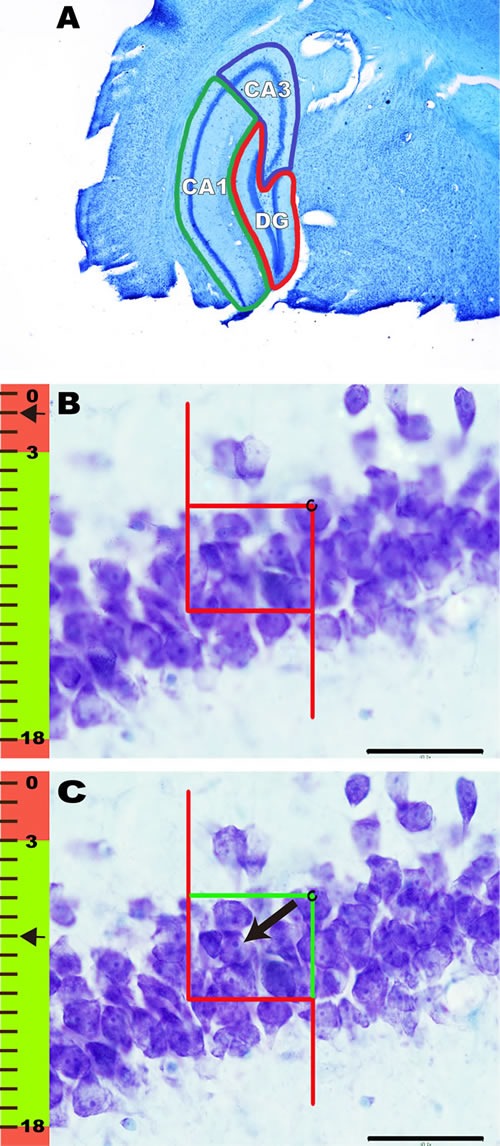
Selective serotonin reuptake inhibitors (SSRIs) have been reported to increase cognitive performance in some clinical studies of Alzheimer's disease (AD). However, there is a lack of evidence supporting the efficacy of SSRIs as cognition enhancers in AD, and the role of SSRIs as a treatment for AD remains largely unclear. Here, we characterized the impact of fluoxetine (FLX), a well-known SSRI, on neurons in the dentate gyrus (DG) and in CA1 and CA3 of the hippocampus of middle-aged (16 to 17 months old) APPswe/PSEN1dE9 (APP/PS1) transgenic AD model mice. We found that intraperitoneal (i.p.) injection of FLX (10 mg/kg/day) for 5 weeks effectively alleviated the impairment of spatial learning ability in middle-aged APP/PS1 mice as evaluated using the Morris water maze. More importantly, the number of neurons in the hippocampal DG was significantly increased by FLX. Additionally, FLX reduced the deposition of beta amyloid, inhibited GSK-3β activity and increased the level of β-catenin in middle-aged APP/PS1 mice. Collectively, the results of this study indicate that FLX delayed the progression of neuronal loss in the hippocampal DG in middle-aged AD mice, and this effect may underlie the FLX-induced improvement in learning ability. FLX may therefore serve as a promising therapeutic drug for AD.
Keywords: APP/PS1 mice; Alzheimer’s disease; Gerotarget; cognition; fluoxetine; neuron.
Conflict of interest statement
The authors confirm that this report has no biomedical financial interests or potential conflicts of interest.
Figures
Similar articles
-
Fluoxetine Protects against Dendritic Spine Loss in Middle-aged APPswe/PSEN1dE9 Double Transgenic Alzheimer's Disease Mice.Curr Alzheimer Res. 2020;17(1):93-103. doi: 10.2174/1567205017666200213095419. Curr Alzheimer Res. 2020. PMID: 32053075
-
Fluoxetine delays the cognitive function decline and synaptic changes in a transgenic mouse model of early Alzheimer's disease.J Comp Neurol. 2019 Jun 1;527(8):1378-1387. doi: 10.1002/cne.24616. Epub 2019 Jan 25. J Comp Neurol. 2019. PMID: 30592045
-
Neuron and neuroblast numbers and cytogenesis in the dentate gyrus of aged APPswe/PS1dE9 transgenic mice: Effect of long-term treatment with paroxetine.Neurobiol Dis. 2017 Aug;104:50-60. doi: 10.1016/j.nbd.2017.04.021. Epub 2017 Apr 28. Neurobiol Dis. 2017. PMID: 28461249
-
Depression in Alzheimer's Disease: An Alternative Role for Selective Serotonin Reuptake Inhibitors?J Alzheimers Dis. 2019;69(3):651-661. doi: 10.3233/JAD-180780. J Alzheimers Dis. 2019. PMID: 31104017 Review.
-
Effect and Potential Mechanism of Immunotherapy on Cognitive Deficits in Animal Models of Alzheimer's Disease: A Systematic Review and Meta-Analysis.Am J Geriatr Psychiatry. 2024 May;32(5):555-583. doi: 10.1016/j.jagp.2023.11.011. Epub 2023 Dec 7. Am J Geriatr Psychiatry. 2024. PMID: 38158285
Cited by
-
The multifaceted effects of fluoxetine treatment on cognitive functions.Front Pharmacol. 2024 Jul 16;15:1412420. doi: 10.3389/fphar.2024.1412420. eCollection 2024. Front Pharmacol. 2024. PMID: 39081952 Free PMC article. Review.
-
Neuroinflammation and amyloid-beta 40 are associated with reduced serotonin transporter (SERT) activity in a transgenic model of familial Alzheimer's disease.Alzheimers Res Ther. 2019 May 1;11(1):38. doi: 10.1186/s13195-019-0491-2. Alzheimers Res Ther. 2019. PMID: 31043179 Free PMC article.
-
Supplementary Pharmacotherapy for the Behavioral Abnormalities Caused by Stressors in Humans, Focused on Post-Traumatic Stress Disorder (PTSD).J Clin Med. 2023 Feb 20;12(4):1680. doi: 10.3390/jcm12041680. J Clin Med. 2023. PMID: 36836215 Free PMC article.
-
The Protective Effect of Vanadium on Cognitive Impairment and the Neuropathology of Alzheimer's Disease in APPSwe/PS1dE9 Mice.Front Mol Neurosci. 2020 Mar 10;13:21. doi: 10.3389/fnmol.2020.00021. eCollection 2020. Front Mol Neurosci. 2020. PMID: 32210760 Free PMC article.
-
β-Amyrin Ameliorates Alzheimer's Disease-Like Aberrant Synaptic Plasticity in the Mouse Hippocampus.Biomol Ther (Seoul). 2020 Jan 1;28(1):74-82. doi: 10.4062/biomolther.2019.024. Biomol Ther (Seoul). 2020. PMID: 31357749 Free PMC article.
References
-
- Simic G, Kostovic I, Winblad B, Bogdanovic N. Volume and number of neurons of the human hippocampal formation in normal aging and Alzheimer’s disease. J Comp Neurol. 1997;379:482–494. - PubMed
-
- Bloom GS. Amyloid-beta and tau: the trigger and bullet in Alzheimer disease pathogenesis. JAMA Neurol. 2014;71:505–508. - PubMed
-
- Susanto TA, Pua EP, Zhou J, Alzheimer’s Disease Neuroimaging Initiative Cognition, brain atrophy, and cerebrospinal fluid biomarkers changes from preclinical to dementia stage of Alzheimer’s disease and the influence of apolipoprotein e. J Alzheimers Dis. 2015;45:253–268. - PubMed
-
- Wai MS, Liang Y, Shi C, Cho EY, Kung HF, Yew DT. Co-localization of hyperphosphorylated tau and caspases in the brainstem of Alzheimer’s disease patients. Biogerontology. 2009;10:457–469. - PubMed
-
- Gomez-Isla T, Hollister R, West H, Mui S, Growdon JH, Petersen RC, Parisi JE, Hyman BT. Neuronal loss correlates with but exceeds neurofibrillary tangles in Alzheimer’s disease. Ann Neurol. 1997;41:17–24. - PubMed
MeSH terms
Substances
LinkOut - more resources
Full Text Sources
Other Literature Sources
Medical
Miscellaneous
