. 2017 Apr 25;8(17):28769-28784.
doi: 10.18632/oncotarget.15673.

Unsuccessful mitosis in multicellular tumour spheroids

Affiliations

Unsuccessful mitosis in multicellular tumour spheroids

Annie Molla et al. Oncotarget. .

Abstract

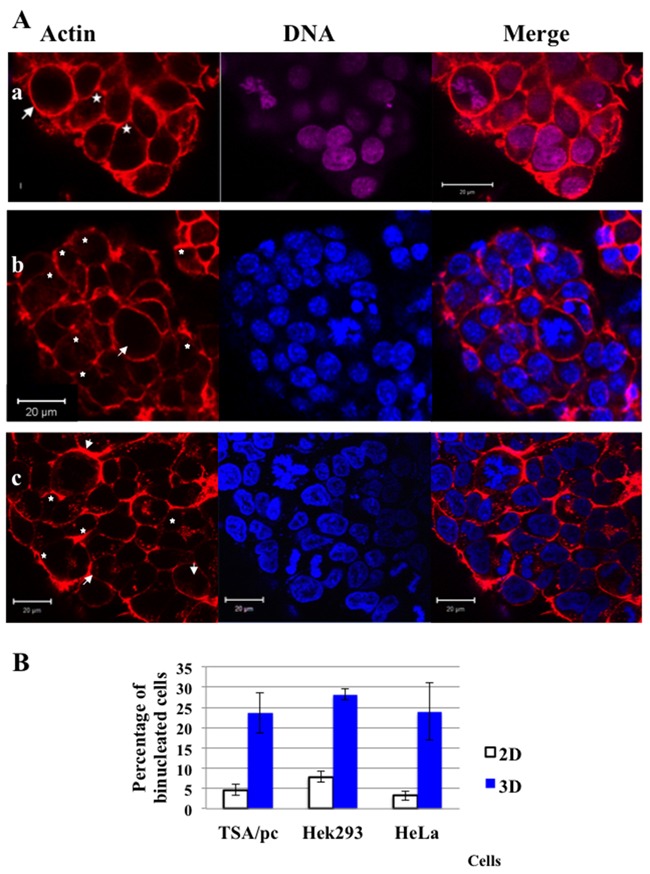
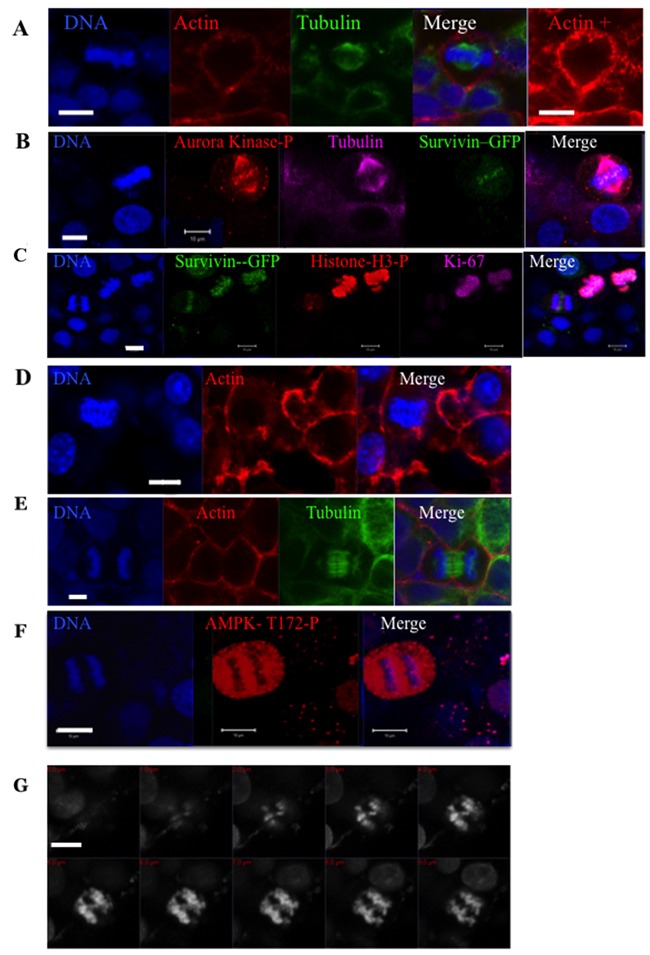
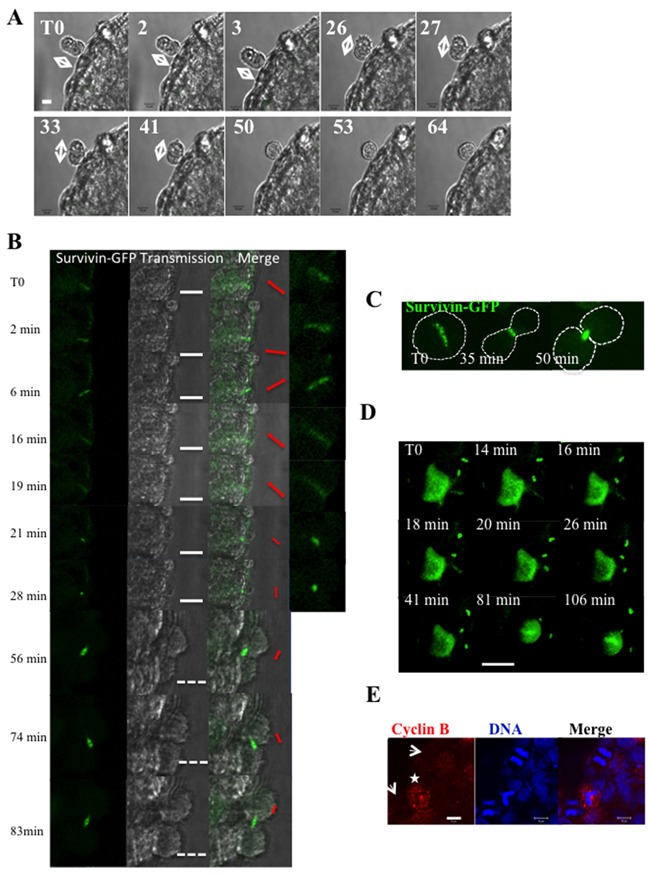
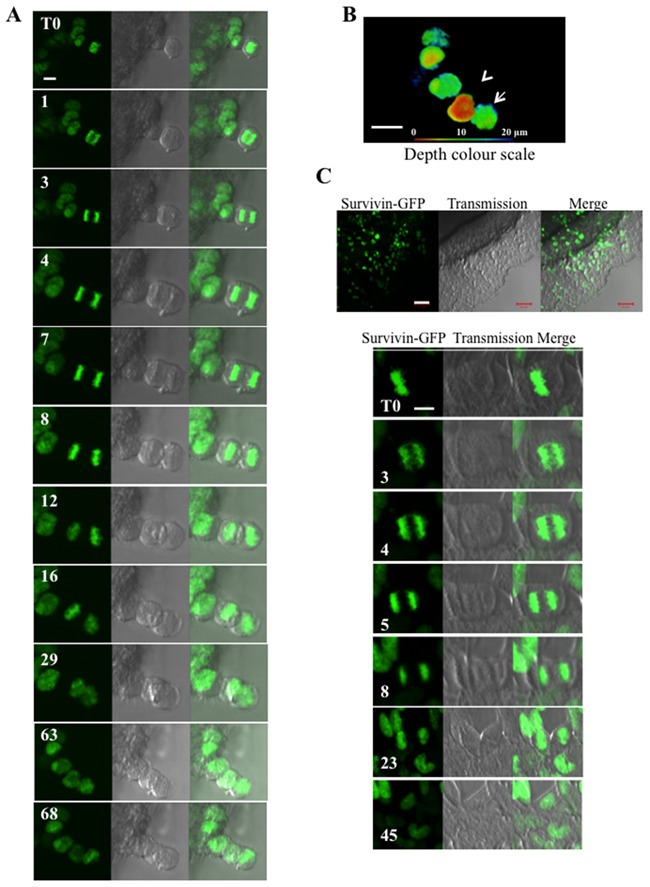
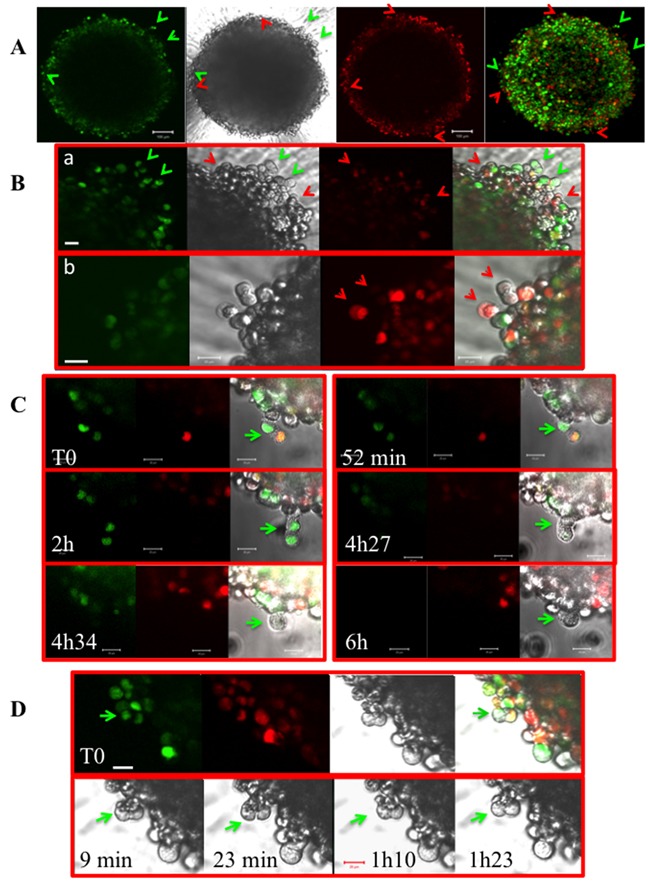
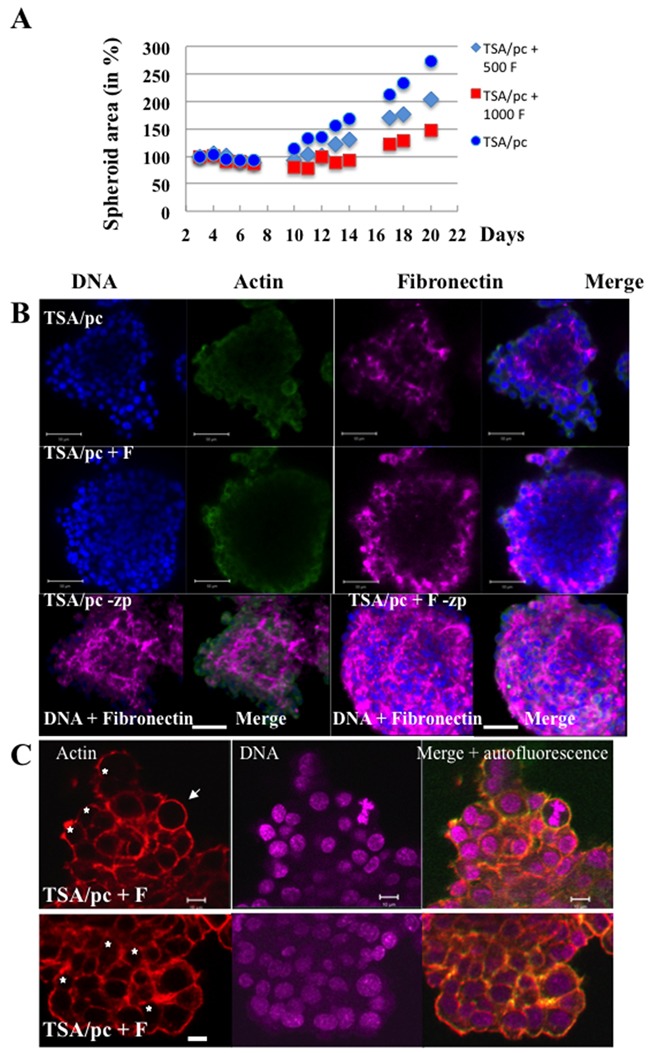
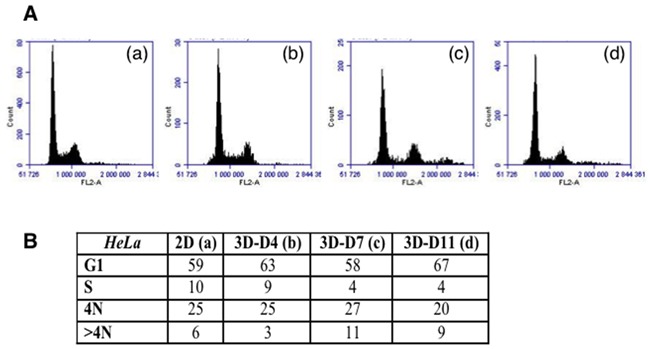
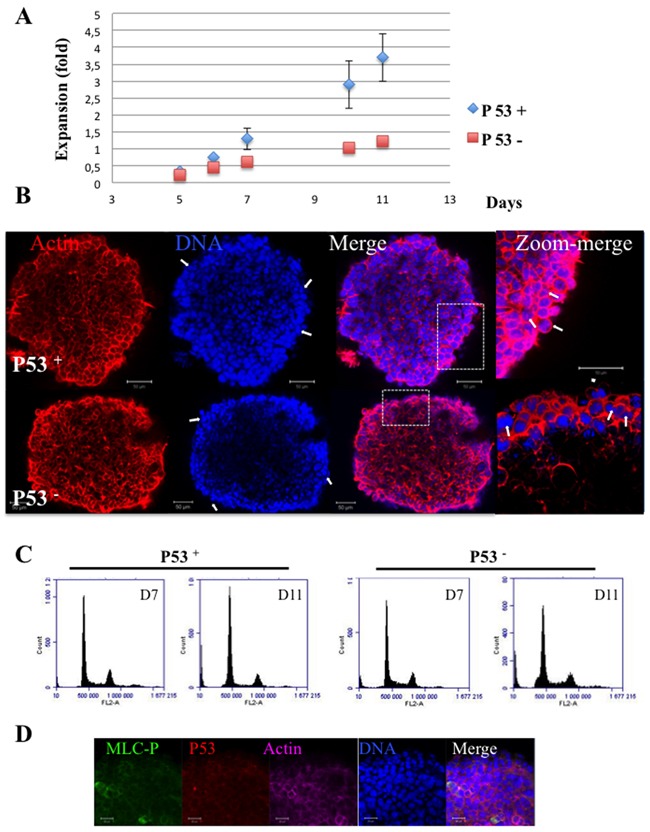
Multicellular spheroids are very attractive models in oncology because they mimic the 3D organization of the tumour cells with their microenvironment. We show here using 3 different cell types (mammary TSA/pc, embryonic kidney Hek293 and cervical cancer HeLa), that when the cells are growing as spheroids the frequency of binucleated cells is augmented as occurs in some human tumours.We therefore describe mitosis in multicellular spheroids by following mitotic markers and by time-lapse experiments. Chromosomes alignment appears to be correct on the metaphasic plate and the passenger complex is well localized on centromere. Moreover aurora kinases are fully active and histone H3 is phosphorylated on Ser 10. Consequently, the mitotic spindle checkpoint is satisfied and, anaphase proceeds as illustrated by the transfer of survivin on the spindle and by the segregation of the two lots of chromosomes. However, the segregation plane is not well defined and oscillations of the dividing cells are observed. Finally, cytokinesis fails and the absence of separation of the two daughter cells gives rise to binucleated cells.Division orientation is specified during interphase and persists throughout mitosis. Our data indicate that the cancer cells, in multicellular spheroids, lose their ability to regulate their orientation, a feature commonly encountered in tumours.Moreover, multicellular spheroid expansion is still sensitive to mitotic drugs as pactlitaxel and aurora kinase inhibitors. The spheroids thus represent a highly relevant model for studying drug efficiency in tumours.

Keywords: cytokinesis; mitosis; mitotic drug; spheroid; tetraploid cells.


Conflict of interest statement

CONFLICTS OF INTEREST

The authors declare no conflict of interest.

Figures

Figure 1
Figure 1. Cytokinesis failure and presence of binucleated cells in spheroids
(A) In (a) TSA/pc spheroids were grown for 7 days in U-low binding plates; In (b) TSA/pc spheroids prepared by the pending drop technic and recovered for staining on day 7. In (c) Hek293 spheroids were grown, for 7 days, in U-low binding plates. The outlines of cells are highlighted by labelling actin with rhodamin-phalloidin (a, b and c). DNA was labelled by either NucRed in (a) or hoechst 33342 in (b) and (c). Mitotic cells are indicated by an arrow and binucleated cells by stars. The bar represents 20 μm. (B) Estimation of the percentage of binucleated cells in three cell lines. 3 200 and 1 650 TSA/pc, 750 and 640 Hek293 and finally, 889 and 1 544 HeLa cells were scored on 2D-cultures and in D7-spheroids, respectively. Results obtained with 2D-cell cultures are represented by white histograms whereas 3D-spheroids data are in blue. The differences between 2D and 3D were found significant (p < 0.05 for Hek293 and < 0.005 for others as determined by student test).
Figure 2
Figure 2. Immunofluorescence experiments on whole HeLa spheroids
Cells in pro-metaphase are shown in (A-C) and labelled with anti-tubulin (A and B) and phalloidin in (A). In (B) survivin is detected by its GFP tag and the activities of aurora kinases A-B-C by a specific phospho-antibody (in magenta). In (C), several mitotic cells detected by survivin-GFP are labelled by [KI67] (in magenta) and Ser10-phospho-histone H3 (in red) antibodies. Early and late anaphases are imaged in (C and D) and (E-F) respectively. The localisation of actin (in red) and tubulin (in green) are shown in (D) or (E). Phospho-AMPK (T172) is detected in (F). In (G), a collection of images corresponding the z-imaging of the DNA of an anaphase is shown. In all panels, DNA is labelled by hoechst 3342 and the bar represents 10 μm.
Figure 3
Figure 3. Time-lapse experiments on whole HeLa spheroids
(A) An anaphase is detected by its peculiar shape at the border of a Hek293 spheroid and the spheroid was continuously imaged. Elapsed times in hours are indicated on the top left of images and the direction of the long axis is denoted by arrows. The bar represents 10 μm. (B) Cells stably expressed survivin-GFP. An area including a metaphase is continuously imaged. Elapsed times are indicated. For each time point, the fluorescent image and the brightfield are shown. A merge and a 2.25-zoom are added on the right; the direction of the fluorescent signal is indicated in red (metaphasic plate from T0 to 28 min and then midbody). The white bar represents 20 μm and the discontinuous one 40 μm. (C) Time-lapse of survivin-GFP in cells grown in 2D. The metaphasic cell enters in anaphase 35 min later and is in telophase at t= 50 min. Based on the fluorescent background a discontinuous line was drawn to figure out the shape of the cell. (D) Same experiment than in B. This larger field included one metaphasic cell and several telophases. The white bar represents 20 μm. Elapsed times are indicated on each photo, T0 been the starting point. (E) Detection of cyclin B on HeLa spheroids. Cyclin B appears in red and DNA detected by hoechst3342 in blue. The arrows point anaphases and a star indicates a metaphase. The bar represented 10 μm.
Figure 4
Figure 4. Time-lapse experiments on whole Hek293 spheroids
(A) Hek293 cells expressing histone H2A-GFP are continuously imaged. An early anaphase is selected at T0. The fluorescent signal of histone H2A-GFP, the brightfield and the merge are shown at representative times. (B) A z-stack imaging of the field shown in (A) was performed at T68. The maximum intensity projection of the whole fluorescent signal is represented with a depth colour code. Arrows indicates the two nuclei derived from the anaphase imaged in A (one brown, one green). (C) Same time-lapse as in A performed on whole spheroids kept for one day in Labteck wells. The border cells start to spread on the glass as seen in (a) and the metaphase cells escaping from the spheroid mass undergo normal in mitosis.
Figure 5
Figure 5. Experiments on Fucci-HeLa cells
(A) A Fucci-HeLa spheroid grown for 7 days is imaged directly in the well. Green cells expressing geminin-GFP are mostly in G2/M or in late S when red cells expressing cdt1-RFP are in G1 to S. Binucleated green and red cells are indicated by the corresponding coloured arrows. A brightfield and a merge (green and red) are shown. The bar corresponded to 100 μm. (B) Same as in A under higher magnitude. The bar corresponded to 20 μm. In (a), note the presence of green mitoses and red binucleated cells and in (b) of a mostly black mitosis and a binucleated cell. They are indicated by arrows. (C) Time-lapse on a Fucci-HeLa spheroid grown for 7 days. An anaphase is selected by its peculiar shape at the border of the spheroid and continuously imaged. Elapsed times are indicated. This anaphase looses it green colour at t= 4h27 and finally gives rise to a unique uncoloured cell (4h 34 and 6h). The bar corresponded to 20 μm. (D) Time-lapse on a NMuMG-Fucci spheroid grown for 7 days. An anaphase is selected by its peculiar shape at the border of the spheroid and continuously imaged for 1h20. A green arrow indicates its position. Elapsed times are indicated. The bar corresponded to 20 μm.
Figure 6
Figure 6. Bi-nucleated cells in mixed spheroids
(A) mixed spheroids were established with TSA/pc cells (1000) and 3T3-fibroblasts (500 F or 1000F). The expansion of the spheroids was followed over time. (B) immunofluorescences were realized on whole spheroids and fibronectin was detected (shown in magenta). DNA and actin fluorescent signals were imaged on spheroid optical sections as fibronectin was also detected (shown in magenta). A 3D projection of the whole fluorescence is shown and indicated as –zp. The bars represent 50 μm. (C) Binucleated cells are detected in mixed spheroids and indicated by stars. The white arrow highlights a metaphase. The bars represent 10 μm.
Figure 7
Figure 7. Cell cycle analysis on TSA/pc cells
(A) Histograms of the distribution of the cells grown as adherent cells (in a) or as spheroids (in b-d). The spheroids were recovered on day 4, 7 and 11. (B) Estimation of the percentage of cells in the different phases.
Figure 8
Figure 8. Hct116 (P53 + and P53-) Spheroids
(A) Spheroids were established and their growth was followed for 11 days. Expansion at Dx equals (area Dx – area D0/area D0). In 2D-cultures Hct116-P53-cells grew 20 % less rapidly than the P53+ cells (data not shown). (B) Actin and DNA are labelled by phalloidin and hoechst 33342 respectively; Some bi-nucleated cells on the surface are indicated by arrows. The provided zooms corresponded to the area indicated by rectangles. The bars represent 50 μm. (C) Cell cycle of Hct116-(P53+ and P53 -) cells grown as spheroids for 7 and 11 days. Percentages of polyploid cells of 6.8 ± 1.4 and 5.1 ± O.9 were found for Hct116-(P53+ and P53 -) cells respectively, in 2D cultures. (D) Immunofluorescence of TSA/pc spheroids: detection of MRLC-P (in green) and P53 (in red) in day 7 spheroids.

References

    1. Lovitt CJ, Shelper TB, Avery VM. Advanced cell culture techniques for cancer drug discovery. Biology (Basel) 2014;3:345–67. - PMC - PubMed
    1. Antoni D, Burckel H, Josset E, Noel G. Three-dimensional cell culture: a breakthrough in vivo. Int J Mol Sci. 2015;16:5517–27. - PMC - PubMed
    1. Hirata E, Girotti MR, Viros A, Hooper S, Spencer-Dene B, Matsuda M, Larkin J, Marais R, Sahai E. Intravital imaging reveals how BRAF inhibition generates drug-tolerant microenvironments with high integrin β1/FAK signaling. Cancer Cell. 2015;27:574–88. - PMC - PubMed
    1. Unger C, Kramer N, Walzl A, Scherzer M, Hengstschläger M, Dolznig H. Modeling human carcinomas: physiologically relevant 3D models to improve anti-cancer drug development. Adv Drug Deliv Rev. 2014. pp. 79–80. 50-67. - PubMed
    1. Yamada KM, Cukierman E. Modeling tissue morphogenesis and cancer in 3D. Cell. 2007;130:601–10. - PubMed