

Ultrasound Molecular Imaging of Inflammation in Mouse Abdominal Aorta
- PMID: 28430714
- PMCID: PMC5558868
- DOI: 10.1097/RLI.0000000000000373
Ultrasound Molecular Imaging of Inflammation in Mouse Abdominal Aorta
Abstract
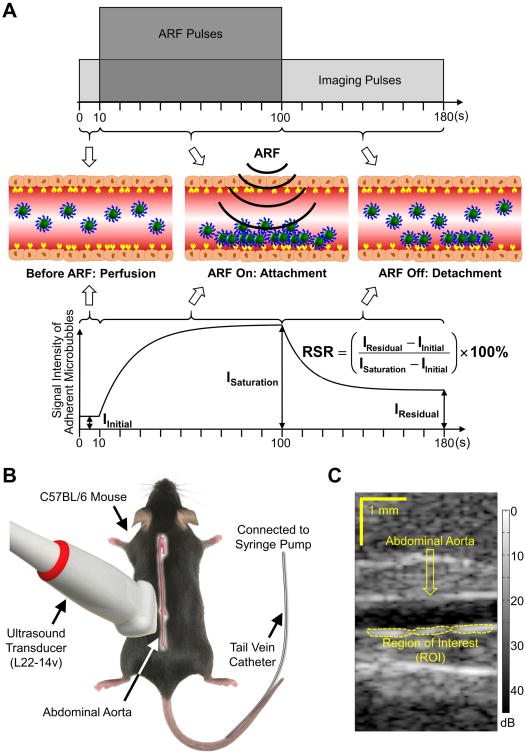
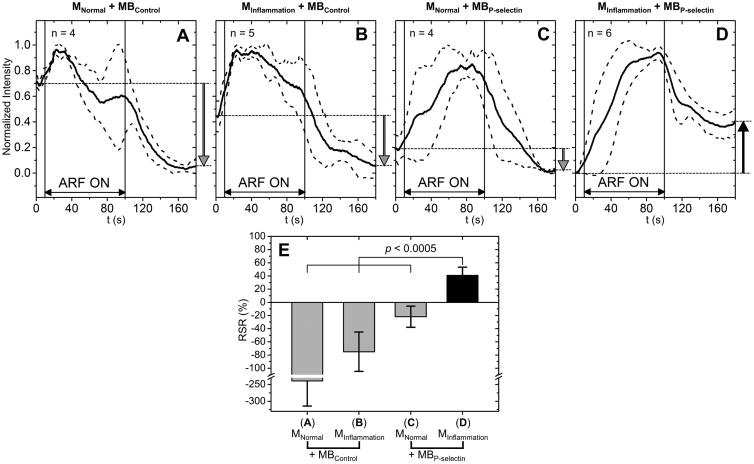
Objectives: The aim of this study was to demonstrate a new clinically translatable ultrasound molecular imaging approach, modulated acoustic radiation force-based imaging, which is capable of rapid and reliable detection of inflammation as validated in mouse abdominal aorta.
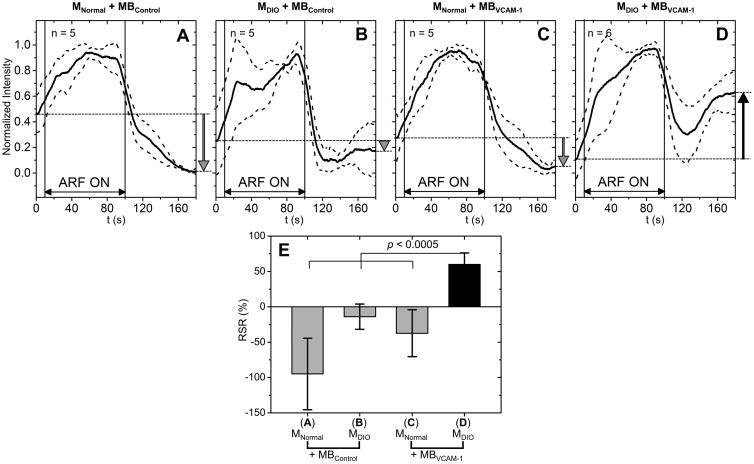
Materials and methods: Animal studies were approved by the Institutional Animal Care and Use Committee at the University of Virginia. C57BL/6 mice stimulated with tumor necrosis factor α, or fed with a high-fat diet, were used as inflammation (MInflammation) and diet-induced obesity (DIO) (MDIO) models, respectively. C57BL/6 mice, not exposed to tumor necrosis factor α or DIO, were used as controls (MNormal). P-selectin-targeted (MBP-selectin), vascular cell adhesion molecule (VCAM)-1-targeted (MBVCAM-1), and isotype control (MBControl) microbubbles were synthesized by conjugating anti-P-selectin, anti-VCAM-1, and isotype control antibodies to microbubbles, respectively. The abdominal aortas were imaged for 180 seconds during a constant infusion of microbubbles. A parameter, residual-to-saturation ratio (RSR), was used to assess P-selectin and VCAM-1. Statistical analysis was performed with the Student t test.
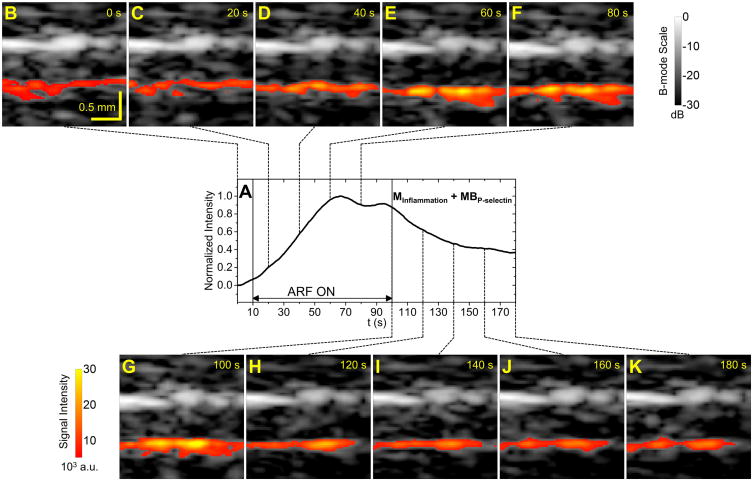
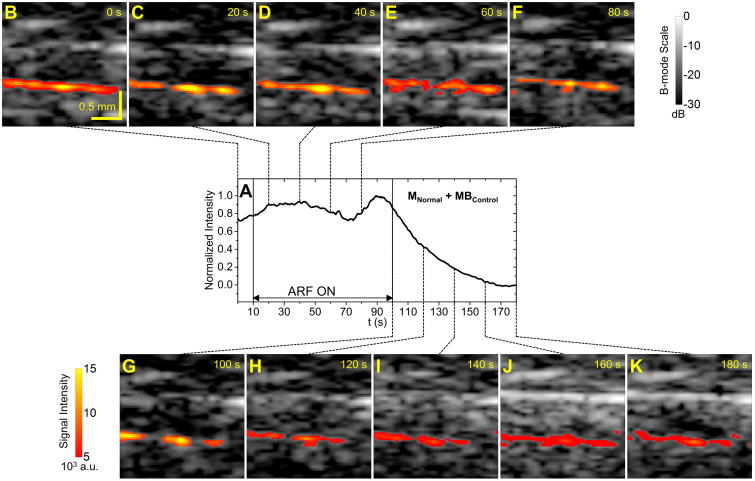
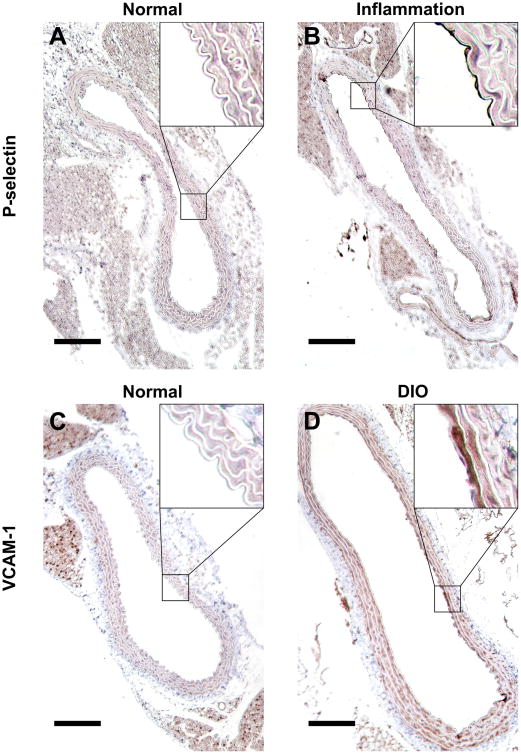
Results: For the inflammation model, RSR of the MInflammation + MBP-selectin group was significantly higher (40.9%, P < 0.0005) than other groups. For the DIO model, RSR of the MDIO + MBVCAM-1 group was significantly higher (60.0%, P < 0.0005) than other groups. Immunohistochemistry staining of the abdominal aorta confirmed the expression of P-selectin and VCAM-1.
Conclusions: A statistically significant assessment of P-selectin and VCAM-1 in mouse abdominal aorta was achieved. This technique yields progress toward rapid targeted molecular imaging in large blood vessels and thus has the potential for early diagnosis, treatment selection, and risk stratification of atherosclerosis.
Figures
Similar articles
-
Ultrasound Molecular Imaging of Atherosclerosis for Early Diagnosis and Therapeutic Evaluation through Leucocyte-like Multiple Targeted Microbubbles.Theranostics. 2018 Feb 14;8(7):1879-1891. doi: 10.7150/thno.22070. eCollection 2018. Theranostics. 2018. PMID: 29556362 Free PMC article.
-
Comparison of Magnetic Microbubbles and Dual-modified Microbubbles Targeted to P-selectin for Imaging of Acute Endothelial Inflammation in the Abdominal Aorta.Mol Imaging Biol. 2017 Apr;19(2):183-193. doi: 10.1007/s11307-016-0997-y. Mol Imaging Biol. 2017. PMID: 27672005
-
Ultrasound assessment of inflammation and renal tissue injury with microbubbles targeted to P-selectin.Circulation. 2001 Oct 23;104(17):2107-12. doi: 10.1161/hc4201.097061. Circulation. 2001. PMID: 11673354
-
Molecular imaging of disease with targeted contrast ultrasound imaging.Transl Res. 2012 Mar;159(3):140-8. doi: 10.1016/j.trsl.2011.12.001. Epub 2012 Jan 4. Transl Res. 2012. PMID: 22340763 Free PMC article. Review.
-
Molecular imaging with targeted contrast ultrasound.Curr Opin Biotechnol. 2007 Feb;18(1):11-6. doi: 10.1016/j.copbio.2007.01.004. Epub 2007 Jan 22. Curr Opin Biotechnol. 2007. PMID: 17241779 Review.
Cited by
-
Targeting P-Selectin Adhesion Molecule in Molecular Imaging: P-Selectin Expression as a Valuable Imaging Biomarker of Inflammation in Cardiovascular Disease.J Nucl Med. 2019 Dec;60(12):1691-1697. doi: 10.2967/jnumed.118.225169. Epub 2019 Oct 10. J Nucl Med. 2019. PMID: 31601694 Free PMC article. Review.
-
Characterization and Significance of Monocytes in Acute Stanford Type B Aortic Dissection.J Immunol Res. 2020 May 15;2020:9670360. doi: 10.1155/2020/9670360. eCollection 2020. J Immunol Res. 2020. PMID: 32509885 Free PMC article.
-
In Vivo Validation of Modulated Acoustic Radiation Force-Based Imaging in Murine Model of Abdominal Aortic Aneurysm Using VEGFR-2-Targeted Microbubbles.Invest Radiol. 2023 Dec 1;58(12):865-873. doi: 10.1097/RLI.0000000000001000. Epub 2023 Jul 12. Invest Radiol. 2023. PMID: 37433074 Free PMC article.
-
Current and Emerging Preclinical Approaches for Imaging-Based Characterization of Atherosclerosis.Mol Imaging Biol. 2018 Dec;20(6):869-887. doi: 10.1007/s11307-018-1264-1. Mol Imaging Biol. 2018. PMID: 30250990 Review.
-
Ultrasound Molecular Imaging of Atherosclerosis for Early Diagnosis and Therapeutic Evaluation through Leucocyte-like Multiple Targeted Microbubbles.Theranostics. 2018 Feb 14;8(7):1879-1891. doi: 10.7150/thno.22070. eCollection 2018. Theranostics. 2018. PMID: 29556362 Free PMC article.
References
-
- Mozaffarian D, Benjamin EJ, Go AS, et al. Heart disease and stroke statistics - 2015 update: a report from the American Heart Association. Circulation. 2015;131(4):e29–322. - PubMed
-
- Markus HS, Siegel JE, Topakian R, et al. The Asymptomatic Carotid Emboli Study: study design and baseline results. Int J Stroke. 2009;4(5):398–405. - PubMed
-
- Lovett JK, Gallagher PJ, Hands LJ, Walton J, Rothwell PM. Histological correlates of carotid plaque surface morphology on lumen contrast imaging. Circulation. 2004;110(15):2190–2197. - PubMed
-
- Miralles M, Merino J, Busto M, Perich X, Barranco C, Vidal-Barraquer F. Quantification and characterization of carotid calcium with multi-detector CT-angiography. Eur J Vasc Endovasc Surg. 2006;32(5):561–567. - PubMed
-
- Mathiesen EB, Bønaa KH, Joakimsen O. Echolucent plaques are associated with high risk of ischemic cerebrovascular events in carotid stenosis: the tromsø study. Circulation. 2001;103(17):2171–2175. - PubMed
MeSH terms
Grants and funding
LinkOut - more resources
Full Text Sources
Other Literature Sources
Miscellaneous
