

Experimental demonstration of a trophic cascade in the Galápagos rocky subtidal: Effects of consumer identity and behavior
- PMID: 28430794
- PMCID: PMC5400256
- DOI: 10.1371/journal.pone.0175705
Experimental demonstration of a trophic cascade in the Galápagos rocky subtidal: Effects of consumer identity and behavior
Abstract
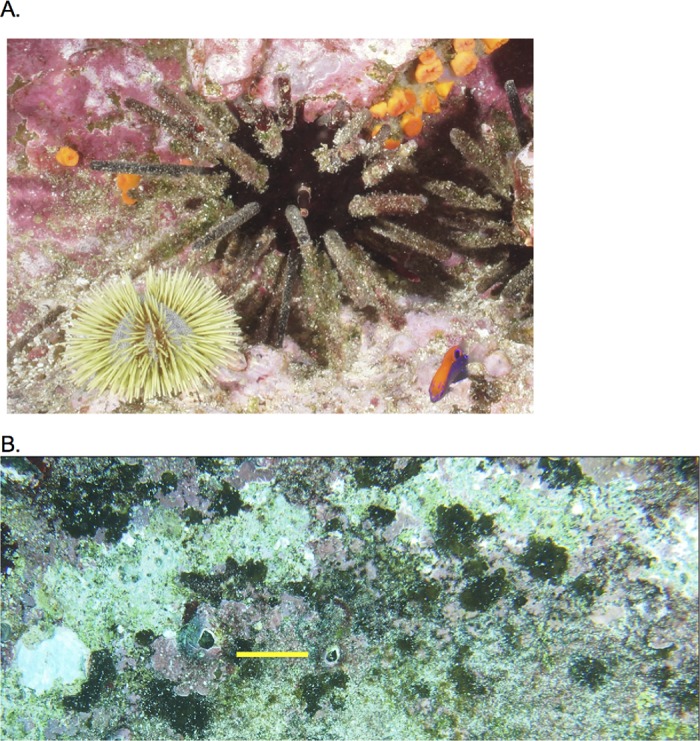
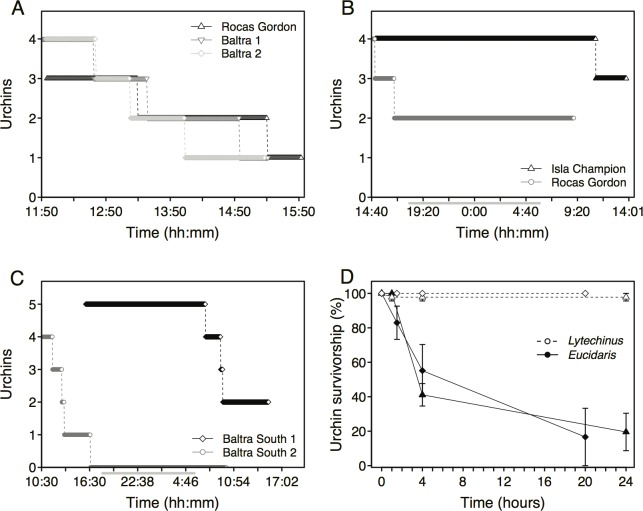
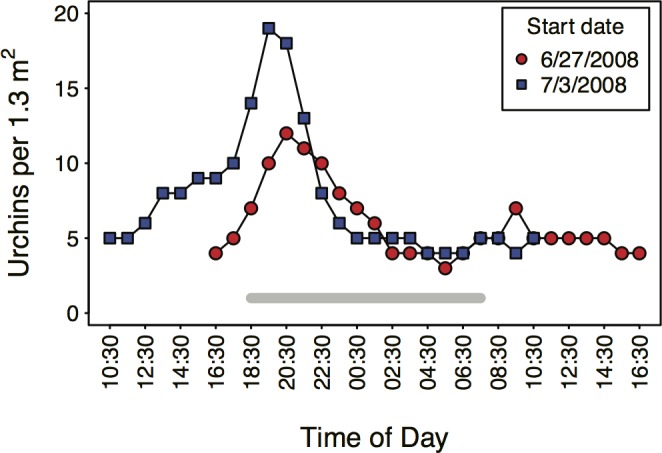
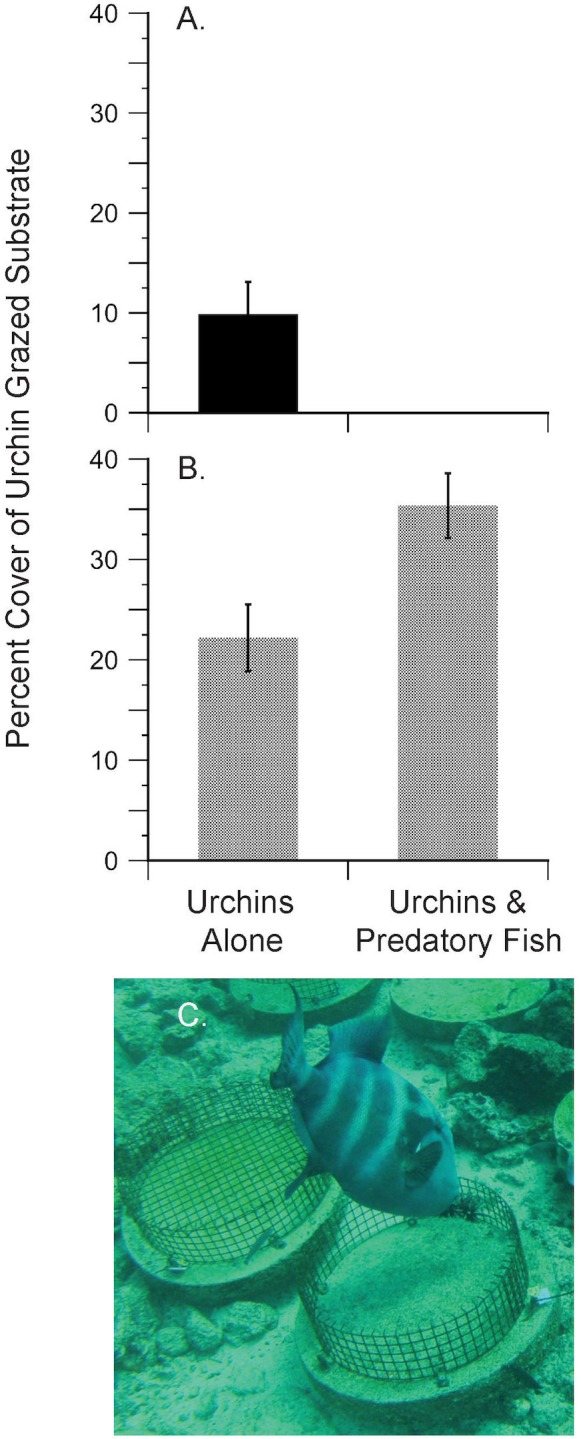
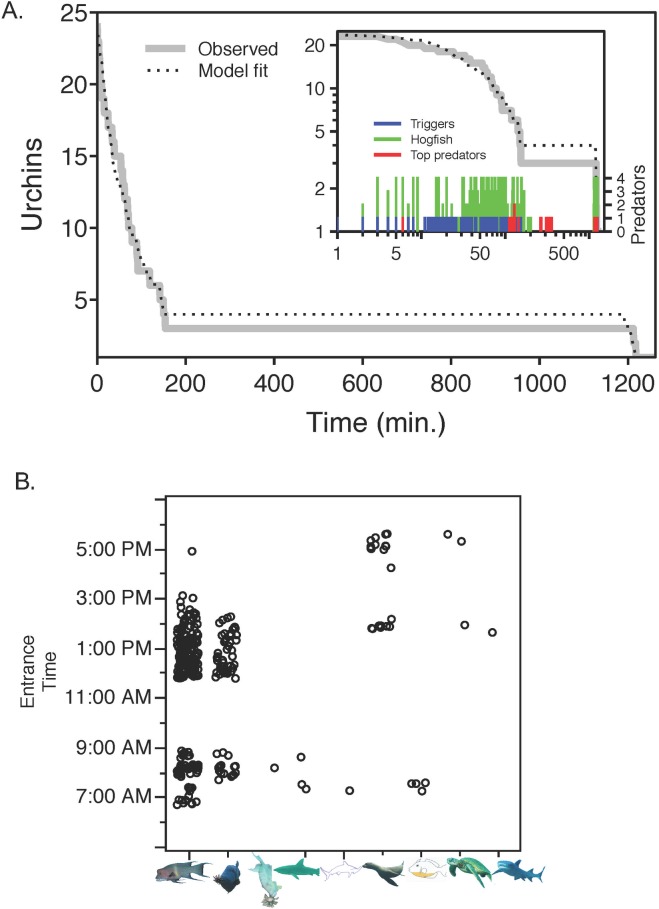
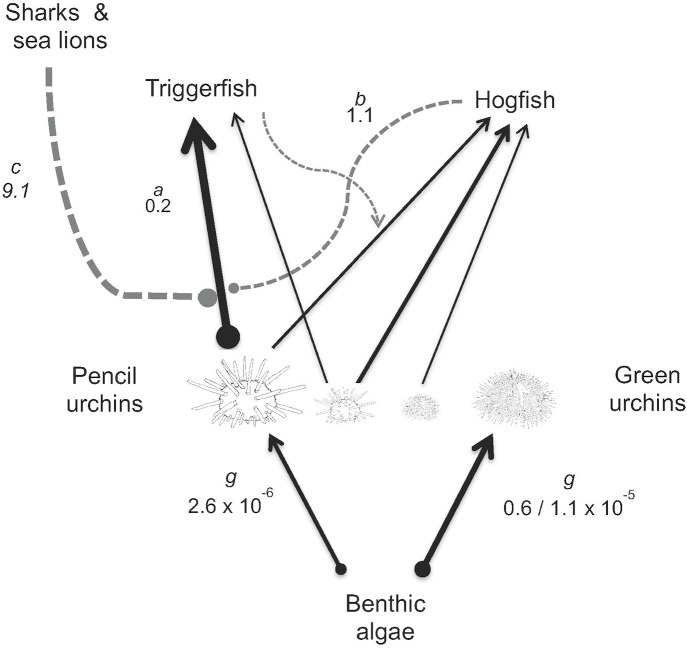
In diverse tropical webs, trophic cascades are presumed to be rare, as species interactions may dampen top-down control and reduce their prevalence. To test this hypothesis, we used an open experimental design in the Galápagos rocky subtidal that enabled a diverse guild of fish species, in the presence of each other and top predators (sea lions and sharks), to attack two species of sea urchins grazing on benthic algae. Time-lapse photography of experiments on natural and experimental substrates revealed strong species identity effects: only two predator species-blunthead triggerfish (Pseudobalistes naufragium) and finescale triggerfish (Balistes polylepis)-drove a diurnal trophic cascade extending to algae, and they preferred large pencil urchins (Eucidaris galapagensis) over green urchins (Lytechinus semituberculatus). Triggerfish predation effects were strong, causing a 24-fold reduction of pencil urchin densities during the initial 21 hours of a trophic cascade experiment. A trophic cascade was demonstrated for pencil urchins, but not for green urchins, by significantly higher percent cover of urchin-grazed algae in cages that excluded predatory fish than in predator access (fence) treatments. Pencil urchins were more abundant at night when triggerfish were absent, suggesting that this species persists by exploiting a nocturnal predation refuge. Time-series of pencil urchin survivorship further demonstrated per capita interference effects of hogfish and top predators. These interference effects respectively weakened and extended the trophic cascade to a fourth trophic level through behavioral modifications of the triggerfish-urchin interaction. We conclude that interference behaviors capable of modifying interaction strength warrant greater attention as mechanisms for altering top-down control, particularly in speciose food webs.
Conflict of interest statement
Figures
Similar articles
-
Predator diversity and density affect levels of predation upon strongly interactive species in temperate rocky reefs.Oecologia. 2007 Dec;154(3):513-20. doi: 10.1007/s00442-007-0845-5. Epub 2007 Sep 1. Oecologia. 2007. PMID: 17763873
-
Food webs and fishing affect parasitism of the sea urchin Eucidaris galapagensis in the Galápagos.Ecology. 2011 Dec;92(12):2276-84. doi: 10.1890/11-0559.1. Ecology. 2011. PMID: 22352167
-
Relationships among predatory fish, sea urchins and barrens in Mediterranean rocky reefs across a latitudinal gradient.Mar Environ Res. 2007 Mar;63(2):168-84. doi: 10.1016/j.marenvres.2006.08.002. Epub 2006 Aug 30. Mar Environ Res. 2007. PMID: 17034843
-
Geographic extent and variation of a coral reef trophic cascade.Ecology. 2016 Jul;97(7):1862-1872. doi: 10.1890/15-1492.1. Ecology. 2016. PMID: 27859162
-
Cascading top-down effects of changing oceanic predator abundances.J Anim Ecol. 2009 Jul;78(4):699-714. doi: 10.1111/j.1365-2656.2009.01531.x. Epub 2009 Mar 9. J Anim Ecol. 2009. PMID: 19298616 Review.
Cited by
-
Behavioral responses across a mosaic of ecosystem states restructure a sea otter-urchin trophic cascade.Proc Natl Acad Sci U S A. 2021 Mar 16;118(11):e2012493118. doi: 10.1073/pnas.2012493118. Epub 2021 Mar 8. Proc Natl Acad Sci U S A. 2021. PMID: 33836567 Free PMC article.
-
Effects of macroalgae loss in an Antarctic marine food web: applying extinction thresholds to food web studies.PeerJ. 2018 Sep 12;6:e5531. doi: 10.7717/peerj.5531. eCollection 2018. PeerJ. 2018. PMID: 30225167 Free PMC article.
-
Biogeographic and seasonal differences in consumer pressure underlie strong predation in the tropics.Proc Biol Sci. 2024 Jul;291(2026):20240868. doi: 10.1098/rspb.2024.0868. Epub 2024 Jul 3. Proc Biol Sci. 2024. PMID: 38955327 Free PMC article.
-
A skewed literature: Few studies evaluate the contribution of predation-risk effects to natural field patterns.Ecol Lett. 2022 Sep;25(9):2048-2061. doi: 10.1111/ele.14075. Epub 2022 Aug 4. Ecol Lett. 2022. PMID: 35925978 Free PMC article. Review.
References
-
- Witman JD, Sebens KP Regional variation in fish predation intensity: a historical perspective in the Gulf of Maine. 1992. Oecologia. 90: 305–315. doi: 10.1007/BF00317686 - DOI - PubMed
-
- Jackson JBC, Kirby MX, Berger WH, Bjorndal KA, Botsford LW et al. Historical overfishing and the recent collapse of coastal ecosystems. 2001. Science. 293: 629–637. doi: 10.1126/science.1059199 - DOI - PubMed
-
- Feretti FB, Worm BA, Britten GL, Heithaus MR, Lotze HK. Patterns and ecosystem consequences of shark declines in the ocean. 2010. Ecology Letters. 13: 1055–1071 doi: 10.1111/j.1461-0248.2010.01489.x - DOI - PubMed
-
- Peacor SD, Werner EE. Trait-mediated indirect interactions in a simple aquatic food web. 1997. Ecology 78: 1146–1156.
-
- Siddon CE, Witman JD. Behavioral indirect interactions: multiple predator effects and prey switching in the shallow rocky subtidal. 2004. Ecology 85: 2398–2945.
MeSH terms
LinkOut - more resources
Full Text Sources
Other Literature Sources
Miscellaneous
