

NaCl cotransporter abundance in urinary vesicles is increased by calcineurin inhibitors and predicts thiazide sensitivity
- PMID: 28430812
- PMCID: PMC5400280
- DOI: 10.1371/journal.pone.0176220
NaCl cotransporter abundance in urinary vesicles is increased by calcineurin inhibitors and predicts thiazide sensitivity
Abstract
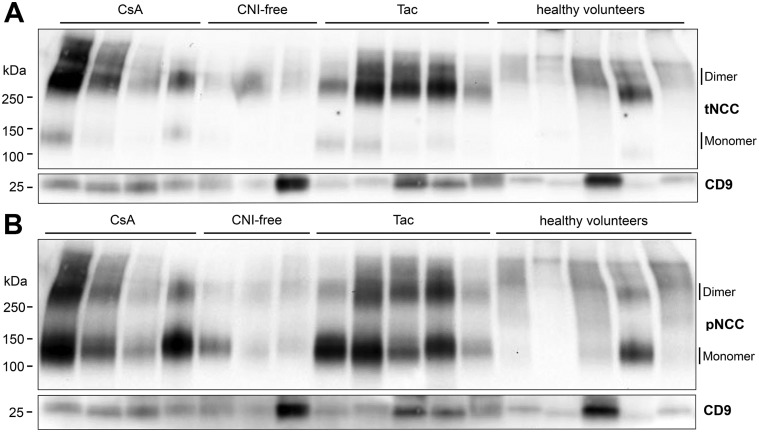
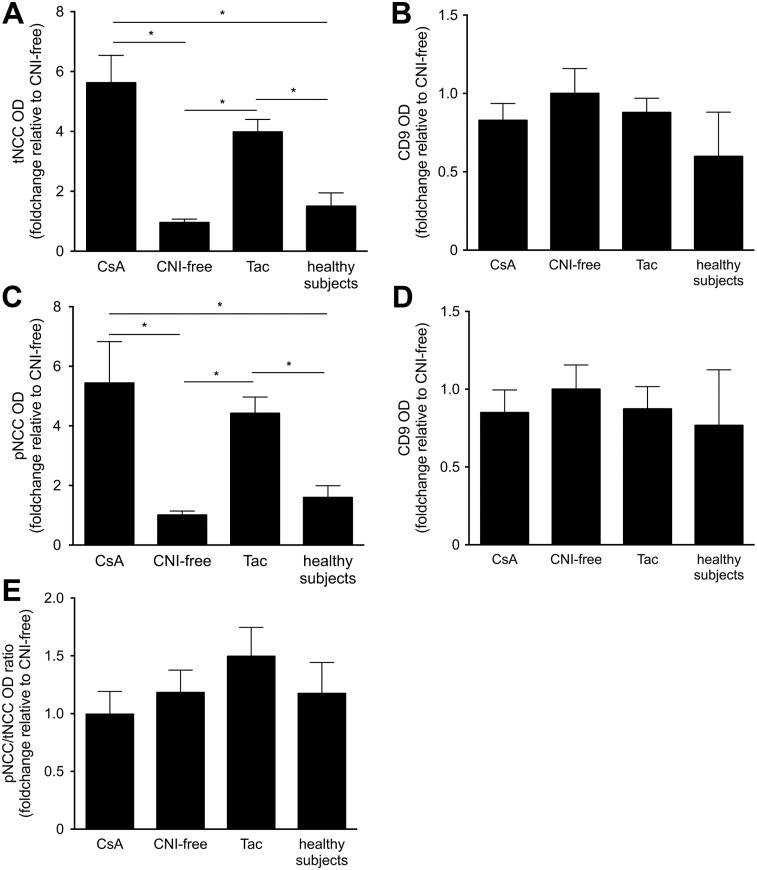
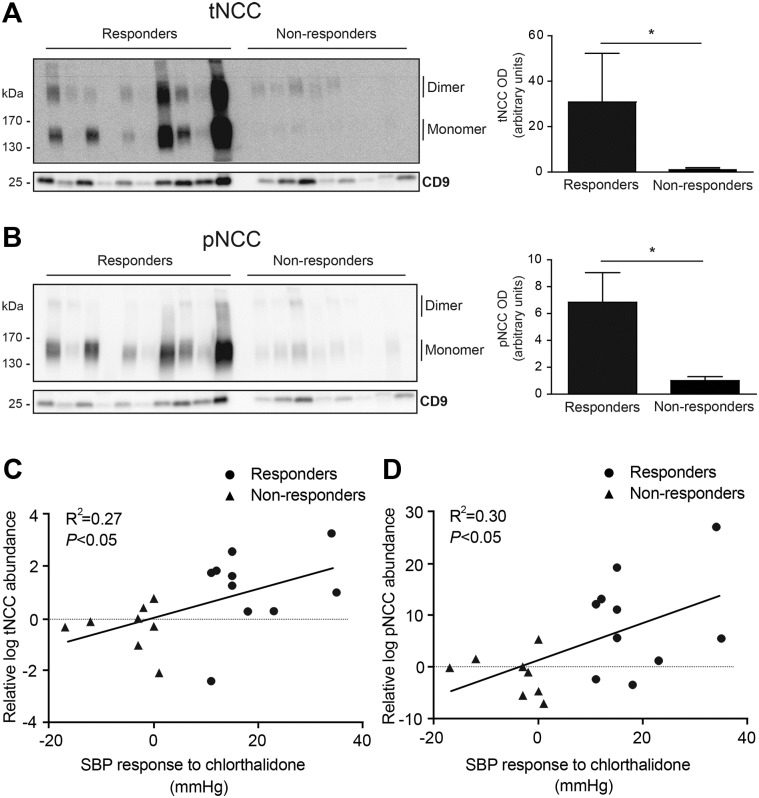
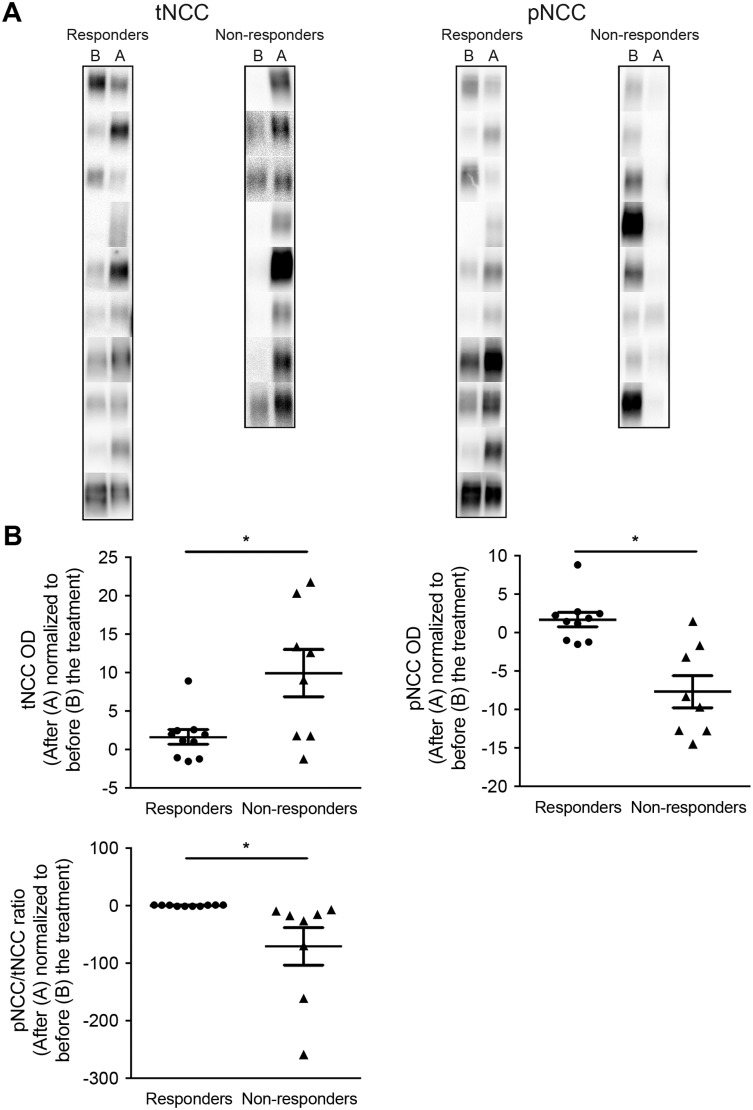
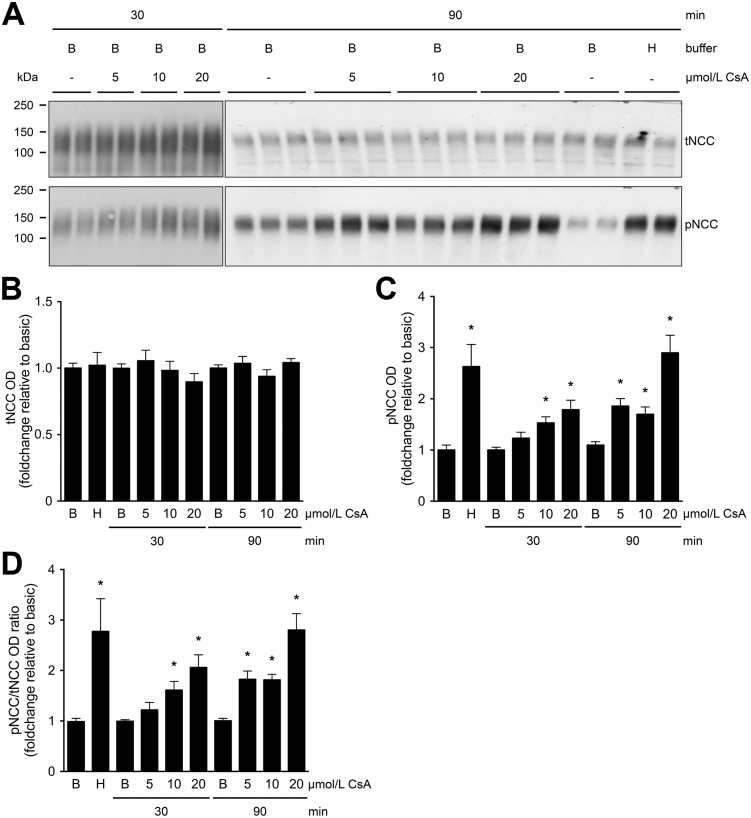
Animal studies have shown that the calcineurin inhibitors (CNIs) cyclosporine and tacrolimus can activate the thiazide-sensitive NaCl cotransporter (NCC). A common side effect of CNIs is hypertension. Renal salt transporters such as NCC are excreted in urinary extracellular vesicles (uEVs) after internalization into multivesicular bodies. Human studies indicate that CNIs also increase NCC abundance in uEVs, but results are conflicting and no relationship with NCC function has been shown. Therefore, we investigated the effects of CsA and Tac on the abundance of both total NCC (tNCC) and phosphorylated NCC at Thr60 phosphorylation site (pNCC) in uEVs, and assessed whether NCC abundance in uEVs predicts the blood pressure response to thiazide diuretics. Our results show that in kidney transplant recipients treated with cyclosporine (n = 9) or tacrolimus (n = 23), the abundance of both tNCC and pNCC in uEVs is 4-5 fold higher than in CNI-free kidney transplant recipients (n = 13) or healthy volunteers (n = 6). In hypertensive kidney transplant recipients, higher abundances of tNCC and pNCC prior to treatment with thiazides predicted the blood pressure response to thiazides. During thiazide treatment, the abundance of pNCC in uEVs increased in responders (n = 10), but markedly decreased in non-responders (n = 8). Thus, our results show that CNIs increase the abundance of both tNCC and pNCC in uEVs, and these increases correlate with the blood pressure response to thiazides. This implies that assessment of NCC in uEVs could represent an alternate method to guide anti-hypertensive therapy in kidney transplant recipients.
Conflict of interest statement
Figures
Similar articles
-
Hydrochlorothiazide treatment increases the abundance of the NaCl cotransporter in urinary extracellular vesicles of essential hypertensive patients.Am J Physiol Renal Physiol. 2017 Jun 1;312(6):F1063-F1072. doi: 10.1152/ajprenal.00644.2016. Epub 2017 Mar 8. Am J Physiol Renal Physiol. 2017. PMID: 28274929 Clinical Trial.
-
The calcineurin inhibitor tacrolimus activates the renal sodium chloride cotransporter to cause hypertension.Nat Med. 2011 Oct 2;17(10):1304-9. doi: 10.1038/nm.2497. Nat Med. 2011. PMID: 21963515 Free PMC article.
-
Effect of the DASH diet on the sodium-chloride cotransporter and aquaporin-2 in urinary extracellular vesicles.Am J Physiol Renal Physiol. 2024 Jun 1;326(6):F971-F980. doi: 10.1152/ajprenal.00274.2023. Epub 2024 Apr 18. Am J Physiol Renal Physiol. 2024. PMID: 38634133 Free PMC article.
-
Urinary extracellular vesicles as markers to assess kidney sodium transport.Curr Opin Nephrol Hypertens. 2016 Mar;25(2):67-72. doi: 10.1097/MNH.0000000000000192. Curr Opin Nephrol Hypertens. 2016. PMID: 26717312 Review.
-
Molecular insights from dysregulation of the thiazide-sensitive WNK/SPAK/NCC pathway in the kidney: Gordon syndrome and thiazide-induced hyponatraemia.Clin Exp Pharmacol Physiol. 2013 Dec;40(12):876-84. doi: 10.1111/1440-1681.12115. Clin Exp Pharmacol Physiol. 2013. PMID: 23683032 Review.
Cited by
-
Using human urinary extracellular vesicles to study physiological and pathophysiological states and regulation of the sodium chloride cotransporter.Front Endocrinol (Lausanne). 2022 Aug 29;13:981317. doi: 10.3389/fendo.2022.981317. eCollection 2022. Front Endocrinol (Lausanne). 2022. PMID: 36105401 Free PMC article. Review.
-
Does the composition of urinary extracellular vesicles reflect the abundance of renal Na+/phosphate transporters?Pflugers Arch. 2022 Nov;474(11):1201-1212. doi: 10.1007/s00424-022-02744-1. Epub 2022 Sep 8. Pflugers Arch. 2022. PMID: 36074191 Free PMC article.
-
Calcineurin dephosphorylates Kelch-like 3, reversing phosphorylation by angiotensin II and regulating renal electrolyte handling.Proc Natl Acad Sci U S A. 2019 Feb 19;116(8):3155-3160. doi: 10.1073/pnas.1817281116. Epub 2019 Feb 4. Proc Natl Acad Sci U S A. 2019. PMID: 30718414 Free PMC article.
-
Molecular immune monitoring in kidney transplant rejection: a state-of-the-art review.Front Immunol. 2023 Aug 22;14:1206929. doi: 10.3389/fimmu.2023.1206929. eCollection 2023. Front Immunol. 2023. PMID: 37675106 Free PMC article. Review.
-
Urinary Extracellular Vesicles Are a Novel Tool to Monitor Allograft Function in Kidney Transplantation: A Systematic Review.Int J Mol Sci. 2021 Sep 28;22(19):10499. doi: 10.3390/ijms221910499. Int J Mol Sci. 2021. PMID: 34638835 Free PMC article.
References
-
- Vincenti F, Jensik SC, Filo RS, Miller J, Pirsch J. A long-term comparison of tacrolimus (FK506) and cyclosporine in kidney transplantation: evidence for improved allograft survival at five years. Transplantation 2002;73:775–82. - PubMed
-
- Pirsch JD, Miller J, Deierhoi MH, Vincenti F, Filo RS. A comparison of tacrolimus (FK506) and cyclosporine for immunosuppression after cadaveric renal transplantation. FK506 Kidney Transplant Study Group. Transplantation 1997;63:977–83. - PubMed
-
- Holt S, Moore K. Different effects of tacrolimus and cyclosporine on renal hemodynamics and blood pressure in healthy subjects. Transplantation 2002;73:673–4. - PubMed
-
- Ligtenberg G, Hené RJ, Blankestijn PJ, Koomans HA. Cardiovascular risk factors in renal transplant patients: cyclosporin A versus tacrolimus. J. Am. Soc. Nephrol. 2001;12:368–73. - PubMed
MeSH terms
Substances
LinkOut - more resources
Full Text Sources
Other Literature Sources
Molecular Biology Databases
Miscellaneous
