. 2017 Apr 21;13(4):e1006331.
doi: 10.1371/journal.ppat.1006331. eCollection 2017 Apr.

Dual role of the Toxoplasma gondii clathrin adaptor AP1 in the sorting of rhoptry and microneme proteins and in parasite division

Affiliations

Dual role of the Toxoplasma gondii clathrin adaptor AP1 in the sorting of rhoptry and microneme proteins and in parasite division

Kannan Venugopal et al. PLoS Pathog. .

Abstract

Toxoplasma gondii possesses a highly polarized secretory system, which efficiently assembles de novo micronemes and rhoptries during parasite replication. These apical secretory organelles release their contents into host cells promoting parasite invasion and survival. Using a CreLox-based inducible knock-out strategy and the ddFKBP over-expression system, we unraveled novel functions of the clathrin adaptor complex TgAP1. First, our data indicate that AP1 in T. gondii likely functions as a conserved heterotetrameric complex composed of the four subunits γ, β, μ1, σ1 and interacts with known regulators of clathrin-mediated vesicular budding such as the unique ENTH-domain containing protein, which we named Epsin-like protein (TgEpsL). Disruption of the μ1 subunit resulted in the mis-sorting of microneme proteins at the level of the Trans-Golgi-Network (TGN). Furthermore, we demonstrated that TgAP1 regulates rhoptry biogenesis by activating rhoptry protein exit from the TGN, but also participates in the post-Golgi maturation process of preROP compartments into apically anchored club-shaped mature organelles. For this latter activity, our data indicate a specific functional relationship between TgAP1 and the Rab5A-positive endosome-like compartment. In addition, we unraveled an original role for TgAP1 in the regulation of parasite division. APμ1-depleted parasites undergo normal daughter cell budding and basal complex assembly but fail to segregate at the end of cytokinesis.


Conflict of interest statement

The authors have declared that no competing interests exist.

Figures
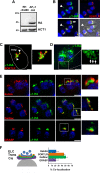
Fig 1
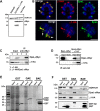
Fig 1. APμ1 localizes at the Trans-Golgi-Network and on secretory vesicles.
A- Western Blot image showing the expression of the endogenous HA-tagged μ1 subunit at the expected size of 49 kDa in knock-in parasites (RHΔKU80: parental strain). Actin (ACT1) was used as a loading control. B- Confocal microscopy images showing the localization of μ1-HA (green) with SORTLR (red) at the Golgi region (arrow). Nuclei are shown by DNA staining (blue). Note the very discrete signal of μ1-HA (green) at a localization corresponding to the residual body (arrowhead). Bar: 2 μm. C- SIM image showing the partial co-localization (indicated by arrowheads) of μ1-HA (green) with SORTLR (red) in sub-regions of the Golgi apparatus. Bar: 1 μm. D- SIM image showing the localization of μ1-HA (green) in vesicles spread throughout the parasite cytoplasm and also present in proximity to the plasma membrane (arrows in the inset). Bar: 2 μm. E- The co-localization of μ1-HA (green) with markers of the endosomal compartment (Rab5A-YFP), trans-Golgi (GalNAc-GFP) and cis-Golgi (GRASP-RFP) (all shown in red) was examined by SIM microscopy. For each marker, a zoom of the Golgi region is shown (insets). Bars: 2 μm. F- Scheme (left) illustrating the localization of the different markers associated with the endosomal-like compartment (ELC), the trans-Golgi (Trans) and the cis-Golgi (Cis). The histogram (right) indicates the percentage of co-localization between μ1-HA and Rab5A-YFP, SORTLR, GalNAc-GFP and GRASP-RFP, in at least 30 parasites that were analyzed for each condition. μ1-HA displays the strongest co-localization with the TGN markers SORTLR and GalNAc-GFP.
Fig 2
Fig 2. The unique ENTH-domain containing protein of T. gondii is a key partner of APμ1.
A- Western blot showing the expression of the cMyc-tagged EpsL protein at the expected size of 66 kDa in single KI parasites (lane 2), and together with μ1-HA (49 kDa) in double knock-in parasites (lane 3). The parental strain (RHΔKU80) is shown in lane 1. SORTLR was used as a loading control. B- Images illustrating the co-localization of EpsL-cMyc (green) with μ1-HA (red) (arrows), acquired with confocal microscopy (upper panel) or SIM (lower panel). Bars: 2μm. C- Co-immunoprecipitation of μ1-HA with EpsL-cMyc in double KI parasites (lanes 2) using anti-cMyc antibodies. No binding of the μ1-HA protein on anti-cMyc coated beads was detected in single KI μ1-HA expressing parasites (lane 1). D- Reverse co-immunoprecipitation of EpsL-cMyc with μ1-HA in double KI parasites using anti-HA antibodies. No binding of EpsL-cMyc protein with anti-HA antibody coated beads was detected in the single KI EpsL-cMyc expressing parasites. E, F- A GST-pull down experiment with the GST-tagged gamma appendage ear (GAE) and GST-tagged beta appendage ear (BAE) domains of TgAP1 was performed in presence of a total lysate from EpsL-cMyc/ μ1-HA double KI parasites. E: SDS-PAGE gel stained with coomassie blue showing that a similar quantity of GST, GST-GAE and GST-BAE (asterisks) was bound on the gluthation beads used in the assay shown in F. F: WB analysis demonstrated the preferential binding of EpsL-cMyc to the ear domain of the γ sub-unit (GAE). A weak interaction of SORTLR and the μ1 sub-unit with the BAE domain was also detected. GST alone was used as a control. FT: Flow-Through.
Fig 3
Fig 3. CreLox-based strategy used to deplete APμ1.
A- Scheme depicting the cloning strategy used to replace the endogenous μ1 locus by the LoxP-μ1-HA-LoxP insert. Upon rapamycin induction, the DiCre recombinase excised the LoxP flanked locus leading to YFP expression. The positions of the primers used to verify the integration of the insert into the genome and its excision upon rapamycin incubation, are indicated. B- PCR confirming the integration of the LoxP-μ1-HA-LoxP insert at the endogenous APμ1 locus resulting in the amplification of a band at 4.6 kb (asterisk). Rapamycin induction resulted in the amplification of a lower and weak band at 3.1 kb (asterisk) corresponding to the low percentage of APμ1-KO parasites. The primers used for the PCR are depicted in A-. Amplification of the enolase 2 (Eno2) gene was used as a control. C- WB showing the expression of integrated μ1-HA protein at the expected size in a clonal population (DiCre RHΔKU80: parental strain). ROP 2–4 was used as a loading control. D- Upper panel: Confocal microscopy images showing the localization of μ1-HA (green) together with SORTLR (red) at the TGN, after integration of the sequence flanked by the LoxP sites in DiCre RHΔKU80 parasites. Nuclei are shown by DNA staining (blue). Bar: 2μm. Lower panel: Confocal microscopy images showing the absence of μ1-HA signal (red) in YFP positive parasites (arrow) upon rapamycin treatment. Bars: 5μm.
Fig 4
Fig 4. APμ1 ablation impairs microneme protein localization.
A- Confocal images showing the localization of MIC8, MIC3, MIC2 and M2AP proteins (red) in control (YFP-negative parasites) and APμ1-KO parasites (YFP-positive). MIC8 accumulated in the parasite TGN, confirmed by its co-localization with SORTLR (white). MIC3 was found to be secreted into the parasitophorous vacuolar space (arrow). Parasite contours were stained with the IMC marker GAP45 (white). M2AP and MIC2 (parasite contours: IMC markers IMC1 and GAP45, respectively, both shown in white) displayed a preferential apical localization, while lateral micronemes were weakly detected. Nuclei are shown by DNA staining (blue). Bar: 2μm. B- Confocal microscopy images showing the localization of MIC4 (red, upper panel), and MIC6 proteins (red, lower panel) in control (YFP-negative parasites) and APμ1-KO parasites (YFP-positive). MIC4 was found to be secreted into the parasitophorous vacuolar space (arrow), while MIC6 was concentrated at the apex (arrow). C- SIM microscopy images showing the localization of μ1-HA (green) and proMIC3 (top) or proM2AP (bottom) in μ1-HA KI parasites. No co-localization between μ1-HA and proM2AP was observed in contrast to proMIC3. Bars: 2μm.
Fig 5
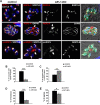
Fig 5. APμ1-KO parasites show defects in rhoptry formation.
A-Confocal images showing the localization of ROP2-4 and proROP4 proteins (red) in control (YFP-negative vacuoles) and APμ1-KO parasites (YFP-positive vacuoles) together with the TGN marker SORTLR and the IMC marker GAP45 (both in white). In APμ1-KO parasites, mature rhoptries were found dispersed within the cytosol (upper panel, arrow) or in the vacuolar space (middle panel, arrow), while immature proROP4 proteins were found re-routed towards the vacuolar space and residual body (lower panel, arrow). Bar: 2μm. B- Histogram indicating the percentage of examined vacuoles displaying apically positioned rhoptries in control and APμ1-KO parasites. Mean values of three independent assays are shown ± SEM, ***p<0.001 (Student’s t-test). C- Histogram indicating the percentage of examined vacuoles positive for the immature protein proROP4 staining in control and APμ1-KO parasites. Mean values of three independent assays are shown ± SEM, **p<0.01 (Student’s t-test). D- Histogram depicting the percentage of invaded parasites after 45 min incubation with host cells of mechanically released parasites for control (YFP-negative) and APμ1-KO (YFP-positive) parasites. Mean values of three independent assays are shown ± SEM, ***p<0.001 (Student’s t-test). E- Histogram depicting the percentage of egressed vacuoles after induction with the calcium ionophore A23187 in control (YFP-negative) and APμ1-KO (YFP-positive) parasites. Mean values of three independent assays are shown ± SEM, *p<0.05 (Student’s t-test).
Fig 6
Fig 6. The inducible over-expression of APμ1 only perturbed rhoptry formation.
A- Scheme showing the cloning strategy employed to insert the cMyc-tagged μ1 subunit under the influence of the destabilisation domain ddFKBP (DD). After addition of the synthetic ligand shield-1, the protein is no longer degraded but accumulated in the parasites (Tub8: tubulin promotor; HXGPRT: resistance cassette). The WB image shows the accumulation of the cMycμ1 protein upon shield-1 treatment for the indicated time periods. The protein eno2 was used as a loading control. B- Confocal microscopy images showing the localization of the over-expressed cMycμ1 protein (red) in a clonal population of DDμ1 parasites in two confocal planes (z3 and z5). cMycμ1 was detected at the Golgi apparatus (co-localization with SORTLR shown in green in the merged image) and in vesicles accumulating at the basal pole of the parasites (arrows). Bar: 2μm. C- Confocal images showing the localization of ROP2-4 (upper panel) or proROP4 (lower panel) proteins (both in green) and cMycμ1 (red) in control RH and DDμ1 parasites incubated with shield-1 (+S) for 24 hours. The contours of the parasites are delineated by staining of the IMC markers, GAP45 or IMC1 (white). Rhoptries are detected as dispersed atrophied compartments (arrows and insets in upper panel) in DDμ1 parasites, while proROP4 compartments were normally formed (arrow in lower panel). D- Histogram indicating the percentage of examined vacuoles displaying apically positioned rhoptries in control and DDμ1 parasites induced with shield-1 (+S) for 24 hours. Mean values of three independent assays are shown ± SEM, ***p<0.001 (Student’s t-test). E- Histogram indicating the percentage of vacuoles positive for the immature protein proROP4 staining in control and DDμ1 parasites induced with shield-1 (+S) for 24 hours. Mean values of three independent assays are shown ± SEM. F- Confocal images showing the co-localization of ROP2-4 (white), proROP4 (green) and cMycμ1 (red) in control RH and DDμ1 parasites incubated with shield-1 for 24 hours. Bar: 2μm. On the right, a zoom of the Golgi region indicated by a white frame in the merge image is shown. G- The histogram indicates the percentage of co-localization between the proROP4 signal and the ROP2-4 signal after image acquisition by airyscan confocal microscopy. Data are indicated as average ± SD, n = 15 vacuoles. H- WB analysis of ROP4 protein proteolytic processing in control RH and DDμ1 parasites incubated with shield-1 (+S) for 24 hours. No defect was found as the immature proROP4 and mature ROP4 proteins were detected at similar amounts in both parasites lines. Actin (ACT1) was used as a loading control and the detection of the cMycμ1 protein was used as a control for the shield-1 induction. I- Invasion assay. Histogram depicting the percentage of invaded parasites after 45 min incubation with host cells of mechanically egressed parasites for both the parental strain and DDμ1 parasites induced with shield-1 (+S) for 16 hours. Mean values of three independent assays are shown ± SEM, **p<0.01 (Student’s t-test).
Fig 7
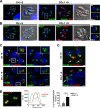
Fig 7. Over-expression of APμ1 perturbed the Rab5A compartment morphology.
A, B- Confocal images showing the localization of Rab5A (A, green), Rab7 (B, green) and cMycμ1 (A, B, red) in the parental strain RH and DDμ1 parasites treated with shield-1 (+S) for 16 hours. A zoom of the Golgi area indicated by the white frame in each image is shown as an inset on the right. Bar: 2μm. C- SIM images showing the localization of proROP4 (red) and Rab5A-HA (green) proteins in control RH parental strain (upper panel) and cMycμ1 over-expressing parasites (lower panel) treated with shield-1 (+S) for 16 hours. Bars: 2μm. D- SIM images showing the co-distribution of Rab5A-positive vesicles surrounding proROP4 vesicular compartments in RH parental strain (upper panel), while TGN-distant preROP compartments were negative for Rab5A staining (arrows). Induced DDμ1 parasites exhibited Rab5A-positive enlarged vesicular compartments (lower panel, arrow) empty of proROP4 proteins (red). Bars: 500 nm. E- Left: SIM image of DDμ1 parasites induced with shield-1 showing proRO4 proteins (red) contained in vesicles with a strong Rab5A (green) signal at their limiting membrane illustrated by the intensity profile of each signal (graph). Right: Histogram depicting the percentage of proROP4-positive vacuoles showing a Rab5A signal at their limiting membrane in RH and DDμ1 parasites treated with shield-1 (+S). Data are presented as average ± SD (n = 50 parasites), ***p<0.001 (Student’s t-test).
Fig 8
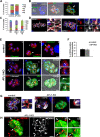
Fig 8. TgAP1 regulates parasite growth.
A, C: Intracellular growth assay performed in APμ1-KO parasites after rapamycin treatment (A) and DDμ1 parasites after ± shield-1 induction (C) at 24 hours post-invasion revealed defects in parasite replication. The histograms depict the percentage of vacuoles containing 2, 4, 8, 16 or 32 parasites. Mean values of three independent assays are shown ± SEM. B, D: Confocal images showing the disorganized appearance of dividing APμ1-KO (B) and DDμ1 parasites (D). B- After 48 hours of growth, the APμ1-KO parasites (YFP-positive, green) have stopped to grow and parasites seem to display a defect in segregation. Note the apparent rupture of the cortex revealed by the GAP45 staining (red) (arrow). Nuclei are shown by DNA staining (blue). D- Induced DDμ1 parasites were labeled for GAP45 (white) and overexpressed cMycμ1 proteins (red). Left (i): Mis-organised vacuole showing tethered parasites with an apparent defect in lateral segregation revealed by the GAP45 staining (insets: zoom of the different areas indicated by arrows in the main image). Right (ii): Confocal images showing the enrichment of the overexpressed cMycμ1 protein at sites, where parasites have remained tethered to each other (insets: region 1: lateral sides, region 2: basal pole). E- Upper panel: Confocal microscopy images in control parasites showing the duplication of the centromers (centromeric protein chromo1, green, image 1) and the formation of daughter buds (IMC3 protein, red, images 2, arrowhead). Note that chromo1 transiently accumulates at the basal pole of parasites at the very end of the daughter cell budding process (image 3, arrow). Lower two panels: Confocal microscopy images of APμ1-KO parasites (YFP-positive parasites) showing the duplication of the centromers (chromo1, white arrows) and the formation of daughter buds (IMC3, red, middle and lower panels). Note the accumulation of chromo1 at sites connecting mother parasites, while daughter cells complete bud formation (lower panel, arrows). Bars: 2μm. F- Histogram depicting the percentage of vacuoles containing budding daughter cells (IMC3 staining) in control and APμ1-KO parasites. Mean values of three independent assays are shown ± SEM. G- Airyscan confocal microscopy images showing the localization of MORN1-cherry (red) in control (YFP-negative, left) and APμ1-KO parasites (YFP-positive, right) parasites. The parasite contours were delineated by staining the IMC marker GAP45 (white). The insets show a zoom of the region indicated by a frame in the main image. H- Airyscan confocal images showing APμ1-KO parasites (YFP-positive, green) expressing the MORN1-cherry protein (red). MORN1-positive daughter rings were normally assembled (asterisks) but mother parasites seemed to be attached by their basal pole (arrows), which appeared as deformed elongated membranous structures (insets: two confocal planes z1 and z2 of the regions 1 and 2 indicated with a white frame in the main image, arrows). Bars: 2μm.
Fig 9
Fig 9. Correlative Light Electron Microscopy (CLEM) images illustrating the organization of the basal pole (arrow heads) and the residual body (arrows) in control and APμ1-KO parasites.
A-D: Non-YFP control vacuoles (C: zoom of the region indicated by a white frame in B). Note the typical organization in a rosette-like structure and the correct morphology of the parasites. E-H: YFP-positive APμ1-KO parasites (detected in the region 3T shown in S10 Fig). Bars: 500 nm.
Fig 10
Fig 10
Transmission electron microscopy images showing the formation of mature rhoptries (Rh) and micronemes (Mi) anchored at the apical pole in control parasites (A) and the normal distribution of parasites in rosette-like structures (B). Bars: 500nm. (C)- Zoom of the posterior end of the control parasites showing the tight constriction of the basal pole with a thin continuity to the residual body (arrowhead). In DDμ1 parasites induced with shield-1 (+S) for 24 hours (D-I), apically positioned rhoptries could not be detected in contrast to micronemes (D) or they were found dispersed in the cytoplasm (E, arrow). Numerous giant lucent vesicles (V) were also observed (D, G, H). In addition, the parasites were found disorganised within the vacuole with a distorted morphology (G-I) particularly at the basal pole (F, G and I, arrow), which appeared deformed and elongated (arrows in F) despite the detection of the residual body (F and I, arrowhead). In addition, some parasites seemed to remain attached by discrete lateral contact sites (H, arrow). Bars: 500nm. Mi: micronemes, Rh: rhoptries, PV: parasitophorous vacuole, V: vesicles.
Fig 11
Fig 11. Model summarizing the different functions of AP1 in T. gondii.
A- Our data indicate that TgAP1 is involved in the sorting of MIC proteins from the TGN and rhoptry biogenesis, as well as, participates to daughter cell segregation. This latter activity might be regulated by a TgAP1-dependent recycling activity of the mother plasma membrane from the residual body or a direct transport of vesicles from the Golgi to the nascent daughter pellicles. B- TgAP1 regulates the sorting and transport of all the different studied MIC protein complexes from the TGN (green arrow), including MIC3/8, MIC1/4/6 and M2AP/MIC2, resulting in the loss of lateral micronemes containing these proteins. However, a subpopulation of apical micronemes, containing the proteins MIC2/M2AP, AMA1 and MIC6, were still detected upon APμ1 ablation. At the molecular level, one can envision that TgAP1 recognizes via its subunits γ‒σ, the dileucine motif present in the cytoplasmic tail of SORTLR, which has loaded the soluble MIC partner (such as MIC3). TgAP1 could simultaneously bind to the tyrosine motif of the transmembrane MIC partner (such as MIC8) via its subunits β‐μ, thereby participating to the complex stabilization and transport into clathrin-coated vesicles from the TGN. These putative sorting mechanisms have to be confirmed. Finally, we found that TgAP1 regulates ROP protein transport from the TGN to the Rab5A-positive ELC and also the subsequent steps of the rhoptry maturation process. TgAP1 could regulate the latter activity either, by stimulating ROP protein exit from the ELC or by retrieving material from the preROP compartments in a Rab5A-dependent manner to ensure the following steps of maturation into club-shaped apically anchored organelles (green arrows). The Rab7-positive ELC also likely participates in ROP and MIC trafficking, though a specific functional relationship was found between TgAP1 and the Rab5A-positive ELC. C- Our data also indicate that the AP1 complex in T. gondii functions as a conserved heterotetrameric complex composed of the μ1, σ1, γ and β subunits and interacts with ARF1 and clathrin. We also found that the ear appendage domain of the γ subunit associates with the unique ENTH-domain containing protein TgEpsL.

Similar articles

Cited by

References

    1. Saadatnia G, Golkar M. A review on human toxoplasmosis. Scand J Infect Dis. 2012. November;44(11):805–14. doi: 10.3109/00365548.2012.693197 - DOI - PubMed
    1. Besteiro S, Dubremetz J-F, Lebrun M. The moving junction of apicomplexan parasites: a key structure for invasion. Cell Microbiol. 2011. June;13(6):797–805. doi: 10.1111/j.1462-5822.2011.01597.x - DOI - PubMed
    1. Lamarque MH, Roques M, Kong-Hap M, Tonkin ML, Rugarabamu G, Marq J-B, et al. Plasticity and redundancy among AMA-RON pairs ensure host cell entry of Toxoplasma parasites. Nat Commun. 2014. June 17;5:4098 doi: 10.1038/ncomms5098 - DOI - PubMed
    1. Carruthers V, Boothroyd JC. Pulling together: an integrated model of Toxoplasma cell invasion. Curr Opin Microbiol. 2007. February;10(1):83–9. doi: 10.1016/j.mib.2006.06.017 - DOI - PubMed
    1. Hunter CA, Sibley LD. Modulation of innate immunity by Toxoplasma gondii virulence effectors. Nat Rev Microbiol. 2012. November;10(11):766–78. doi: 10.1038/nrmicro2858 - DOI - PMC - PubMed

MeSH terms

LinkOut - more resources