

Evidence for a Strong Correlation Between Transcription Factor Protein Disorder and Organismic Complexity
- PMID: 28430951
- PMCID: PMC5434936
- DOI: 10.1093/gbe/evx073
Evidence for a Strong Correlation Between Transcription Factor Protein Disorder and Organismic Complexity
Abstract
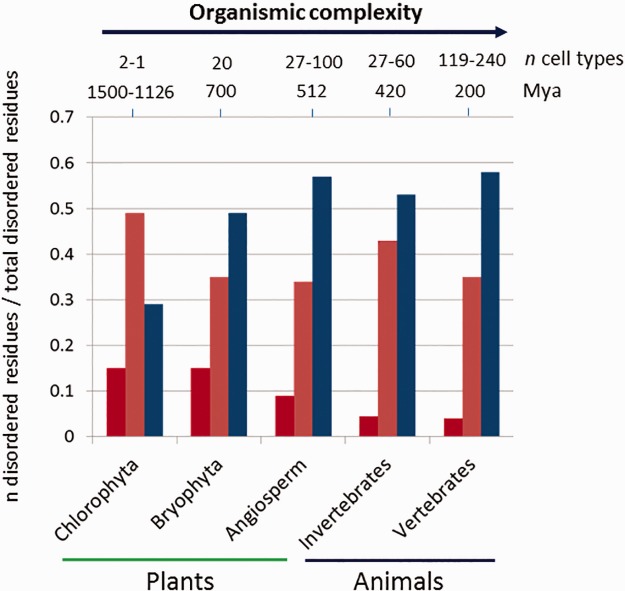
Studies of diverse phylogenetic lineages reveal that protein disorder increases in concert with organismic complexity but that differences nevertheless exist among lineages. To gain insight into this phenomenology, we analyzed all of the transcription factor (TF) families for which sequences are known for 17 species spanning bacteria, yeast, algae, land plants, and animals and for which the number of different cell types has been reported in the primary literature. Although the fraction of disordered residues in TF sequences is often moderately or poorly correlated with organismic complexity as gauged by cell-type number (r2 < 0.5), an unbiased and phylogenetically broad analysis shows that organismic complexity is positively and strongly correlated with the total number of TFs, the number of their spliced variants and their total disordered residues content (r2 > 0.8). Furthermore, the correlation between the fraction of disordered residues and cell-type number becomes stronger when confined to the TF families participating in cell cycle, cell size, cell division, cell differentiation, or cell proliferation, and other important developmental processes. The data also indicate that evolutionarily simpler organisms allow for the detection of subtle differences in the conserved IDRs of TFs as well as changes in variable IDRs, which can influence the DNA recognition and multifunctionality of TFs through direct or indirect mechanisms. Although strong correlations cannot be taken as evidence for cause-and-effect relationships, we interpret our data to indicate that increasing TF disorder likely was an important factor contributing to the evolution of organismic complexity and not merely a concurrent unrelated effect of increasing organismic complexity.
Keywords: cell-type number; complexity; evolution; intrinsically disordered protein (IDP); transcription factors.
© The Author 2017. Published by Oxford University Press on behalf of the Society for Molecular Biology and Evolution.
Figures


Similar articles
-
Evolution of Protein Ductility in Duplicated Genes of Plants.Front Plant Sci. 2018 Aug 20;9:1216. doi: 10.3389/fpls.2018.01216. eCollection 2018. Front Plant Sci. 2018. PMID: 30177944 Free PMC article.
-
Multifunctional Intrinsically Disordered Regions in Transcription Factors.Chemistry. 2023 Apr 13;29(21):e202203369. doi: 10.1002/chem.202203369. Epub 2023 Mar 6. Chemistry. 2023. PMID: 36648282 Review.
-
The relationship between proteome size, structural disorder and organism complexity.Genome Biol. 2011 Dec 19;12(12):R120. doi: 10.1186/gb-2011-12-12-r120. Genome Biol. 2011. PMID: 22182830 Free PMC article.
-
Transcription factor evolution in eukaryotes and the assembly of the regulatory toolkit in multicellular lineages.Proc Natl Acad Sci U S A. 2013 Dec 10;110(50):E4858-66. doi: 10.1073/pnas.1311818110. Epub 2013 Nov 25. Proc Natl Acad Sci U S A. 2013. PMID: 24277850 Free PMC article.
-
The evolutionary origins of cell type diversification and the role of intrinsically disordered proteins.J Exp Bot. 2018 Mar 24;69(7):1437-1446. doi: 10.1093/jxb/erx493. J Exp Bot. 2018. PMID: 29394379 Review.
Cited by
-
Features of molecular recognition of intrinsically disordered proteins via coupled folding and binding.Protein Sci. 2019 Nov;28(11):1952-1965. doi: 10.1002/pro.3718. Epub 2019 Sep 4. Protein Sci. 2019. PMID: 31441158 Free PMC article. Review.
-
Exploring intrinsically disordered proteins in Chlamydomonas reinhardtii.Sci Rep. 2018 May 1;8(1):6805. doi: 10.1038/s41598-018-24772-7. Sci Rep. 2018. PMID: 29717210 Free PMC article.
-
Computational prediction of disordered binding regions.Comput Struct Biotechnol J. 2023 Feb 10;21:1487-1497. doi: 10.1016/j.csbj.2023.02.018. eCollection 2023. Comput Struct Biotechnol J. 2023. PMID: 36851914 Free PMC article. Review.
-
IndiSPENsable for X Chromosome Inactivation and Gene Silencing.Epigenomes. 2023 Nov 2;7(4):28. doi: 10.3390/epigenomes7040028. Epigenomes. 2023. PMID: 37987303 Free PMC article. Review.
-
Protein Aggregation Landscape in Neurodegenerative Diseases: Clinical Relevance and Future Applications.Int J Mol Sci. 2021 Jun 2;22(11):6016. doi: 10.3390/ijms22116016. Int J Mol Sci. 2021. PMID: 34199513 Free PMC article. Review.
References
-
- Anderson-Sprecher R. 1994. Model comparisons and R. Am Stat. 48 (2):p113–117.
-
- Bell G, Mooers AO.. 1997. Size and complexity among multicellular organisms. Biol J Linnean Soc. 60:345–363.
Publication types
MeSH terms
Substances
LinkOut - more resources
Full Text Sources
Other Literature Sources
Molecular Biology Databases
Miscellaneous
