. 2017 Jun 20;45(11):6442-6458.
doi: 10.1093/nar/gkx259.

BRG1 interacts with SOX10 to establish the melanocyte lineage and to promote differentiation

Affiliations

BRG1 interacts with SOX10 to establish the melanocyte lineage and to promote differentiation

Himangi G Marathe et al. Nucleic Acids Res. .

Abstract

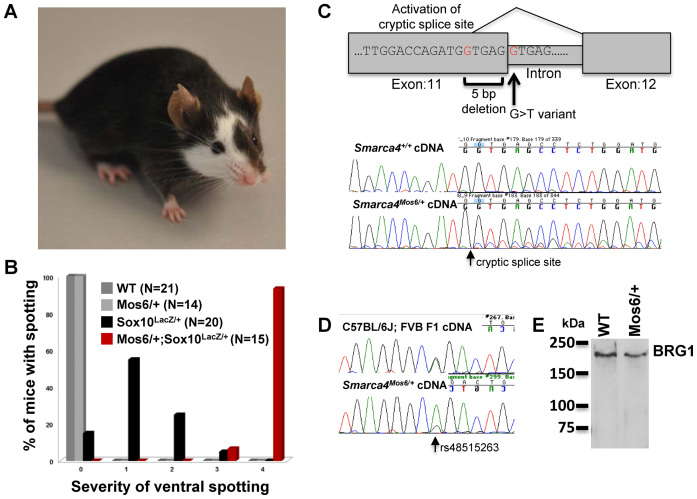
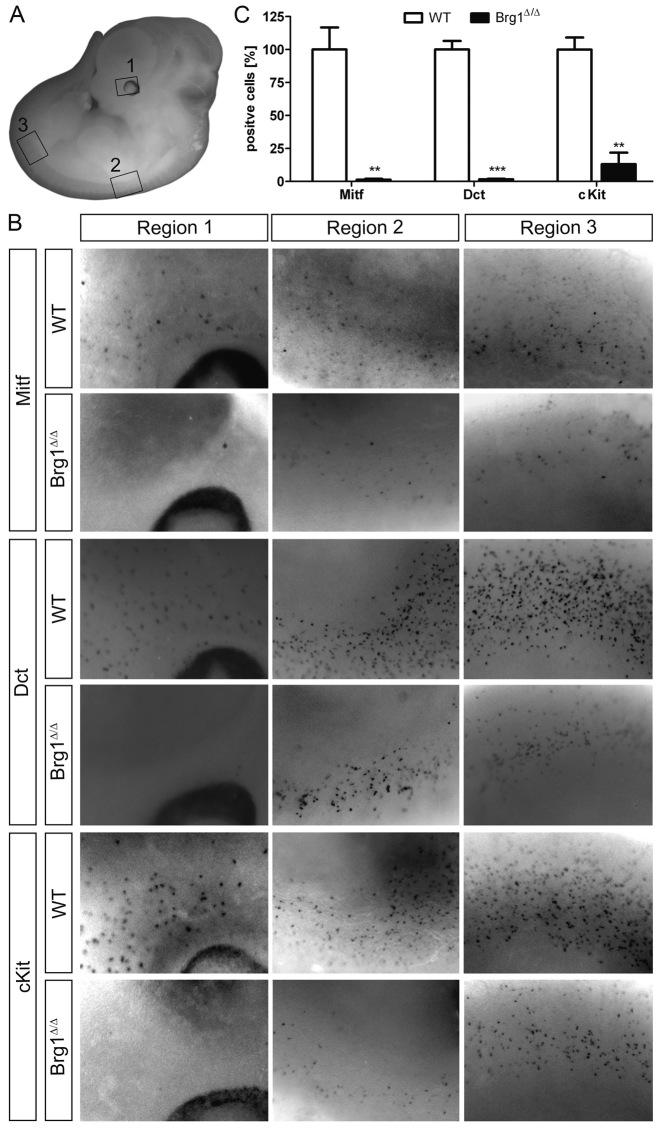
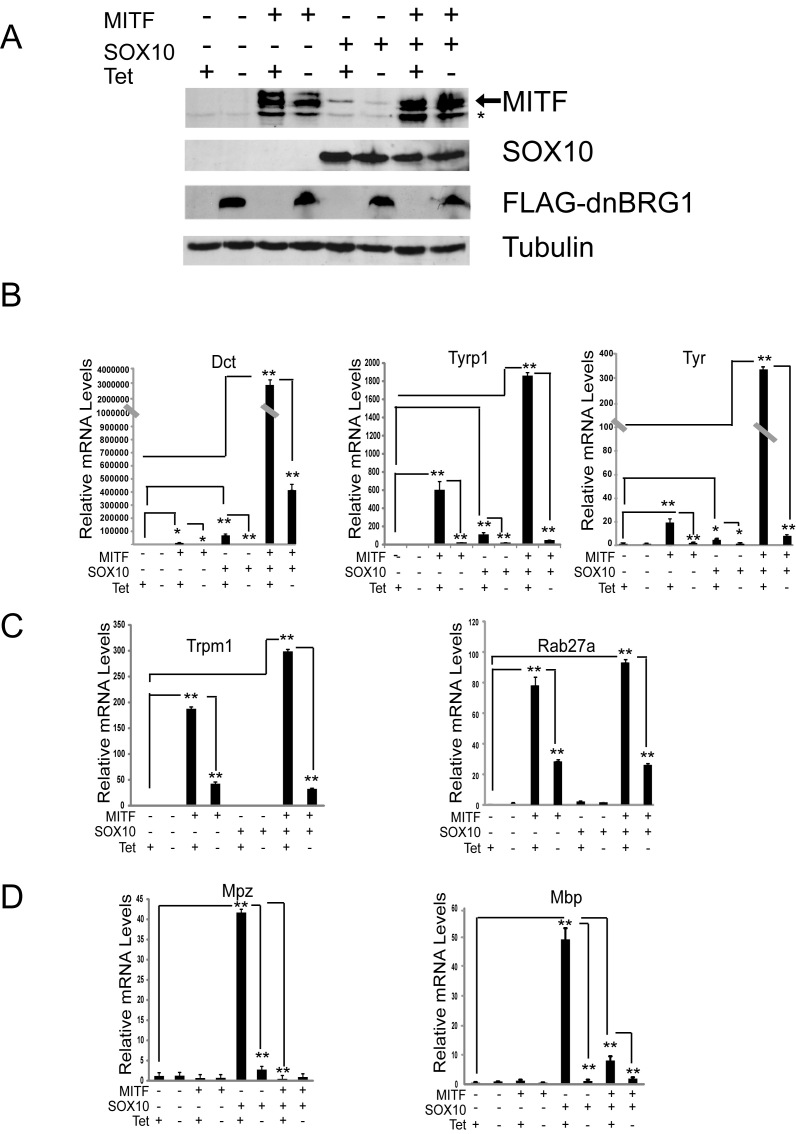
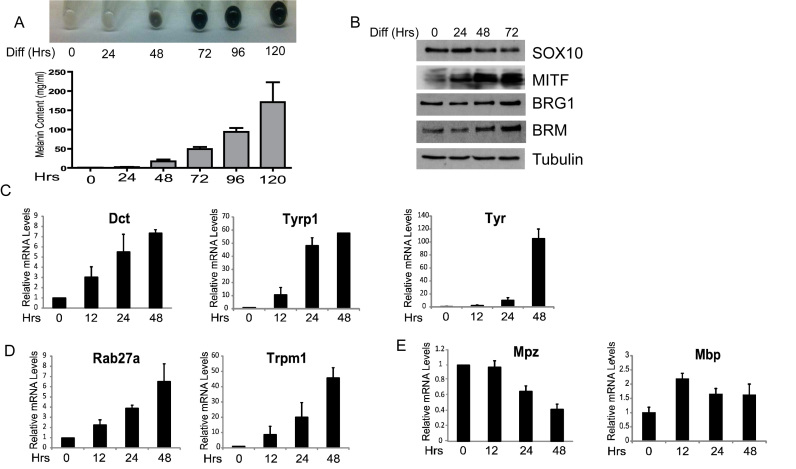
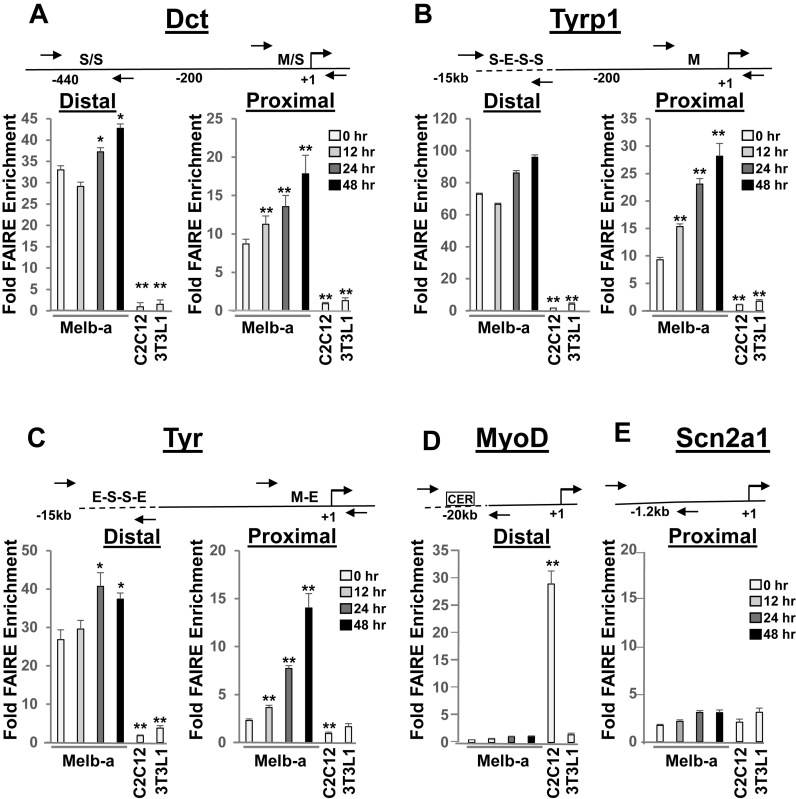
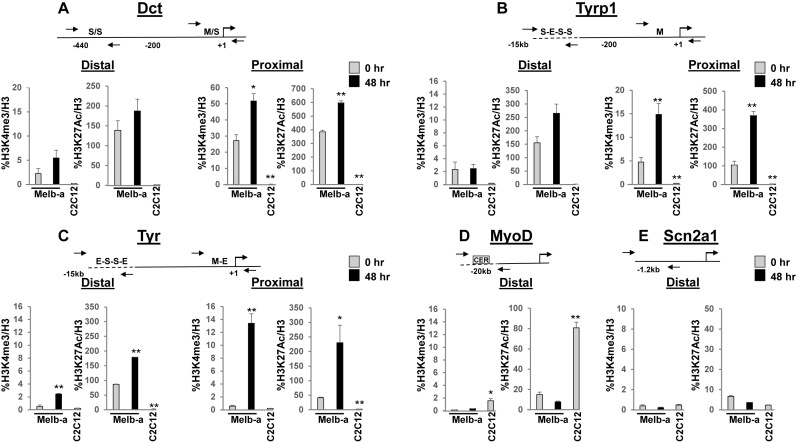
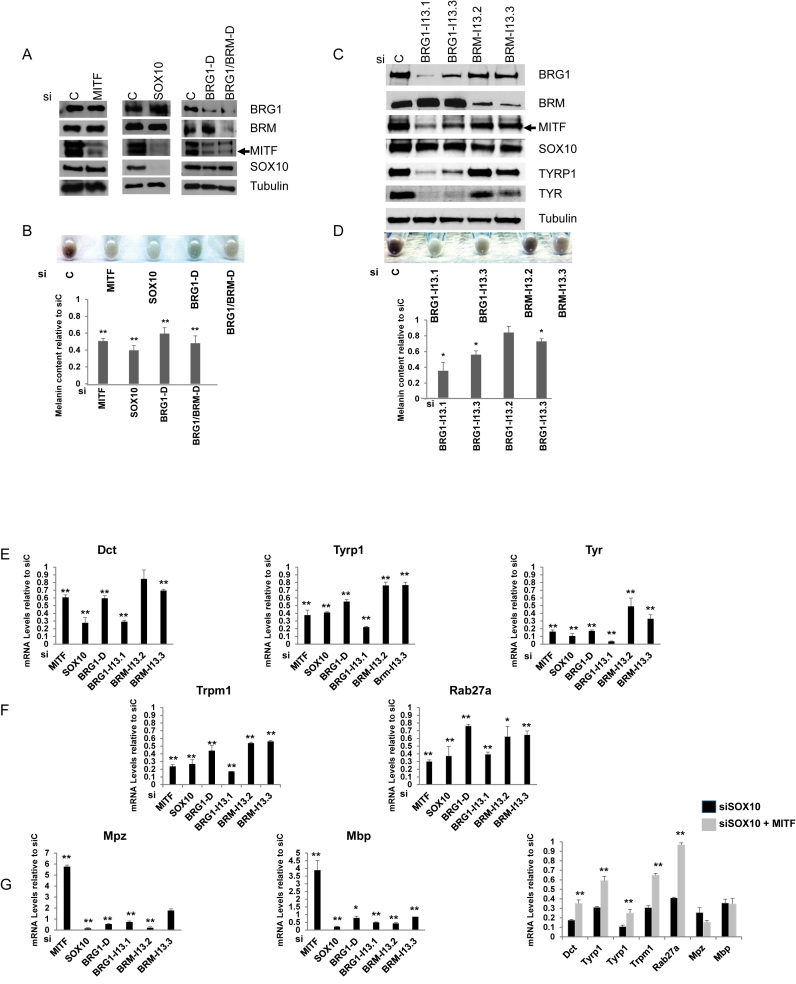
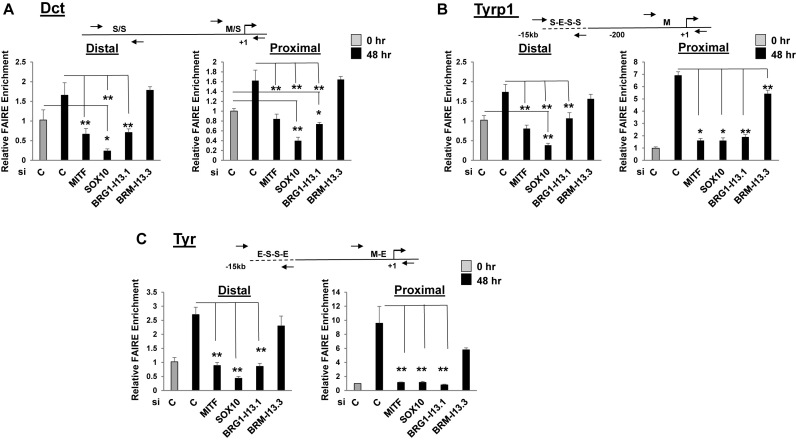
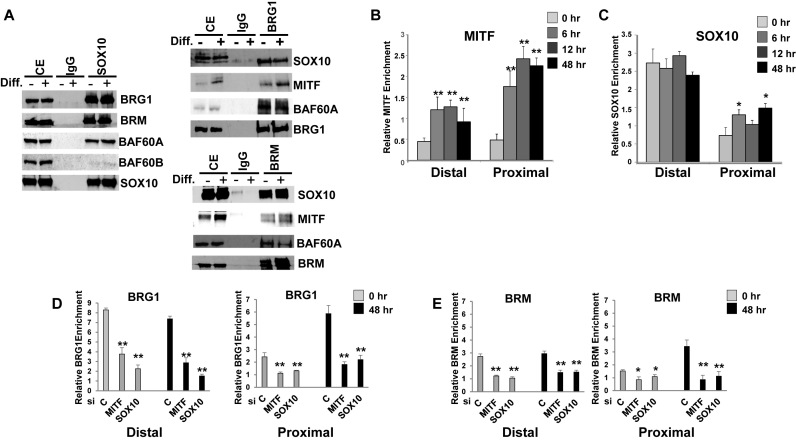
Mutations in SOX10 cause neurocristopathies which display varying degrees of hypopigmentation. Using a sensitized mutagenesis screen, we identified Smarca4 as a modifier gene that exacerbates the phenotypic severity of Sox10 haplo-insufficient mice. Conditional deletion of Smarca4 in SOX10 expressing cells resulted in reduced numbers of cranial and ventral trunk melanoblasts. To define the requirement for the Smarca4 -encoded BRG1 subunit of the SWI/SNF chromatin remodeling complex, we employed in vitro models of melanocyte differentiation in which induction of melanocyte-specific gene expression is closely linked to chromatin alterations. We found that BRG1 was required for expression of Dct, Tyrp1 and Tyr, genes that are regulated by SOX10 and MITF and for chromatin remodeling at distal and proximal regulatory sites. SOX10 was found to physically interact with BRG1 in differentiating melanocytes and binding of SOX10 to the Tyrp1 distal enhancer temporally coincided with recruitment of BRG1. Our data show that SOX10 cooperates with MITF to facilitate BRG1 binding to distal enhancers of melanocyte-specific genes. Thus, BRG1 is a SOX10 co-activator, required to establish the melanocyte lineage and promote expression of genes important for melanocyte function.


Figures

Figure 1.
Figure 1.
Identification of the Smarca4Mos6 allele. (A) SOX10LacZ/+; Mos6/+ double heterozygous mice exhibited a head spot and extensive belly spotting, demonstrating that the presence of the Mos6 allele increased the spotting phenotype of SOX10LacZ/+. (B) Hypopigmentation in the trunk of adult mice was quantitated using a standardized scale of 0–4, in which 0 indicates no spotting, and 1–4 indicates progressively greater hypopigmentation (32). Mos6 synergistically increased the ventral white spotting observed in SOX10 haploinsufficient mice. (C) The Smarca4 mutation splice site variant (mm9 Chr9:21447196;G>T) that alters a consensus 5΄ donor splice site at the junction of exon 11 and intron 11 (c.1812+1G>T, NM_001174078.1). Low levels of a mutant transcript were detected (15% of total transcript), suggesting the mutant causes activation of a cryptic splice site within exon 11, as illustrated. (D) In cDNA from an outcross C57BL/6J and FVB/N F1 hybrid embryo, the two strain-specific alleles at rs48515263, a SNP located within exon 15 of Smarca4, were present in equal proportion. In cDNA from an embryo carrying the Mos6 ENU-induced C57BL/6J mutation, the C57BL/6J SNP allele detected in the mutant transcript was reduced relative to the FVB/N wild-type allele, consistent with instability of the Mos6 mutant allele. (E) Western blots detected only wild-type BRG1 expressed in Mos6/+ heterozygous embryos. Similar results were observed using four embryos of each genotype run in triplicate Western blots with no detection of a truncated protein even with overloading or overexposure.
Figure 2.
Figure 2.
Conditional deletion of Smarca4 resulted in a striking reduction in the numbers of cranial and ventral trunk melanoblasts at E12.5. (A) The melanoblast-containing regions labeled 1 (cranial melanoblasts near optic cup), 2 (anterior trunk at forelimb) and 3 (posterior trunk at hindlimb) are shown at greater magnification in B, as indicated. (B) Comparison of melanoblast number, as measured by whole mount in situ hybridization for MITF (top), Dct (center) and Kit (bottom) shows fewer melanoblasts in embryos where Smarca4 was conditionally deleted in melanoblasts using a SOX10-Cre construct (BRG1Δ/Δ) as compared to normal littermates (WT). (C) Quantification of cells in the eye region from the ISH whole mounts that were positive for the indicated melanocyte markers (***P < 0.001, **P < 0.01, Student's t test).
Figure 3.
Figure 3.
Dominant negative BRG1 inhibits activation of melanocyte-specific genes by MITF and SOX10. (A) B22 cells were infected with a pBABE control vector, pBABE-MITF, pBABE-SOX10 or pBABE-MITF with pBABE-SOX10 in the presence (dominant negative BRG1 off) or absence of tetracycline (dominant negative BRG1 on) and then cultured in low serum medium to promote differentiation. Western Blot analysis showing expression of MITF and SOX10 in cells that were cultured in the presence and absence of tetracycline, and the expression of FLAG-tagged dominant BRG1 when cells were cultured in the absence of tetracycline. Protein expression was detected from cell extracts and tubulin was used as a loading control. (B–D) Quantitative RT-PCR (qRT-PCR) of MITF and/or SOX10 target genes from cells transfected with pBABE, pBABE-MITF, pBABE-SOX10 or pBABE-MITF together with pBABE-SOX10 in the presence or absence of tetracycline demonstrated that dominant negative BRG1 blocked the (B) synergistic activation of Dct, Tyrp1 and Tyr gene expression by SOX10 and MITF, (C) activation of Trpm1 and Rab27a by MITF and (D) activation of Mpz and Mbp by SOX10. Expression of each gene was normalized to expression of Rpl7. The data are the average of at least two independent experiments performed in triplicate. Standard error bars and statistical significance are shown (**P < 0.01, *P < 0.05, ANOVA).
Figure 4.
Figure 4.
Melanin synthesis and changes in gene expression during a time course of melanoblast differentiation (A) Melb-a cells were cultured in growth medium containing SCF and FGF until 70% confluent (time 0), then growth medium was replaced with differentiation medium containing NDP-α-MSH and the cells were cultured for the indicated periods of time. Cells were harvested at each time point and photographed. Cells were counted and an equal number were subjected to the melanin assay. The data are the average of at least two independent experiments performed in triplicate. Standard error bars and statistical significance compared to siC are shown (**P < 0.01, *P < 0.05, Student's t test). (B) Protein extracts were prepared from differentiating Melb-a cells and subjected to Western blotting with the indicated antibodies. Tubulin was used as a loading control. (C–E) RNA was isolated at the indicated time points, reversed transcribed and the specific transcript of interest quantified by qRT-PCR. The CT value for each gene was normalized to Rpl7. The data are the average of at least two independent experiments performed in triplicate. (C) Melanogenic enzyme gene expression increased as the cells differentiated. (D) Expression of genes associated with melanocyte differentiation increased as the cells differentiated. (E) Expression of myelin genes either decreased (Mpz) or exhibited a transient modest increase (Mbp). Standard error bars and statistical significance compared to siC are shown (**P < 0.01, *P < 0.05, Student's t test).
Figure 5.
Figure 5.
Time course of chromatin accessibility at distal and proximal control regions of melanogenic enzyme genes during Melb-a differentiation. (A–C) Melb-a cells were cultured in growth medium containing SCF and FGF2 until 70% confluent (time 0). Growth medium was replaced with differentiation medium containing NDP-α-MSH and the cells were cultured for the indicated periods of time. C2C12 and 3T3L1 cells were cultured in growth media and harvested at 70% confluency. Cells were cross-linked and subjected to FAIRE analysis. Enrichment was quantified by qPCR by normalizing to an input (UnFAIRE) control for each primer set. A schematic of the distal enhancer and proximal promoter elements for each locus is shown above each graph. (A) Dct, (B) Tyrp1, (C) Tyr. (D) MyoD, (E) Scn2a1 (M: Mbox, S: SOX10 binding site, E: E box). The data are the average of at least two independent experiments performed in triplicate. Standard error bars and statistically significant differences compared to undifferentiated (0hr) Melb-a cells are shown (**P < 0.01, *P < 0.05, Student's t test).
Figure 6.
Figure 6.
Changes in histone modifications at distal and proximal control regions of melanogenic enzyme genes during Melb-a differentiation. Chromatin immunoprecipitations (ChIPs) were performed with an antibodies to histone H3, histone H3 acetylated on lysine 27 (H3K27ac), histone H3 trimethylated at lysine 4 (H3K4me3). or a control IgG antibody. Enrichment was quantified by qPCR by normalizing to H3 for each primer set. ChIP with IgG resulted in <1% of the enrichment obtained with histone antibodies (data not shown). (A) Dct, (B) Tyrp1, (C)Tyr, (D) MyoD CER, (E) Upstream region of Scn2a1. The data are the average of at least two independent experiments performed in triplicate. Standard error bars and statistical significance compared to undifferentiated (0hr) Melb-a cells are shown (**P < 0.01, *P < 0.05, Student's t test).
Figure 7.
Figure 7.
SOX10 and BRG1 are required for melanocyte differentiation. Undifferentiated Melb-a cells were transfected with the indicated siRNAs for 48 hours. The medium was then replaced by differentiation medium and cells were cultured for an additional 48 h. (A) Melb-a cells were subjected to Western blotting with antibodies to BRG1, BRM, MITF and SOX10. Tubulin was used as a loading control. (B) Melb-a cells transfected with the indicated siRNAs were pelleted and photographed. Cells were counted, and an equal number were subjected to the melanin assay. Each of the siRNAs resulted in a significant reduction in melanin relative to the siC. (C) Melb-a cells transfected with siRNAs that uniquely target BRG1 or BRM were subjected to Western blotting as in (A). Protein extracts were also evaluated for TYRP1 and TYR expression. (D) Melb-a cells transfected with siRNAs that uniquely target BRG1 or BRM were pelleted, photographed and subjected to the melanin assay as in (B). (E–G) RNA was isolated from siC, siMITF, siSOX10, siBRG1-D, siBRG1-I13.1, siBRM-I13.2 and siBRM-I13.3 transfected Melb-a cells, reversed transcribed and quantified by qRT-PCR. The CT value for each gene was normalized to Rpl7. (E) Melanogenic enzyme gene expression. (F) Expression of genes associated with melanocyte differentiation. (G) Expression of myelin genes. The data are the average of at least two independent experiments performed in triplicate. Standard error bars and statistical significance compared to siC are shown (**P < 0.01, *P < 0.05, Student's t test). (H) Melb-a cells were co-transfected with siSOX10 and CMV-MITF. RNA was isolated from siC, siSOX10, and siSOX10/CMV-MITF transfected Melb-a cells, reversed transcribed and quantified by qRT-PCR. The CT values for each gene were normalized to Rpl7 and are presented relative to values obtained with siC transfected cells. The data are the average of at least two independent experiments performed in triplicate. Standard error bars are shown. Stars indicate statistical difference between the MITF rescued siSOX10 cells compared to siSOX10 (**P < 0.01, *P < 0.05).
Figure 8.
Figure 8.
Knockdown of SOX10, MITF, or BRG1/BRM reduces chromatin accessibility at distal and proximal control regions of the melanogenic enzyme genes. (A–C). Undifferentiated Melb-a cells were transfected with siC, siMITF, siSOX10, siBRG1-I3.1 or siBRMI3.3 for 48 h. The medium was then replaced by differentiation medium and cells were cultured for an additional 48 h. One set of cells was processed for FAIRE prior to differentiation (siC-undifferentiated). Cells were cross-linked and subjected to FAIRE analysis. Enrichment was quantified by qPCR by normalizing to an input (UnFAIRE) control for each primer set and to the Scn2a1 region as a negative control. The data are the average of at least two independent experiments performed in triplicate. Standard error bars and statistical significance compared to siC undifferentiated (0hr) and differentiated (48 h) cells are shown (**P < 0.01, *P < 0.05, ANOVA).
Figure 9.
Figure 9.
SOX10 physically interacts with BRG1 and recruits BRG1 to a melanocyte-specific enhancer in Melb-a cells. (A) Growing Melb-a cells or cells that had been differentiated for 18 h and either immunoprecipitated with an irrelevant antibody (IgG) or with an antibody to SOX10 (left), antiserum to BRG1 (top, right), or BRM (bottom, right). Cell extract (CE) or the immunoprecipitated material was run on an SDS-polyacrylamide gel and blotted with the indicated antibodies. (B) Chromatin immunoprecipitations (ChIPs) were performed with an antibody to MITF or control IgG. Enrichment of the Tyrp1 distal and proximal regions was quantified by qPCR by normalizing to the IgG control for each primer set and to the Scn2a1 region as a negative control region. The data are the average of at least two independent experiments performed in triplicate. Standard error bars and statistical significance compared to undifferentiated cells (0 h) are shown (**P < 0.01, *P < 0.05, Student's t test). (C) ChIP was performed and analyzed as in B using an antibody to SOX10 or control IgG. (D–E) Undifferentiated Melb-a cells were transfected with a control siRNA or siRNAs targeting MITF or SOX10 for 48 h. The medium was then replaced by differentiation medium and cells were cultured for an additional 48 h. (D) ChIP was performed and analyzed as in B using an antibody to BRG1 or as a control to IgG. (E) ChIP was performed and analyzed as in B using an antibody to BRM or as a control to IgG. The data are the average of at least two independent experiments performed in triplicate. Standard error bars and statistical significance compared to siC undifferentiated (0 h) and differentiated (48 h) cells are shown (**P < 0.01, *P < 0.05, ANOVA).

Similar articles

Cited by

References

    1. Bolande R.P. Neurocristopathy: its growth and development in 20 years. Pediatr. Pathol. Lab. Med. 1997; 17:1–25. - PubMed
    1. Bondurand N., Dastot-Le Moal F., Stanchina L., Collot N., Baral V., Marlin S., Attie-Bitach T., Giurgea I., Skopinski L., Reardon W. et al. . Deletions at the SOX10 gene locus cause Waardenburg syndrome types 2 and 4. Am. J. Hum. Genet. 2007; 81:1169–1185. - PMC - PubMed
    1. Pingault V., Bondurand N., Kuhlbrodt K., Goerich D.E., Prehu M.O., Puliti A., Herbarth B., Hermans-Borgmeyer I., Legius E., Matthijs G. et al. . SOX10 mutations in patients with Waardenburg-Hirschsprung disease. Nat. Genet. 1998; 18:171–173. - PubMed
    1. Baldwin C.T., Hoth C.F., Amos J.A., da-Silva E.O., Milunsky A.. An exonic mutation in the HuP2 paired domain gene causes Waardenburg's syndrome. Nature. 1992; 355:637–638. - PubMed
    1. Tassabehji M., Read A.P., Newton V.E., Harris R., Balling R., Gruss P., Strachan T.. Waardenburg's syndrome patients have mutations in the human homologue of the Pax-3 paired box gene. Nature. 1992; 355:635–636. - PubMed

LinkOut - more resources