

StarBEAST2 Brings Faster Species Tree Inference and Accurate Estimates of Substitution Rates
- PMID: 28431121
- PMCID: PMC5850801
- DOI: 10.1093/molbev/msx126
StarBEAST2 Brings Faster Species Tree Inference and Accurate Estimates of Substitution Rates
Abstract
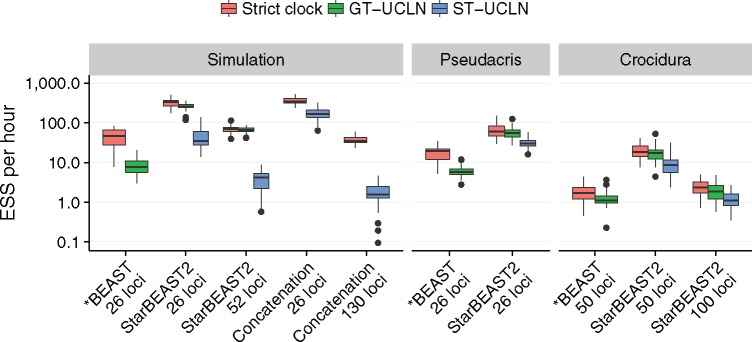
Fully Bayesian multispecies coalescent (MSC) methods like *BEAST estimate species trees from multiple sequence alignments. Today thousands of genes can be sequenced for a given study, but using that many genes with *BEAST is intractably slow. An alternative is to use heuristic methods which compromise accuracy or completeness in return for speed. A common heuristic is concatenation, which assumes that the evolutionary history of each gene tree is identical to the species tree. This is an inconsistent estimator of species tree topology, a worse estimator of divergence times, and induces spurious substitution rate variation when incomplete lineage sorting is present. Another class of heuristics directly motivated by the MSC avoids many of the pitfalls of concatenation but cannot be used to estimate divergence times. To enable fuller use of available data and more accurate inference of species tree topologies, divergence times, and substitution rates, we have developed a new version of *BEAST called StarBEAST2. To improve convergence rates we add analytical integration of population sizes, novel MCMC operators and other optimizations. Computational performance improved by 13.5× and 13.8× respectively when analyzing two empirical data sets, and an average of 33.1× across 30 simulated data sets. To enable accurate estimates of per-species substitution rates, we introduce species tree relaxed clocks, and show that StarBEAST2 is a more powerful and robust estimator of rate variation than concatenation. StarBEAST2 is available through the BEAUTi package manager in BEAST 2.4 and above.
Keywords: concatenation; incomplete lineage sorting; multispecies coalescent; phylogenetic methods; relaxed clocks; species trees.
© The Author 2017. Published by Oxford University Press on behalf of the Society for Molecular Biology and Evolution.
Figures


Similar articles
-
Computational Performance and Statistical Accuracy of *BEAST and Comparisons with Other Methods.Syst Biol. 2016 May;65(3):381-96. doi: 10.1093/sysbio/syv118. Epub 2016 Jan 28. Syst Biol. 2016. PMID: 26821913 Free PMC article.
-
StarBeast3: Adaptive Parallelized Bayesian Inference under the Multispecies Coalescent.Syst Biol. 2022 Jun 16;71(4):901-916. doi: 10.1093/sysbio/syac010. Syst Biol. 2022. PMID: 35176772 Free PMC article.
-
Coalescent-Based Analyses of Genomic Sequence Data Provide a Robust Resolution of Phylogenetic Relationships among Major Groups of Gibbons.Mol Biol Evol. 2018 Jan 1;35(1):159-179. doi: 10.1093/molbev/msx277. Mol Biol Evol. 2018. PMID: 29087487 Free PMC article.
-
Challenges in Species Tree Estimation Under the Multispecies Coalescent Model.Genetics. 2016 Dec;204(4):1353-1368. doi: 10.1534/genetics.116.190173. Genetics. 2016. PMID: 27927902 Free PMC article. Review.
-
Implementing and testing the multispecies coalescent model: A valuable paradigm for phylogenomics.Mol Phylogenet Evol. 2016 Jan;94(Pt A):447-62. doi: 10.1016/j.ympev.2015.10.027. Epub 2015 Oct 27. Mol Phylogenet Evol. 2016. PMID: 26518740 Review.
Cited by
-
A revision of the trichostrongylid nematode Cooperia Ransom, 1907, from deer game: recent integrative research confirms the existence of the ancient host-specific species Cooperia ventricosa (Rudolphi, 1809).Front Vet Sci. 2024 Feb 8;11:1346417. doi: 10.3389/fvets.2024.1346417. eCollection 2024. Front Vet Sci. 2024. PMID: 38389582 Free PMC article.
-
Ranked Subtree Prune and Regraft.Bull Math Biol. 2024 Jan 31;86(3):24. doi: 10.1007/s11538-023-01244-2. Bull Math Biol. 2024. PMID: 38294587 Free PMC article.
-
Statistically consistent divide-and-conquer pipelines for phylogeny estimation using NJMerge.Algorithms Mol Biol. 2019 Jul 19;14:14. doi: 10.1186/s13015-019-0151-x. eCollection 2019. Algorithms Mol Biol. 2019. PMID: 31360216 Free PMC article.
-
Embracing heterogeneity: coalescing the Tree of Life and the future of phylogenomics.PeerJ. 2019 Feb 14;7:e6399. doi: 10.7717/peerj.6399. eCollection 2019. PeerJ. 2019. PMID: 30783571 Free PMC article.
-
PhyloAcc-GT: A Bayesian Method for Inferring Patterns of Substitution Rate Shifts on Targeted Lineages Accounting for Gene Tree Discordance.Mol Biol Evol. 2023 Sep 1;40(9):msad195. doi: 10.1093/molbev/msad195. Mol Biol Evol. 2023. PMID: 37665177 Free PMC article.
References
-
- Andrieu C, Thoms J.. 2008. A tutorial on adaptive MCMC. Stat Comput. 184:343–373.
-
- Arbogast BS, Edwards SV, Wakeley J, Beerli P, Slowinski JB.. 2002. Estimating divergence times from molecular data on phylogenetic and population genetic timescales. Annu Rev Ecol Syst. 33:707–740.
-
- Baer CF, Miyamoto MM, Denver DR.. 2007. Mutation rate variation in multicellular eukaryotes: causes and consequences. Nat Rev Genet. 88:619–631. - PubMed
-
- Barrow LN, Ralicki HF, Emme SA, Lemmon EM.. 2014. Species tree estimation of North American chorus frogs (Hylidae: Pseudacris) with parallel tagged amplicon sequencing. Mol Phylogenet Evol. 75:78–90. - PubMed
Publication types
MeSH terms
LinkOut - more resources
Full Text Sources
Other Literature Sources
