. 2017 Jul 1;26(13):2493-2506.
doi: 10.1093/hmg/ddx144.

Respiratory chain enzyme deficiency induces mitochondrial location of actin-binding gelsolin to modulate the oligomerization of VDAC complexes and cell survival

Affiliations

Respiratory chain enzyme deficiency induces mitochondrial location of actin-binding gelsolin to modulate the oligomerization of VDAC complexes and cell survival

Alberto García-Bartolomé et al. Hum Mol Genet. .

Abstract

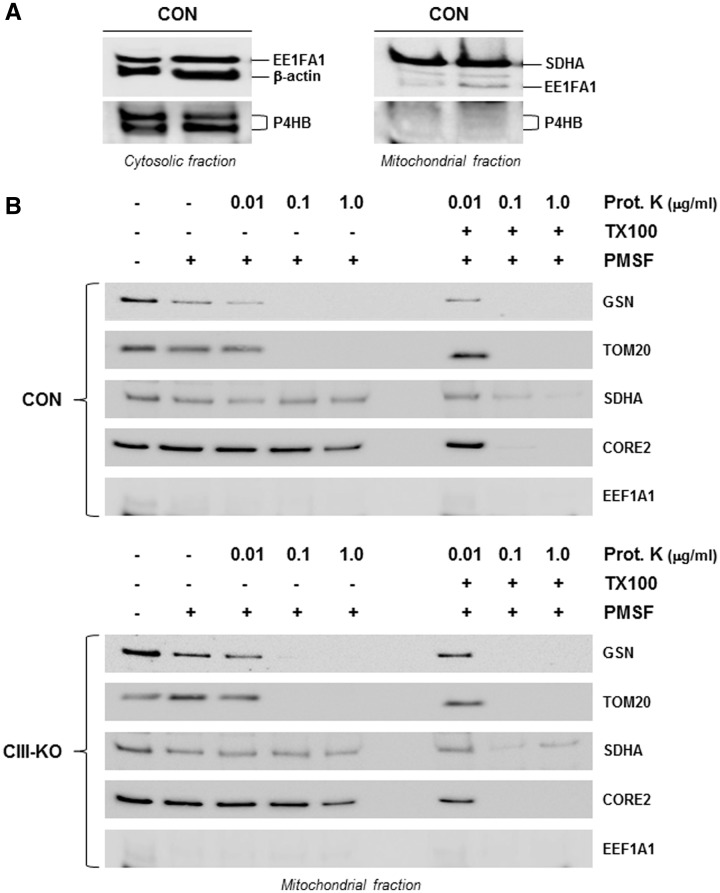
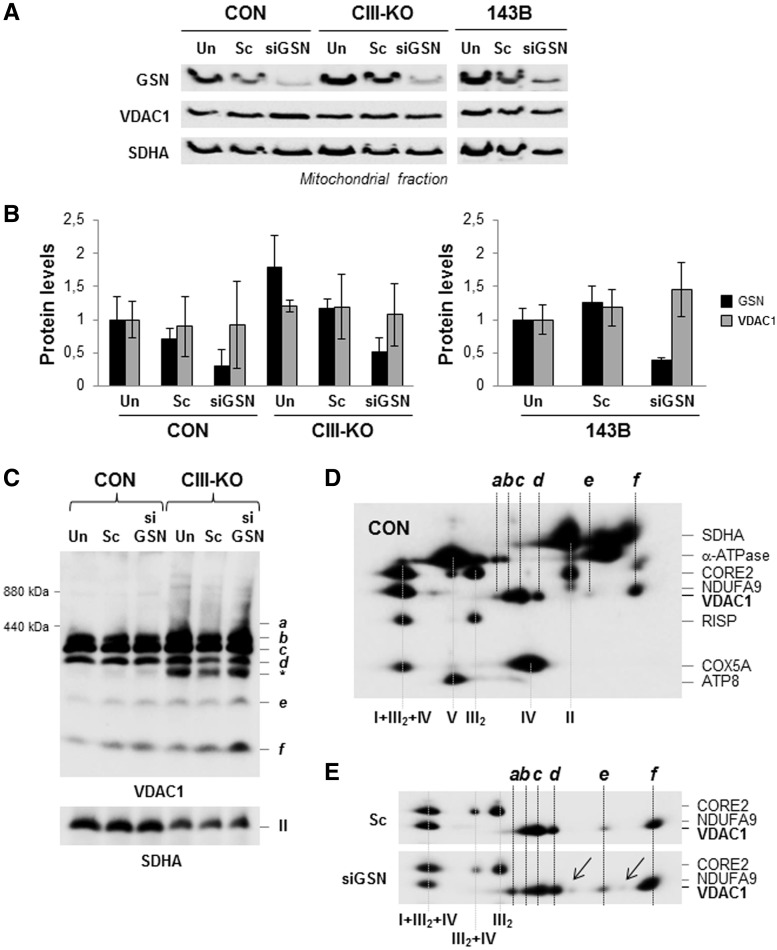
Despite considerable knowledge on the genetic basis of mitochondrial disorders, their pathophysiological consequences remain poorly understood. We previously used two-dimensional difference gel electrophoresis analyses to define a protein profile characteristic for respiratory chain complex III-deficiency that included a significant overexpression of cytosolic gelsolin (GSN), a cytoskeletal protein that regulates the severing and capping of the actin filaments. Biochemical and immunofluorescence assays confirmed a specific increase of GSN levels in the mitochondria from patients' fibroblasts and from transmitochondrial cybrids with complex III assembly defects. A similar effect was obtained in control cells upon treatment with antimycin A in a dose-dependent manner, showing that the enzymatic inhibition of complex III is sufficient to promote the mitochondrial localization of GSN. Mitochondrial subfractionation showed the localization of GSN to the mitochondrial outer membrane, where it interacts with the voltage-dependent anion channel protein 1 (VDAC1). In control cells, VDAC1 was present in five stable oligomeric complexes, which showed increased levels and a modified distribution pattern in the complex III-deficient cybrids. Downregulation of GSN expression induced cell death in both cell types, in parallel with the specific accumulation of VDAC1 dimers and the release of mitochondrial cytochrome c into the cytosol, indicating a role for GSN in the oligomerization of VDAC complexes and in the prevention of apoptosis. Our results demonstrate that respiratory chain complex III dysfunction induces the physiological upregulation and mitochondrial location of GSN, probably to promote cell survival responses through the modulation of the oligomeric state of the VDAC complexes.


Figures

Figure 1
Figure 1
The levels of cytosolic GSN are increased in the mitochondria from complex III-deficient fibroblasts with mutations in BCS1L. (A) Representative differential expression pattern of GSN between control (CON) and BCS1L mutant fibroblasts (PAT). Four protein species corresponding to cytosolic GSN (originally labelled as 257, 262, 263 and 279) were detected by 2D-DIGE and mass-spectrometry analyses. The fluorescent signals of each dot on the 2D-DIGE gels were quantified using the DeCyder software and represented as a 3D plot graph. (B) Ten micrograms of protein extracts from whole cell lysates and cytosolic fractions, and 30 μg of isolated mitochondria, were separated on 10% SDS-PAGE gels and analysed by western blot with antibodies that recognize GSN, β-actin (used as a loading control for the whole-cell and cytosolic fractions), and the SDHA subunit of respiratory chain complex II (loading control for the mitochondrial fractions). Quantitative changes in band intensities between controls (C1, C2) and patientś fibroblasts (P1–P4) were evaluated by densitometric scanning with the ImageJ software. The signals from at least three independent experiments per fraction were quantified, and normalized by their respective loading controls. Data are presented as the mean ± SD of the values obtained from the patients' fibroblasts relative to the mean control values, set as 1. Mann–Whitney U test: *P < 0.05 for patients versus controls. (C) Double immunofluorescence to detect GSN (green) and the mitochondrial marker VDAC1 (red) in controls (C1 and C2) and patients’ fibroblasts with mutations in BCS1L (P1–P4). Images were taken with a × 63 Plan-Apochromat objective in slices of 0.5 μm. Co-localized pixels (colocal.) are shown in white. Enlarged sections of the co-localization images (delimited by a white square) are shown in the lowest panels. Scale bar = 20 μm.
Figure 2
Figure 2
The levels of cytosolic GSN are increased in the mitochondria from antimycin A-treated fibroblasts. Control fibroblasts (CON) were cultured for 48 h in the presence of 2, 20, 200 and 500 nM of antimycin A (AA). Cells were collected, and (A) the enzyme activities of the mitochondrial respiratory chain complexes II–IV (CII–CIV) were measured. Enzyme activities are expressed as the percentages relative to untreated cells of *cU/U citrate synthase (CS), where CS activity was calculated as mU/mg protein. (B) Sixty micrograms of mitochondrial protein from antimycin A-treated control fibroblasts were extracted with a digitonin:protein ratio of 4 g/g and analysed by BN-PAGE in combination with complex I in-gel activity (CI-IGA) assay, or alternatively, with western blot and immunodetection of the complex II SDHA subunit, used as a loading control. (C) Fifteen micrograms of protein extracts from whole cell lysates and isolated mitochondria were separated on 10% SDS-PAGE gels. GSN levels were analysed by western blot, using β-actin and SDHA as loading controls for the whole-cell lysates and the mitochondrial fractions, respectively. The signals from four independent experiments per fraction were quantified, and normalized by their respective loading controls. Data are presented as the mean ± SD of the values obtained from the antimycin A-treated fibroblasts relative to the untreated cells. Mann–Whitney U test: *P < 0.05 for treated versus untreated cells. (D) Double immunofluorescence to detect GSN (green) and the mitochondrial marker VDAC1 (red) in untreated cells (CON) and control fibroblasts incubated with increasing concentrations of antimycin A (2, 20, 200 and 500 nM). Images were taken with a × 63 Plan-Apochromat objective in slices of 0.5 μm, and magnified with a × 2 confocal zoom. Co-localized pixels (colocal.) are shown in white. Enlarged sections of the co-localization images (delimited by a white square) are shown in the lowest panels; see also Supplementary Material, Figure S1.
Figure 3
Figure 3
The levels of cytosolic GSN are increased in the mitochondria from complex III-deficient cybrids. (A) Control 143B TK cells were cultured for 24 and 48 h in the presence of 2, 20, 200 and 500 nM of antimycin A (AA). Cells were collected and 15 μg of mitochondrial protein extracts were separated on 10% SDS-PAGE gels. GSN levels were analysed by western blot, using SDHA as a loading control. The signals from six independent experiments were quantified, normalized by SDHA, and data are presented as the mean ± SD relative to the control values, set as 1. Mann–Whitney U test: *P < 0.05 and ***P < 0.001 for mutants versus controls. (B) Fifteen micrograms of protein extracts from whole-cell lysates and isolated mitochondria from control (CON) and mutant (CIII-KO) cybrids were separated on 10% SDS-PAGE gels. GSN levels were analysed by western blot, using β-actin and SDHA as loading controls for the whole-cell lysates and the mitochondrial fractions, respectively. The signals from four independent experiments per fraction were quantified, normalized by their respective loading controls, and data are presented as the mean ± SD relative to the control values, set as 1. Mann–Whitney U test: *P < 0.05 and ***P < 0.001 for mutants versus cntrols. (C) Control cybrids (CON) were cultured for 48 h in the presence of 2, 20, 200 and 500 nM of antimycin A. Antimycin A-treated and CIII-KO cybrids were processed as in (A) and GSN levels were analysed by western blot, using SDHA as a loading control. The signals from two independent experiments were quantified, normalized by SDHA, and data are presented as the mean ± range relative to the untreated control values, set as 1. Mann–Whitney U test: ***P < 0.001 for mutants versus controls; see also Supplementary Material, Figure S2.
Figure 4
Figure 4
GSN localizes to the mitochondrial outer membrane. (A) Fifteen micrograms of protein extracts from cytosolic fractions and isolated mitochondria from control cybrids were separated on 10% SDS-PAGE gels. In order to rule out the presence of cytosolic contamination in the mitochondrial fractions, the levels of the translation elongation factor EEF1A1 (50.1 kDa), and of the endoplasmic reticulum protein P4HB (precursor of 57.1 kDa, mature processed form of 55.3 kDa) were analysed by western blot relative to β-actin (41.7 kDa) and SDHA (72.7 kDa), respectively, used as markers for the cytosol and mitochondria. (B) Mitochondria purified from control (CON) and mutant (CIII-KO) cybrids were treated (+) or not (−) with the protease inhibitor phenylmethylsulfonyl fluoride (PMSF) and 1% Triton X-100 (TX100), together with increasing concentrations of Proteinase K (ranging between 0.01 and 1 μg/ml). Fifteen micrograms of mitochondrial protein were separated on 10% SDS-PAGE gels, and the mitochondrial location of GSN was analysed by western blot, using TOM20 as a marker for the outer membrane, CORE2 and SDHA as markers for the mitochondrial inner membrane and matrix, and EEF1A1 as a control for cytosolic contamination.
Figure 5
Figure 5
GSN interacts with VDAC1. GSN co-immunoprecipitation assays in cybrids. (A) Isolated mitochondrial extracts from control (CON) and mutant (CIII-KO) cybrids were immuno-precipitated using an antibody against GSN. (B) The same samples were immuno-precipitated using an antibody against VDAC1. Samples were subsequently analysed by SDS-PAGE and western blot with the indicated antibodies. ML, mitochondrial lysate; IP, immunoprecipitate; SN, supernatant (unbound fraction or flow-through).
Figure 6
Figure 6
GSN down regulation induces the oligomerization of VDAC complexes without affecting OXPHOS structures. (A) Silencing assays were performed with a mix of two GSN siRNAs in control cybrids (CON), in mutant cybrids lacking complex III (CIII-KO) and in control 143B TK cells. Upon two rounds of transfection and silencing for 48 h, mitochondria were isolated from untransfected (Un), mock-transfected (Sc), and GSN siRNA-transfected (siGSN) cybrids. GSN and VDAC1 levels were analysed by SDS-PAGE and western blot, using SDHA as a loading control. (B) The optical densities of the immunoreactive bands for GSN were quantified, normalized by SDHA, and presented as means ± SD of the values obtained from three independent siRNA experiments. Values are expressed relative to the untransfected control cybrids (Un). (C) Mitochondria were extracted from CIII-KO mutant cybrids and their isogenic controls (CON) with 4 g/g digitonin-to-protein ratio. The effect of GSN knockdown on the assembly of VDAC1 complexes (af) was investigated by BN-PAGE, followed by western blot and immunodetection with the VDAC1 antibody. Asterisk indicates the accumulation of a specific VDAC1 complex in the mutant cybrids. (D) The distribution pattern of VDAC1-containing complexes (a-f) relative to OXPHOS structures was analysed in control cybrids (CON) by 2D-BN/SDS-PAGE and western blot with antibodies against VDAC1, the complex I subunit NDUFA9, the complex II subunit SDHA, the complex III subunits CORE2 and RISP, the complex IV subunit COX5A, and the complex V subunits α-ATPase and ATP8. (E) The effect of GSN knockdown on the assembly of VDAC1 complexes was investigated in control 143B TK cells by 2D-BN/SDS-PAGE, followed by western blot and immunodetection with the indicated antibodies. Arrows indicate the specific accumulation of VDAC1 complexes in the GSN siRNA-transfected cells; see also Supplementary Material, Figure S3.
Figure 7
Figure 7
GSN down regulation induces cytochrome c release and apoptotic cell death. (A) The effect of GSN knockdown on cytochrome c release was investigated in control cybrids (CON) as well as in mutant cybrids lacking complex III (CIII-KO). Fifteen micrograms of cytosolic protein from untransfected (Un), mock-transfected (Sc), and GSN siRNA-transfected (siGSN) cybrids were separated on 10% SDS-PAGE gels and analysed by western blot and immunodetection with the indicated antibodies. (B) Effect of GSN knockdown on cell survival. Control and CIII-KO cybrids were transfected with GSN or scramble (Sc) siRNAs and were incubated for 24 h in glucose-containing media. Transfected cells were then plated on P12 plates at 3×10⁴ cells per plate and counted on a daily basis for 3 days. Each data point represents the mean ± SD of the values obtained from at least two independent analyses per cell line, each with two experimental replicates. (C) Increased apoptotic cell death was observed by epifluorescence TUNEL assay in cybrids transfected with GSN siRNAs. Transmitted light images are shown on the left and TUNEL images on the right of each panel. Images were taken with a Zeiss LD A-Plan 20×/0.35 Ph1 objective. Unlabelled, negative control. DNAseI, positive control after 10-min incubation with 10 units/mL DNAse I. (D) Apoptotic nuclei from two independent TUNEL analyses were quantified after the examination of at least 103 cells from each experimental condition. Data are expressed as the mean ± SD of the values obtained from cells transfected with GSN siRNA (siGSN) relative to the scrambled control (Sc) values, set as 1. (E) Control cybrids (CON) were cultured for 48 h in the presence of 2, 20, 200 and 500 nM of antimycin A (AA). Antimycin A-treated and CIII-KO cybrids were collected, cytoplasmic fractions were isolated and 15 μg of cytosolic protein extracts were separated on 10% SDS-PAGE gels. GSN and cytochrome c levels were analysed by western blot, using β-actin as a loading control.

Similar articles

Cited by

References

    1. Baum H., Rieske J.S., Silman H.I., Lipton S.H. (1967) On the mechanism of electron transfer in complex III of the electron transfer chain. Proc. Natl. Acad. Sci. U. S. A., 57, 798–805. - PMC - PubMed
    1. Iwata S., Lee J.W., Okada K., Lee J.K., Iwata M., Rasmussen B., Link T.A., Ramaswamy S., Jap B.K. (1998) Complete structure of the 11-subunit bovine mitochondrial cytochrome bc1 complex. Science, 281, 64–71. - PubMed
    1. Xia D., Yu C.A., Kim H., Xia J.Z., Kachurin A.M., Zhang L., Yu L., Deisenhofer J. (1997) Crystal structure of the cytochrome bc1 complex from bovine heart mitochondria. Science, 277, 60–66. - PubMed
    1. Bénit P., Lebon S., Rustin P. (2009) Respiratory-chain diseases related to complex III deficiency. Biochim. Biophys. Acta, 1793, 181–185. - PubMed
    1. Fernández-Vizarra E., Zeviani M. (2015) Nuclear gene mutations as the cause of mitochondrial complex III deficiency. Front. Genet., 6, 134.. - PMC - PubMed

Publication types

MeSH terms