

Loss of Tpm4.1 leads to disruption of cell-cell adhesions and invasive behavior in breast epithelial cells via increased Rac1 signaling
- PMID: 28431393
- PMCID: PMC5464889
- DOI: 10.18632/oncotarget.16825
Loss of Tpm4.1 leads to disruption of cell-cell adhesions and invasive behavior in breast epithelial cells via increased Rac1 signaling
Abstract
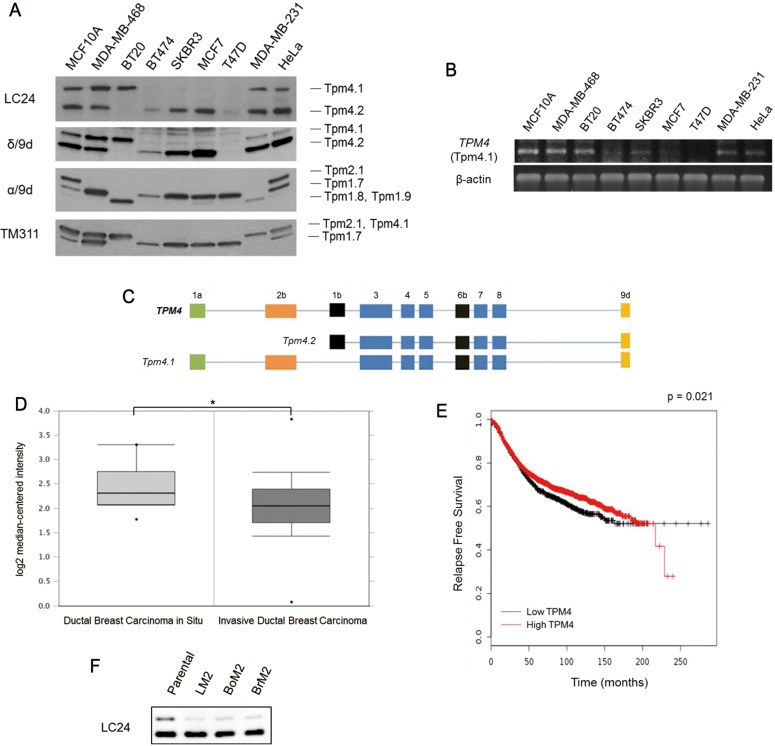
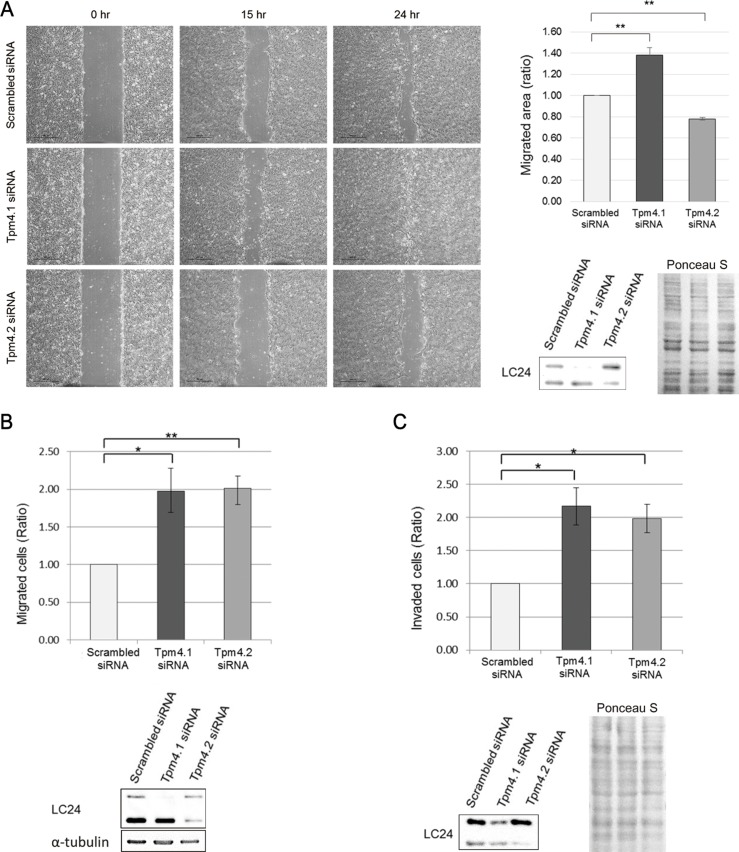
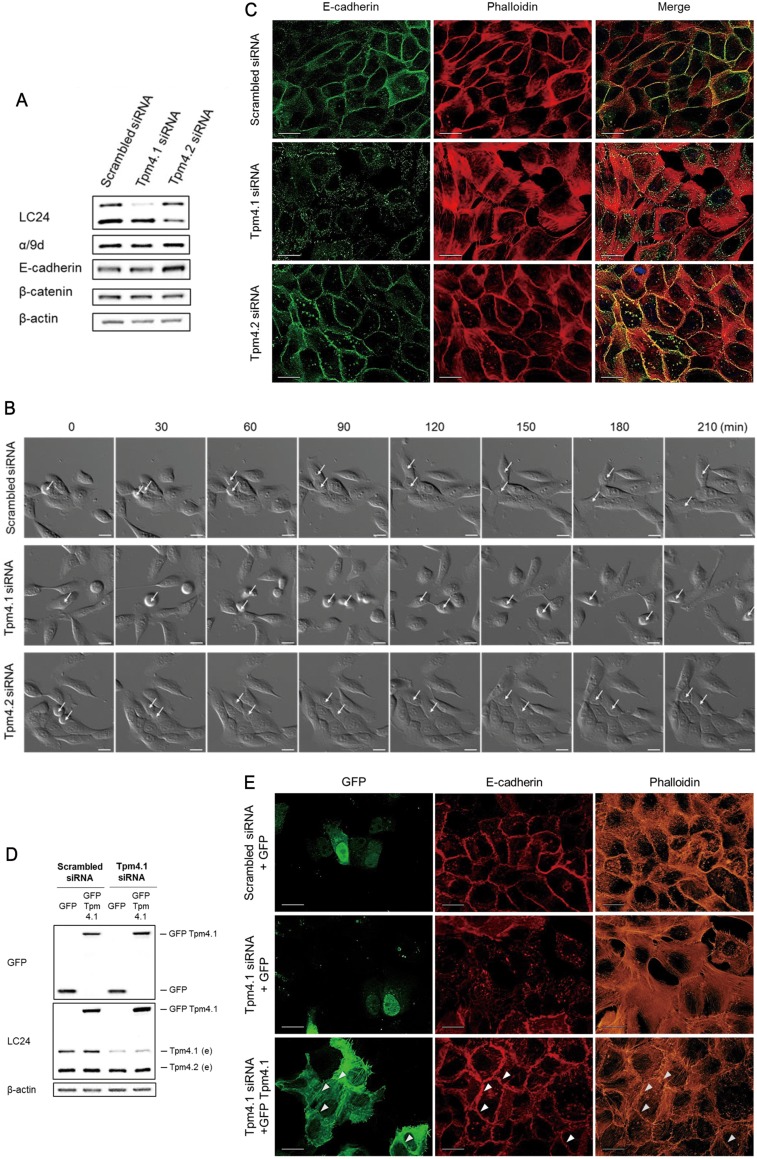
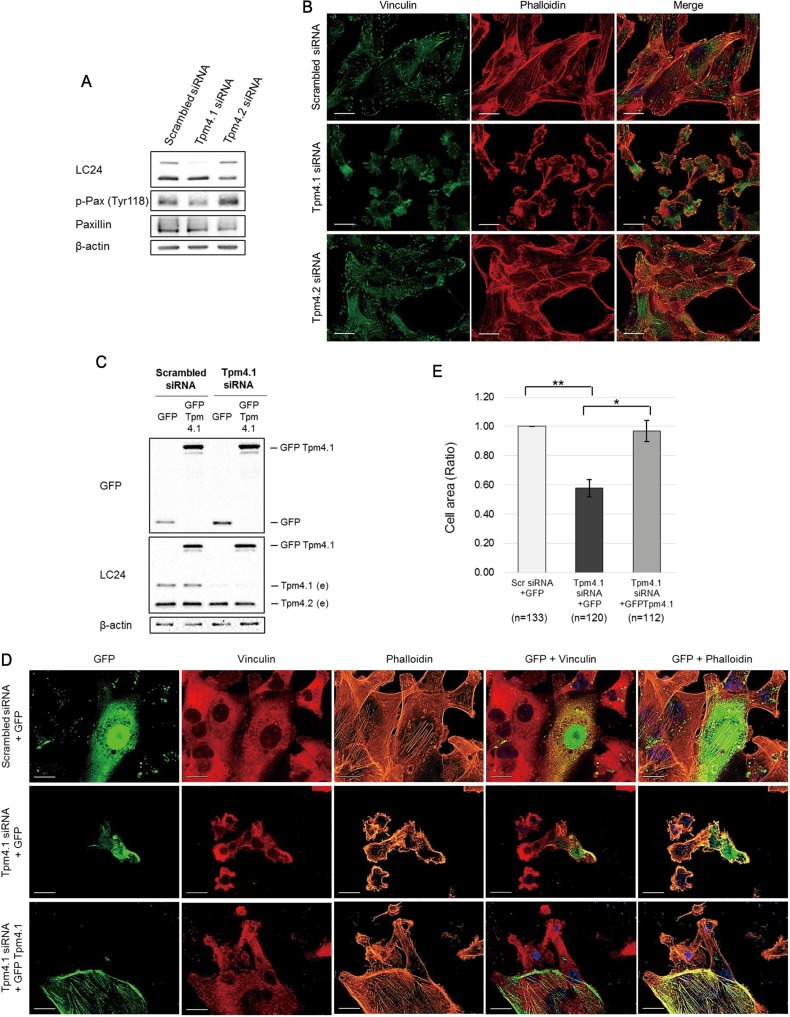
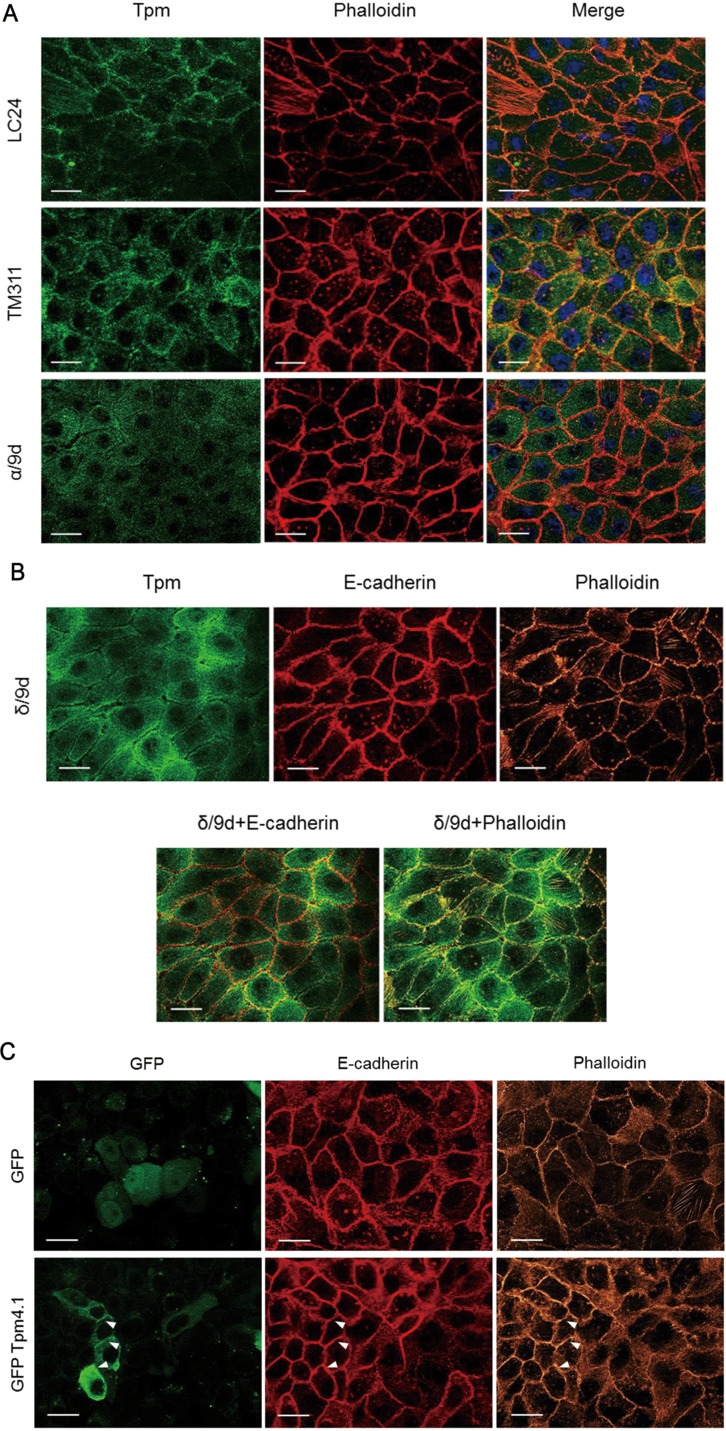
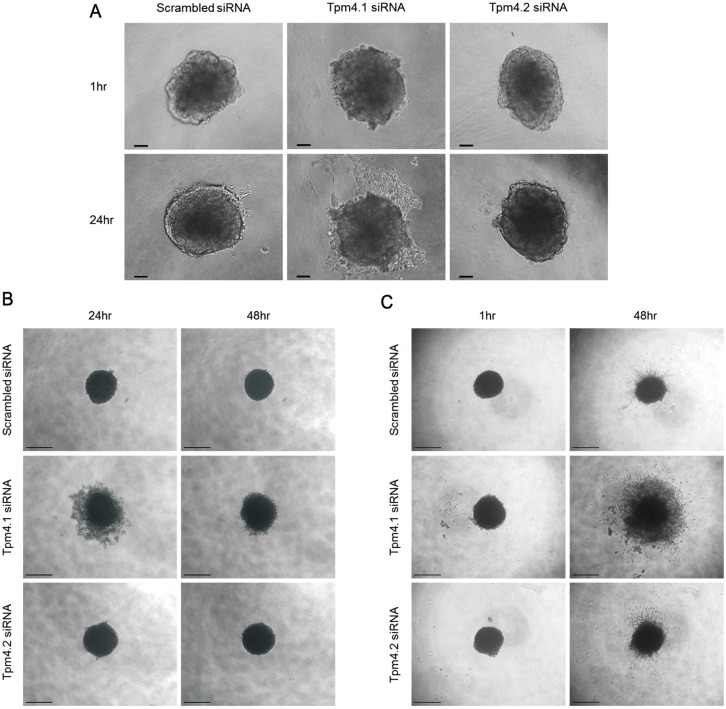
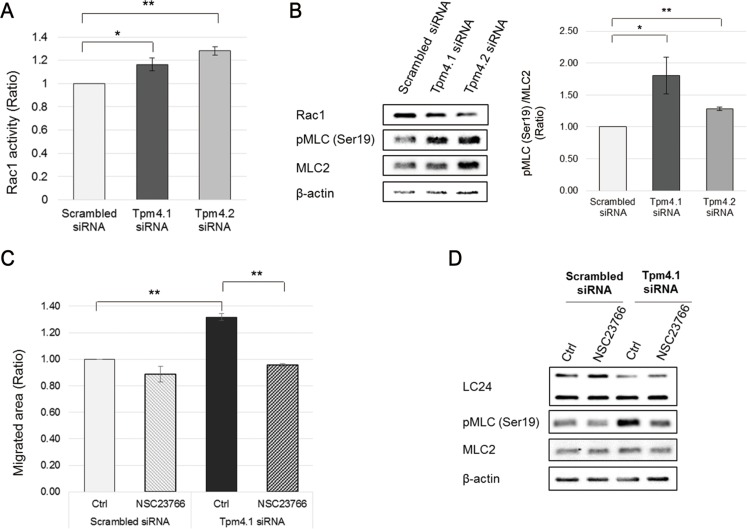
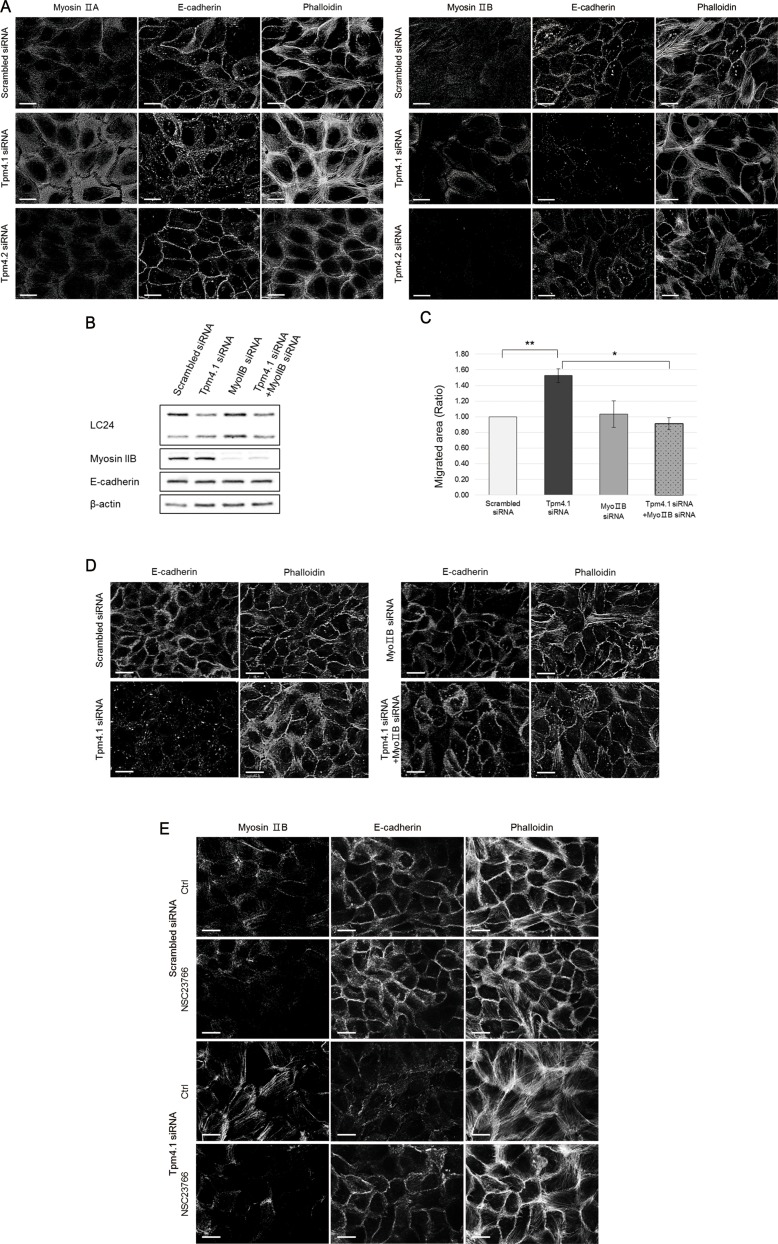
Here we report the identification and characterization of a novel high molecular weight isoform of tropomyosin, Tpm4.1, expressed from the human TPM4 gene. Tpm4.1 expression is down-regulated in a subset of breast cancer cells compared with untransformed MCF10A breast epithelial cells and in highly metastatic breast cancer cell lines derived from poorly metastatic MDA-MD-231 cells. In addition, patients with invasive ductal breast carcinoma show decreased TPM4 expression compared with patients with ductal breast carcinoma in situ, and low TPM4 expression is associated with poor prognosis. Loss of Tpm4.1 using siRNA in MCF10A cells increases cell migration in wound-healing and Boyden chamber assays and invasion out of spheroids as well as disruption of cell-cell adhesions. Down-regulation of Tpm4.1 in MDA-MB-231 cells leads to disruption of actin organization and increased cell invasion and dissemination from spheroids into collagen gels. The down-regulation of Tpm4.1 induces Rac1-mediated alteration of myosin IIB localization, and pharmacologic inhibition of Rac1 or down-regulation of myosin IIB using siRNA inhibits the invasive phenotypes in MCF10A cells. Thus Tpm4.1 plays an important role in blocking invasive behaviors through Rac1-myosin IIB signaling and our findings suggest that decreased expression of Tpm4.1 might play a crucial role during tumor progression.
Keywords: TPM4; cell adhesions; invasion; migration; tropomyosin.
Conflict of interest statement
SukYeong Jeong, SunYoung Lim, Galina Schevzov, and David M. Helfman disclose no potential conflicts of interest. Peter W. Gunning is a member of the Board of Novogen, a company that is commercializing the use of anti-tropomyosin drugs to treat cancer.
Figures
Similar articles
-
Loss of MLCK leads to disruption of cell-cell adhesion and invasive behavior of breast epithelial cells via increased expression of EGFR and ERK/JNK signaling.Oncogene. 2016 Aug 25;35(34):4495-508. doi: 10.1038/onc.2015.508. Epub 2016 Feb 15. Oncogene. 2016. PMID: 26876209
-
The Na+-H+ exchanger-1 induces cytoskeletal changes involving reciprocal RhoA and Rac1 signaling, resulting in motility and invasion in MDA-MB-435 cells.Breast Cancer Res. 2004;6(6):R616-28. doi: 10.1186/bcr922. Epub 2004 Sep 13. Breast Cancer Res. 2004. PMID: 15535843 Free PMC article.
-
Involvement of Rho GAP GRAF1 in maintenance of epithelial phenotype.Cell Adh Migr. 2017 Jul 4;11(4):367-383. doi: 10.1080/19336918.2016.1227910. Epub 2016 Sep 2. Cell Adh Migr. 2017. PMID: 27588930 Free PMC article.
-
Positive regulation of migration and invasion by vasodilator-stimulated phosphoprotein via Rac1 pathway in human breast cancer cells.Oncol Rep. 2008 Oct;20(4):929-39. Oncol Rep. 2008. PMID: 18813837
-
H-Ras-specific upregulation of granulocyte colony-stimulating factor promotes human breast cell invasion via matrix metalloproteinase-2.Cytokine. 2011 Jul;55(1):126-33. doi: 10.1016/j.cyto.2011.03.002. Epub 2011 Apr 27. Cytokine. 2011. PMID: 21524920
Cited by
-
Precision Targeting of Endogenous Epidermal Growth Factor Receptor (EGFR) by Structurally Aligned Dual-Modifier Labeling.ACS Pharmacol Transl Sci. 2022 Sep 19;5(10):859-871. doi: 10.1021/acsptsci.2c00155. eCollection 2022 Oct 14. ACS Pharmacol Transl Sci. 2022. PMID: 36268127 Free PMC article.
-
The miR-133a, TPM4 and TAp63γ Role in Myocyte Differentiation Microfilament Remodelling and Colon Cancer Progression.Int J Mol Sci. 2021 Sep 10;22(18):9818. doi: 10.3390/ijms22189818. Int J Mol Sci. 2021. PMID: 34575979 Free PMC article.
-
Characterizing isoform switching events in esophageal adenocarcinoma.Mol Ther Nucleic Acids. 2022 Aug 17;29:749-768. doi: 10.1016/j.omtn.2022.08.018. eCollection 2022 Sep 13. Mol Ther Nucleic Acids. 2022. PMID: 36090744 Free PMC article.
-
Comprehensive profiling of migratory primordial germ cells reveals niche-specific differences in non-canonical Wnt and Nodal-Lefty signaling in anterior vs posterior migrants.bioRxiv [Preprint]. 2025 Jun 2:2024.08.29.610420. doi: 10.1101/2024.08.29.610420. bioRxiv. 2025. PMID: 39257761 Free PMC article. Preprint.
-
Tropomyosin isoform Tpm2.1 regulates collective and amoeboid cell migration and cell aggregation in breast epithelial cells.Oncotarget. 2017 Jul 12;8(56):95192-95205. doi: 10.18632/oncotarget.19182. eCollection 2017 Nov 10. Oncotarget. 2017. PMID: 29221121 Free PMC article.
References
-
- Lin JJC, Eppinga RD, Warren KS, McCrae KR. Human tropomyosin isoforms in the regulation of cytoskeleton functions. Adv Exp Med Biol. 2008;644:201–22. - PubMed
-
- Tojkander S, Gateva G, Schevzov G, Hotulainen P, Naumanen P, Martin C, Gunning PW, Lappalainen P. A molecular pathway for myosin II recruitment to stress fibers. Curr Biol. 2011;21:539–50. - PubMed
-
- Gunning P, O’neill G, Hardeman E. Tropomyosin-based regulation of the actin cytoskeleton in time and space. Physiol Rev. 2008;88:1–35. - PubMed
-
- Choi C, Kim D, Kim S, Jeong S, Song E, Helfman DM. From skeletal muscle to cancer: insights learned elucidating the function of tropomyosin. J Struct Biol. 2012;177:63–9. - PubMed
MeSH terms
Substances
LinkOut - more resources
Full Text Sources
Other Literature Sources
Medical
Molecular Biology Databases
Research Materials
Miscellaneous
