. 2017 Jun 5;216(6):1795-1810.
doi: 10.1083/jcb.201608095. Epub 2017 Apr 21.

NPM1 directs PIDDosome-dependent caspase-2 activation in the nucleolus

Affiliations

NPM1 directs PIDDosome-dependent caspase-2 activation in the nucleolus

Kiyohiro Ando et al. J Cell Biol. .

Abstract

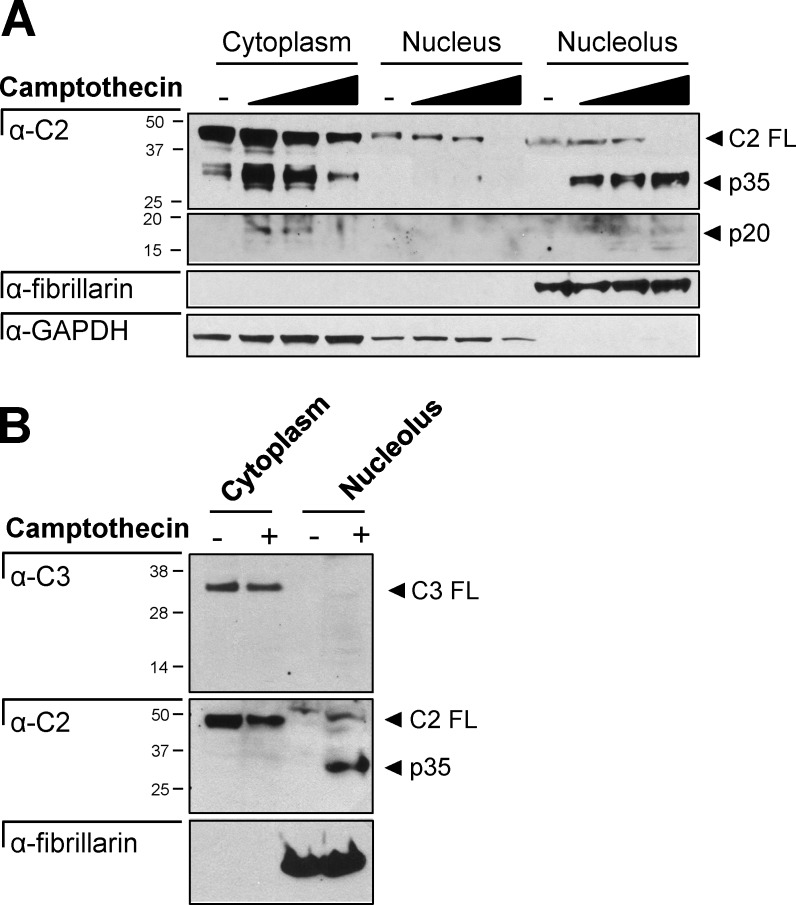
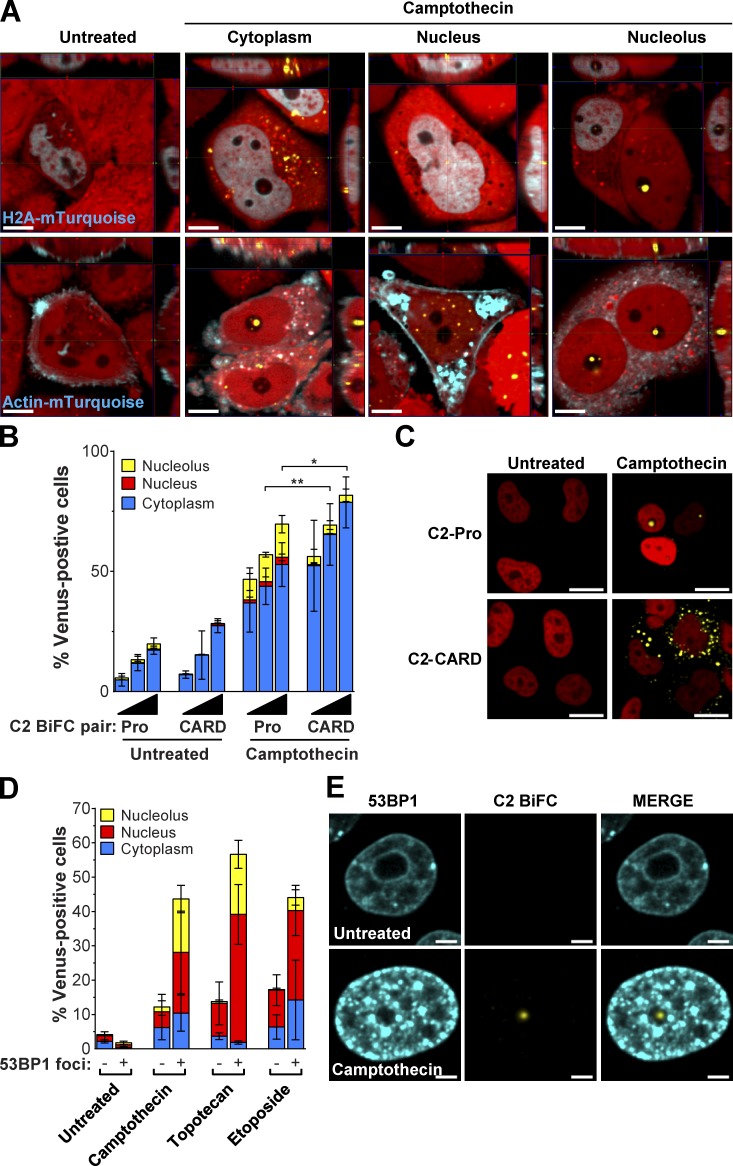
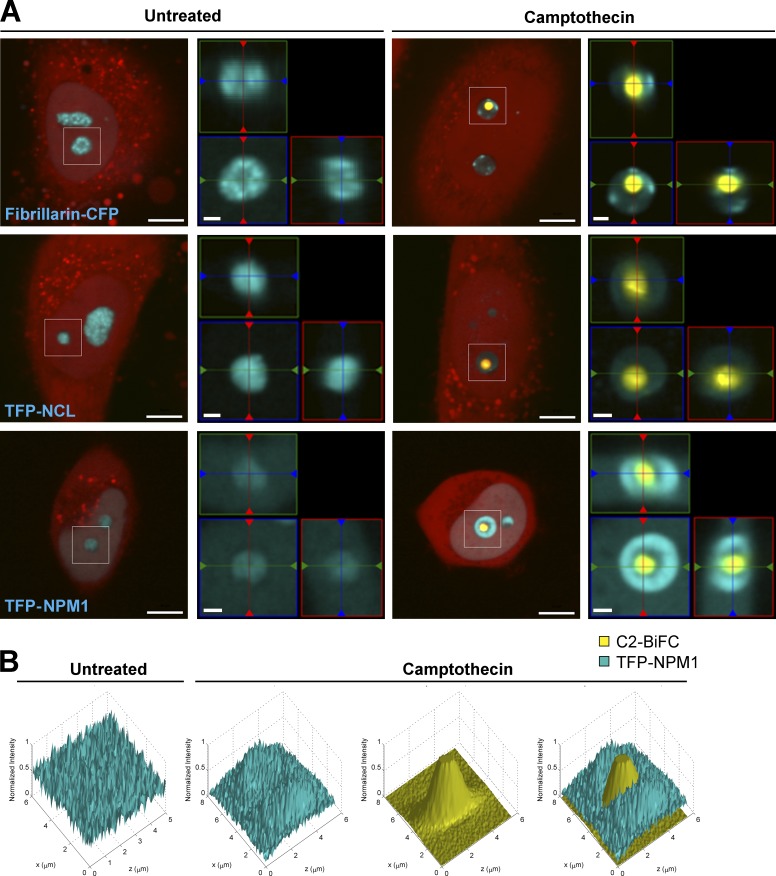
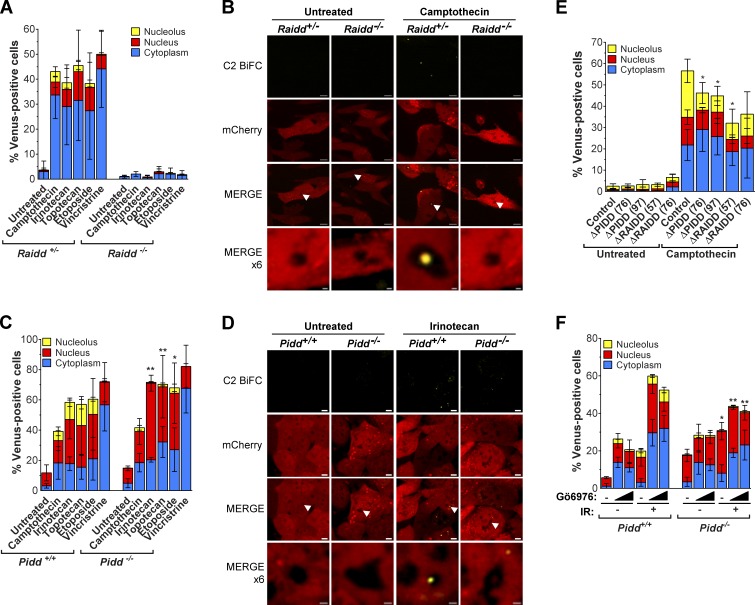
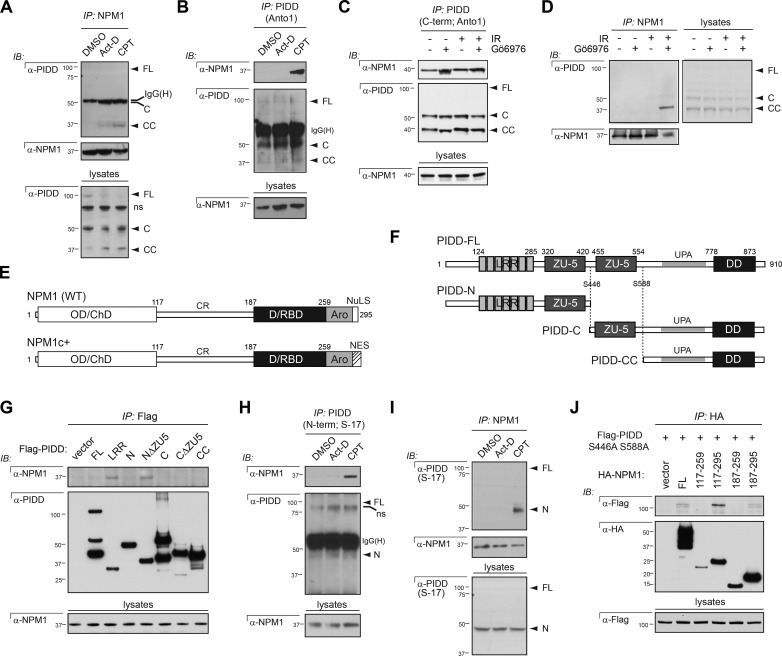
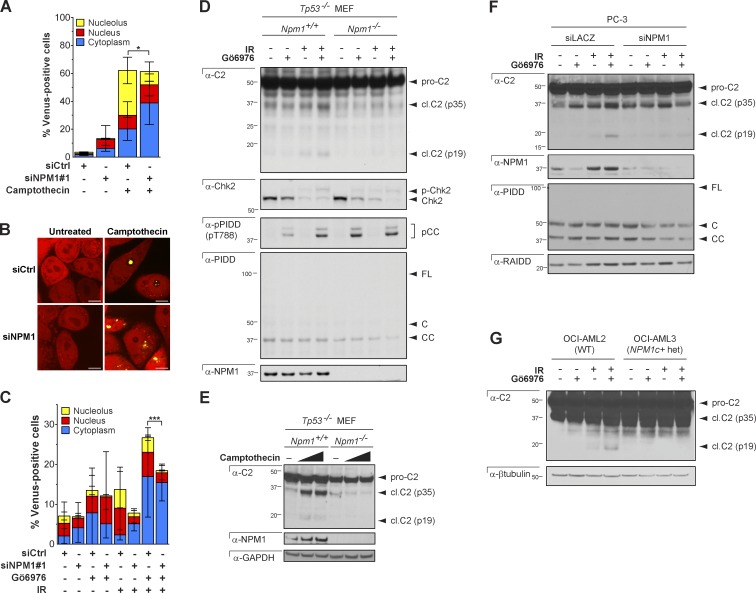
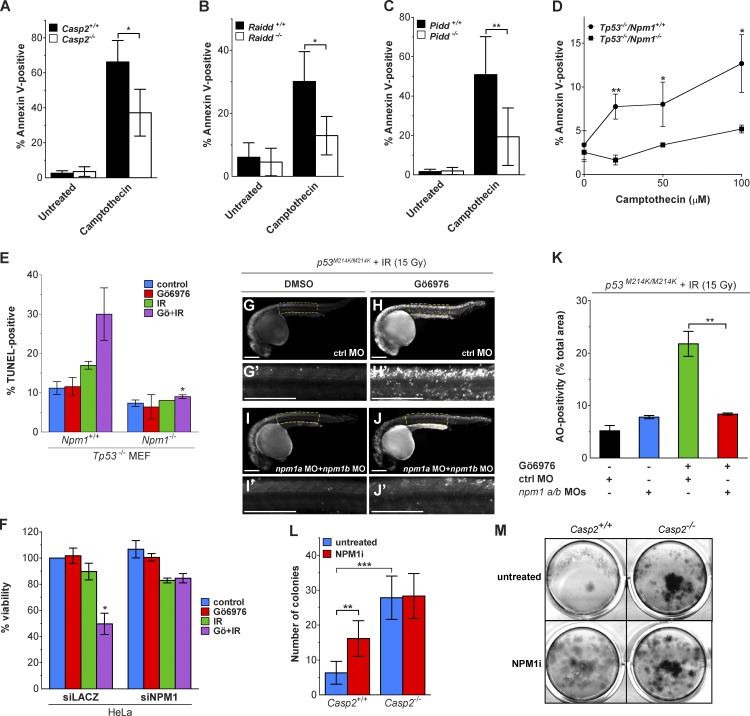
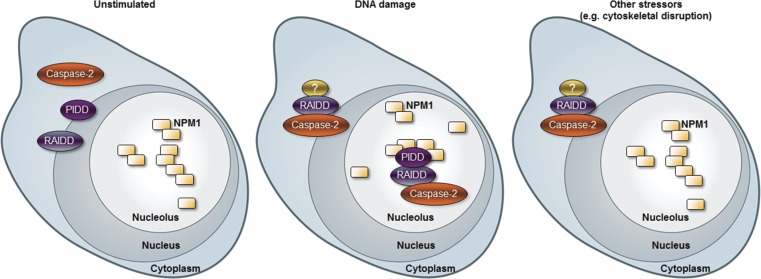
The PIDDosome (PIDD-RAIDD-caspase-2 complex) is considered to be the primary signaling platform for caspase-2 activation in response to genotoxic stress. Yet studies of PIDD-deficient mice show that caspase-2 activation can proceed in the absence of PIDD. Here we show that DNA damage induces the assembly of at least two distinct activation platforms for caspase-2: a cytoplasmic platform that is RAIDD dependent but PIDD independent, and a nucleolar platform that requires both PIDD and RAIDD. Furthermore, the nucleolar phosphoprotein nucleophosmin (NPM1) acts as a scaffold for PIDD and is essential for PIDDosome assembly in the nucleolus after DNA damage. Inhibition of NPM1 impairs caspase-2 processing, apoptosis, and caspase-2-dependent inhibition of cell growth, demonstrating that the NPM1-dependent nucleolar PIDDosome is a key initiator of the caspase-2 activation cascade. Thus we have identified the nucleolus as a novel site for caspase-2 activation and function.


Figures

Figure 1.
Figure 1.
DNA-damaging agents induce caspase-2 BiFC in the nucleolus. (A) HeLa cells transfected with C2-Pro VC (20 ng), C2-Pro VN (20 ng), and dsRed-mito as a transfection reporter (10 ng) were treated with camptothecin (100 µM), irinotecan (100 µM), topotecan (100 µM), etoposide (100 µM), actinomycin D (1 µM), taxol (10 µg/ml), or vincristine (10 µM) plus qVD-OPH (20 µM) to prevent cell detachment caused by apoptosis. Cells were assessed for the percentage of dsRed-positive transfected cells that were Venus+ at 24 h, determined from at least 30 microscopy images per well. Results are the mean of three independent experiments ± SD. *, P < 0.05; **, P < 0.005 compared with untreated sample. (B) Schematic representation of caspase-2 structure and BiFC constructs. Constructs containing the caspase-2 prodomain (C2 Pro) are shown, each fused to the C- or N-terminal fragment of Venus. The bicistronic construct consists of C2 Pro-VC and C2 Pro-VN linked by a 2A self-cleaving peptide. (C) HeLa cells stably expressing C2 Pro-VC-2A-C2 Pro-VN-2A-mCherry (HeLa.C2 Pro-BiFC; parent) were single-cell cloned (clone), and each was treated with the indicated drugs (100 µM) plus qVD-OPH (20 µM). After 24 and 48 h, the percentage of mCherry-positive cells that were Venus+ was determined from at least 30 microscopy images per well. Results are the mean of three independent experiments ± SD. *, P < 0.05; **, P < 0.005; ***, P < 0.0005 compared with the untreated sample in each group. (D) HeLa.C2 Pro-BiFC cells transfected with fibrillarin-CFP were treated with camptothecin (100 µM), irinotecan (100 µM), topotecan (100 µM), etoposide (100 µM), or vincristine (10 µM) plus qVD-OPH (20 µM) for 24 h. Representative images show cells (red) with caspase-2 BiFC (yellow) in the nucleolus (blue) or cytoplasm after treatment. Bars, 10 µm. (E) Percentage of cells treated as in D that were Venus+ in the nucleolus, nucleus, or cytoplasm was determined from at least 30 microscopy images per well. Results are the mean of three independent experiments ± SD. *, P < 0.05 determined from the percentage of nucleolar Venus-positive cells compared with untreated. (F) HeLa.C2 Pro-BiFC cells were treated with or without the Chk1 inhibitor, Gö6976 (0.5 µM, 1 µM), ± IR (10 Gy) plus qVD-OPH (20 µM). The percentage of cells that were Venus+ in the nucleolus, nucleus, or cytoplasm was determined at 24 h from at least 50 microscopy images per well. Results are the mean of three independent experiments ± SD. *, P < 0.05 determined from the percentage of nucleolar Venus-positive cells compared with untreated. (G) Representative confocal images show caspase-2 BiFC (yellow) and mCherry expression (red) in cells treated as in F. Bars, 10 µm.
Figure 2.
Figure 2.
Caspase-2 is cleaved in the nucleolus. (A) HeLa cells treated with or without camptothecin (0, 50, 100, or 200 µM) for 16 h were fractionated into the cytosol, nucleoplasm, and nucleolus and immunoblotted for caspase-2, GAPDH (cytosol), or fibrillarin (nucleolus). (B) HeLa cells treated with or without camptothecin (200 µM) for 16 h were fractionated into the cytosol and nucleolus and immunoblotted for caspase-3, caspase-2, or fibrillarin (nucleolus).
Figure 3.
Figure 3.
Caspase-2 activation in the nucleolus requires the NLS and is a response to DNA breaks. (A) 3D reconstructions of HeLa.C2 Pro-BiFC cells transfected with Histone H2A-mTurquoise or Actin-mTurquoise and treated with camptothecin (100 µM) plus qVD-OPH (20 µM) were composed from 0.2-µm serial confocal images through the z-plane of the cell. Representative orthogonal-slice views show cells (red) with caspase-2 BiFC (yellow) and the indicated coexpressed proteins (blue). The middle, right, and top panels are the xy, yz, and xz planes, respectively. The yz and xz planes intersect according to the crosshairs. Bars, 10 µm. (B) HeLa cells transfected with the C2-Pro (1–147) BiFC or the C2-CARD (1–109) BiFC plasmid pair (25, 50, or 100 ng of each) with Histone H2B RFP (50 ng) were treated with or without camptothecin (100 µM). Cells were assessed 24 h later for the percentage of RFP-positive transfected cells that were Venus+ in the nucleolus, nucleus, or cytoplasm determined from at least 30 microscopy images per well. Results are the mean of three independent experiments ± SD. *, P < 0.05; **, P < 0.005 determined from the percentage of Venus-positive cells in the nucleolus. (C) Representative confocal images show caspase-2 BiFC (yellow) and nuclear Histone H2B expression (red) in cells treated as in B. Bars, 20 µm. (D) HeLa.C2 Pro-BiFC cells transfected with 53BP1-TFP (2 µg) were treated with the indicated drugs (100 µM) plus qVD-OPH (20 µM). TFP-positive cells were counted for absence or presence of 53BP1 foci and the percentage of cells that were Venus+ in the nucleolus, nucleus, or cytoplasm. Results are the mean of three independent experiments ± SD. The association of cells with caspase-2 BiFC in the nucleolus and 53BP1 foci was significant across experiments (camptothecin, P = 7.58 × 10⁻⁶; topotecan, 3.06 × 10⁻⁷; etoposide, 1.61 × 10⁻³) as calculated by the Cochran–Mantel–Haenszel test. (E) Representative confocal images of cells treated as in D show 53BP1 (blue) and caspase-2 BiFC (yellow). Bars, 5 µm.
Figure 4.
Figure 4.
Localization of caspase-2 activation platforms within the nucleolus. (A) HeLa.C2 Pro-BiFC cells transfected with Fibrillarin-CFP (2 µg), TFP-Nucleolin (NCL; 2 µg), or TFP-NPM1 (2 µg) were treated with or without camptothecin (10 µM) plus qVD-OPH (20 µM). Representative images show cells (red) with caspase-2 BiFC (yellow) and the indicated nucleolar proteins (blue). Bars, 10 µm. 3D reconstructions of the white boxed region composed from 0.2-µm serial confocal images through the z-plane of the cell are shown as orthogonal-slice views (right). The middle, right, and top panels are the xy, yz, and xz planes, respectively. The yz and xz planes intersect according to the crosshairs. Bars, 2 µm. (B) 3D graphs of pixel intensities of TFP-NPM1 and C2-BiFC signals in a representative untreated and camptothecin-treated cell.
Figure 5.
Figure 5.
RAIDD is required for caspase-2 BiFC, but PIDD is required for caspase-2 BiFC only in the nucleolus. (A) Litter-matched Raidd+/− or Raidd−/− MEFs stably expressing C2 Pro-BiFC were treated with camptothecin (250 nM), irinotecan (250 nM), topotecan (250 nM), etoposide (250 nM), or vincristine (25 nM) plus qVD-OPH (20 µM). The percentage of cells that were Venus+ in the nucleolus, nucleus, or cytoplasm was determined at 24 h from at least 30 microscopy images per well. Results are the mean of three independent experiments ± SD. The differences in total Venus-positive cells between the Raidd+/− and Raidd−/− groups is significant to P = 0.0034. (B) Representative confocal images show caspase-2 BiFC (yellow) and mCherry expression (red) in Raidd+/− and Raidd−/− C2 Pro-BiFC MEFs. Bars, 5 µm. Arrowheads indicate locations of nucleoli that are magnified in the bottom panel (bars, 1 µm). See Fig. S3 C for full dataset images. (C) Litter-matched Pidd+/+ or Pidd−/− MEFs stably expressing C2 Pro-BiFC were treated with camptothecin (250 nM), irinotecan (250 nM), topotecan (250 nM), etoposide (250 nM), or vincristine (25 nM) plus qVD-OPH (20 µM). The percentage of cells that were Venus+ in the nucleolus, nucleus, or cytoplasm was determined at 24 h from at least 30 microscopy images per well. Results are the mean of three independent experiments ± SD. *, P < 0.05; **, P < 0.005 determined from the percentage of nucleolar Venus-positive cells between Pidd+/+ and Pidd−/− cells for each treatment. (D) Representative confocal images show caspase-2 BiFC (yellow) and mCherry expression (red) in Pidd+/+ and Pidd−/− C2 Pro-BiFC MEFs. Bars, 5 µm. Arrowheads indicate locations of nucleoli that are magnified in the lower panel (bars, 1 µm). See Fig. S3D for full dataset images. (E) PIDD or RAIDD was deleted from HeLa.C2 Pro-BiFC cells with CRISPR/Cas9 using two independent sgRNAs per gene. The percentage of cells treated with or without camptothecin (100 µM) plus qVD-OPH (20 µM) that were Venus+ in the nucleolus, nucleus, or cytoplasm was determined after 24 h from at least 50 microscopy images per well. Results are the mean of three independent experiments ± SD. *, P < 0.05 determined from the percentage of nucleolar Venus-positive cells compared with the control treated group. The difference in total Venus-positive cells compared with camptothecin-treated control for ΔRAIDD cells is significant to P < 0.0001 (ΔRAIDD(57)) and P = 0.0187 (ΔRAIDD(76)). (F) Pidd+/+ and Pidd−/− C2-Pro BiFC MEFs were treated with or without Gö6976 (0.125, 0.25, or 0.5 µM) ± IR (10 Gy) plus qVD-OPH (20 µM). The percentage of cells that were Venus+ in the nucleolus, nucleus, or cytoplasm was determined 24 h after treatment from at least 50 microscopy images per well. Results represent triplicate counts ± SD. *, P < 0.05; **, P < 0.005 determined from the percentage of Venus-positive cells in the nucleolus between Pidd+/+ and Pidd−/− cells for each treatment.
Figure 6.
Figure 6.
NPM1 interacts with PIDD-CC and PIDD-N after DNA damage. (A) HeLa cells treated with DMSO, actinomycin D (Act-D; 500 nM) or camptothecin (CPT; 200 µM) were harvested 24 h after treatment, lysed, and immunoprecipitated (IP) with NPM1 antibody. Immunoprecipitates were analyzed by Western blot (IB). (B) HeLa cells treated with DMSO, Act-D (500 nM), or CPT (200 µM) were harvested 24 h after treatment, lysed, and immunoprecipitated with monoclonal Anto-1 antibody to PIDD C terminus. Immunoprecipitates were analyzed by Western blot. (C) HeLa cells treated with or without Gö6976 (1 µM) ± IR (10 Gy) were harvested 24 h after IR, lysed, and immunoprecipitated with monoclonal anti-PIDD antibody. Immunoprecipitates were analyzed by Western blot. (D) HeLa cells treated with or without Gö6976 (1 µM) ± IR (10 Gy) were harvested 24 h after IR, lysed, and immunoprecipitated with anti-NPM1 antibody. Immunoprecipitates were analyzed by Western blot. (E) Schematic representation of NPM1 (WT) and NPM1c+ (mutated in AML) protein domain structure. Indicated are amino acids defining the extremities of deletion constructs used in J. OD/ChD, oligomerization/chaperone domain; D/RBD, DNA/RNA binding domain; Aro, aromatic region; NuLS, nucleolar localization signal; NES, nuclear exclusion signal. (F) Schematic representation of PIDD-FL, PIDD autocleavage products. Indicated are amino acids defining the extremities of deletion constructs used in G and autocleavage sites in PIDD. LRR, LRR domain; ZU-5, ZO-1 and UNC5-like; UPA, uncharacterized protein domain in UNC5, PIDD, and Ankyrin family of proteins (designates the putative PIDD oligomerization domain; Janssens and Tinel, 2012). (G) HeLa cells transfected with the indicated Flag-PIDD constructs were harvested 24 h after transfection. Flag immunoprecipitates were analyzed by Western blot. (H) HeLa cells treated with DMSO, Act-D (500 nM), or CPT (200 µM) were harvested 24 h after treatment, lysed, and immunoprecipitated with S-17 antibody to PIDD N terminus. Immunoprecipitates were analyzed by Western blot. ns, nonspecific band. (I) HeLa cells treated with DMSO, Act-D (500 nM), or CPT (200 µM) were harvested 24 h after treatment, lysed, and immunoprecipitated with NPM1 antibody. Immunoprecipitates were analyzed by Western blot. (J) HeLa cells cotransfected with the indicated HA-NPM1 constructs and the noncleavable mutant form of PIDD were harvested 24 h after transfection. HA immunoprecipitates were analyzed by Western blot.
Figure 7.
Figure 7.
NPM1 is required for PIDDosome signaling. (A) HeLa.C2 Pro-BiFC cells were transfected with the indicated siRNAs in the presence of qVD-OPH (20 µM). 48 h later, cells were treated with or without camptothecin (100 µM). The percentage of cells that were Venus+ in the nucleolus, nucleus, or cytoplasm was determined at 24 h from at least 50 microscopy images per well. Results are the mean of three independent experiments ± SD. *, P < 0.05. (B) Representative confocal images show caspase-2 BiFC (yellow) and mCherry expression (red) from cells treated as in A. Bars, 10 µm. (C) HeLa.C2 Pro-BiFC cells transfected with the indicated siRNAs in the presence of qVD-OPH (20 µM) for 48 h were treated with or without IR (50 Gy) ± Gö6976 (1 µM). The percentage of cells that were Venus+ in the nucleolus, nucleus, or cytoplasm was determined at 24 h from at least 50 microscopy images per well. Results are the mean of four independent experiments ± SD. ***, P < 0.0005. (D) Tp53−/− MEFs of indicated Npm1 genotypes were treated with or without Gö6976 (1 µM) ± IR (10 Gy) and harvested 24 h later. Lysates were analyzed by Western blot. (E) Tp53−/− MEFs of indicated Npm1 genotypes were treated with or without camptothecin (100 or 150 µM) and harvested 24 h later. Lysates were analyzed by Western blot. (F) PC3 cells transfected with the indicated siRNAs were treated with or without Gö6976 (1 µM) ± IR (10 Gy) and harvested 24 h later. Lysates were analyzed by Western blot. (G) OCI-AML2 and OCI-AML3 cells, of indicated NPM1 genotypes, were treated with or without Gö6976 (1 µM) ± IR (10 Gy) and harvested 24 h later. Lysates were analyzed by Western blot.
Figure 8.
Figure 8.
Inhibition of NPM1 blocks apoptosis and caspase-2–dependent suppression of cell growth. (A–C) Litter-matched Casp2+/+ and Casp2−/− MEFs (A), Raidd+/+ and Raidd−/− MEFs (B), or Pidd+/+ and Pidd−/− MEFs (C) were treated with or without camptothecin (250 nM). Apoptosis was assessed by flow cytometry for Annexin V binding 16 h later. Results are the mean of three to four independent experiments ± SD. *, P < 0.05. (D) Tp53−/− MEFs of indicated Npm1 genotypes were treated with or without camptothecin. Apoptosis was assessed by flow cytometry for Annexin V binding 16 h after treatment. Results are the mean of three independent experiments ± SD. *, P < 0.05; **, P < 0.005. (E) Tp53−/− MEFs of indicated Npm1 genotypes were treated with or without Gö6976 (1 µM) ± IR (10 Gy), harvested 24 h after IR, stained for TUNEL, and analyzed by flow cytometry. Results are the mean of three independent experiments ± SD. *, P < 0.05. (F) HeLa cells transfected with the indicated siRNAs were treated with or without Gö6976 (1 µM) ± IR (10 Gy) and stained with alamarBlue 72 h after IR. Results are the mean of three independent experiments ± SD.*, P < 0.05 (two-tailed Student’s t test). (G–J′) p53M214K/M214K zebrafish embryos were injected at the one-cell stage with standard control (ctrl) or npm1a+npm1b morpholinos, incubated 17 h later with or without Gö6976 at indicated concentrations (μM), treated with or without 15 Gy IR, and stained with the cell death marker acridine orange (AO) after 7 h. All embryos were imaged live at 24 h postfertilization. Panels G′, H′, I′, and J′ are blowups of indicated spinal cord areas in corresponding whole-embryo panels. Bars, 250 µm. (K) Quantification of AO stains shown in G–J′. Results are the mean of three independent experiments (≥10 embryos per condition) ± SEM. **, P < 0.005. (L) Litter-matched Casp2+/+ and Casp2−/− MEFs, plated at low density, were treated with or without a chemical inhibitor of NPM1 (3 µM) for 7 h. Colonies were stained with methylene blue 5 d after treatment. The number of colonies under each treatment condition is shown. Results are the mean of six individual wells across two independent experiments ± SD. **, P < 0.005; ***, P < 0.0005. (M) Representative images of methylene blue–stained colonies from cells treated as in L.
Figure 9.
Figure 9.
Model for DNA damage induces caspase-2 activation. Schematic representation of model for two distinct caspase-2 activation platforms that assemble in the nucleolus or cytoplasm after DNA damage. See text for details.

Comment in

  • The nucleolus: A new home for the PIDDosome.
    Bouchier-Hayes L, Sidi S. Bouchier-Hayes L, et al. Cell Cycle. 2017;16(17):1562-1563. doi: 10.1080/15384101.2017.1355179. Epub 2017 Jul 27. Cell Cycle. 2017. PMID: 28749201 Free PMC article. No abstract available.

References

    1. Ahmad M., Srinivasula S.M., Wang L., Talanian R.V., Litwack G., Fernandes-Alnemri T., and Alnemri E.S.. 1997. CRADD, a novel human apoptotic adaptor molecule for caspase-2, and FasL/tumor necrosis factor receptor-interacting protein RIP. Cancer Res. 57:615–619. - PubMed
    1. Ando K., Kernan J.L., Liu P.H., Sanda T., Logette E., Tschopp J., Look A.T., Wang J., Bouchier-Hayes L., and Sidi S.. 2012. PIDD death-domain phosphorylation by ATM controls prodeath versus prosurvival PIDDosome signaling. Mol. Cell. 47:681–693. 10.1016/j.molcel.2012.06.024 - DOI - PMC - PubMed
    1. Antoniali G., Lirussi L., Poletto M., and Tell G.. 2014. Emerging roles of the nucleolus in regulating the DNA damage response: The noncanonical DNA repair enzyme APE1/Ref-1 as a paradigmatical example. Antioxid. Redox Signal. 20:621–639. 10.1089/ars.2013.5491 - DOI - PMC - PubMed
    1. Baliga B.C., Colussi P.A., Read S.H., Dias M.M., Jans D.A., and Kumar S.. 2003. Role of prodomain in importin-mediated nuclear localization and activation of caspase-2. J. Biol. Chem. 278:4899–4905. 10.1074/jbc.M211512200 - DOI - PubMed
    1. Baliga B.C., Read S.H., and Kumar S.. 2004. The biochemical mechanism of caspase-2 activation. Cell Death Differ. 11:1234–1241. 10.1038/sj.cdd.4401492 - DOI - PubMed

Publication types

MeSH terms