. 2017 Jun 9;292(23):9801-9814.
doi: 10.1074/jbc.M116.770180. Epub 2017 Apr 21.

The Lon protease-like domain in the bacterial RecA paralog RadA is required for DNA binding and repair

Affiliations

The Lon protease-like domain in the bacterial RecA paralog RadA is required for DNA binding and repair

Masao Inoue et al. J Biol Chem. .

Abstract

Homologous recombination (HR) plays an essential role in the maintenance of genome integrity. RecA/Rad51 paralogs have been recognized as an important factor of HR. Among them, only one bacterial RecA/Rad51 paralog, RadA, is involved in HR as an accessory factor of RecA recombinase. RadA has a unique Lon protease-like domain (LonC) at its C terminus, in addition to a RecA-like ATPase domain. Unlike Lon protease, RadA's LonC domain does not show protease activity but is still essential for RadA-mediated DNA repair. Reconciling these two facts has been difficult because RadA's tertiary structure and molecular function are unknown. Here, we describe the hexameric ring structure of RadA's LonC domain, as determined by X-ray crystallography. The structure revealed the two positively charged regions unique to the LonC domain of RadA are located at the intersubunit cleft and the central hole of a hexameric ring. Surprisingly, a functional domain analysis demonstrated the LonC domain of RadA binds DNA, with site-directed mutagenesis showing that the two positively charged regions are critical for this DNA-binding activity. Interestingly, only the intersubunit cleft was required for the DNA-dependent stimulation of ATPase activity of RadA, and at least the central hole was essential for DNA repair function. Our data provide the structural and functional features of the LonC domain and their function in RadA-mediated DNA repair.

Keywords: DN-binding protein; DNA repair; Lon protease; RadA; RecA; Thermus thermophilus HB8; X-ray crystallography; homologous recombination; site-directed mutagenesis.


Conflict of interest statement

The authors declare that they have no conflicts of interest with the contents of this article.

Figures

Figure 1.
Figure 1.
Structure of rLonC. A, schematic representation of the domain organization of typical RadA, RecA, and Lon protease. The asterisk indicates that the catalytic serine residue of Lon protease activity is not conserved in RadA. The long N-terminal region of Lon protease that contains the putative substrate recognition domain is omitted. B, overall structures of T. thermophilus rLonC (left panel) and E. coli pLonC (right panel; PDB code 1RR9) (25) are shown in a schematic representation, colored in a spectrum from the N terminus (blue) to the C terminus (red). The side chains of the two residues (Ser-679 and Lys-722) forming the catalytic dyad of E. coli pLonC and the corresponding residues (Gly-350 and Arg-393, respectively) of rLonC are represented as magenta sticks. In the E. coli pLonC structure, Ser-679 is replaced with Ala to avoid self-digestion. The segment absent in rLonC is indicated as a dashed oval. C, multiple sequence alignment of the LonC domains with secondary structures. The accession numbers of the sequences are as follows: T. thermophilus (Tt) RadA (YP_143807); D. radiodurans (Dr) RadA (NP_294829); E. coli (Ec) RadA (NP_418806); B. subtilis (Bs) RadA (NP_387968); and E. coli (Ec) Lon (NP_414973). The locations of the secondary structure elements of T. thermophilus rLonC and E. coli pLonC are shown above and below each amino acid sequence, respectively. The cylinders (red) and arrows (blue) represent α-helices and β-strands, respectively. The segment absent in rLonC is indicated as a dashed rectangle. The catalytic residues, Ser-679 and Lys-722, of E. coli Lon protease and the corresponding residues in the RadA orthologs are boxed in magenta. The residues for the site-directed mutagenesis of T. thermophilus RadA and the corresponding residues in other LonC domains are highlighted in color backgrounds as follows (related to Fig. 4): cyan, the residues that showed decreased DNA-binding activity by mutation to Ala at the intersubunit cleft; yellow, the residues that showed decreased DNA-binding activity by mutation to Ala at the central hole; and gray, the residues that showed similar DNA-binding activity to the wild type by mutation to Ala at the outer wall and peripheral regions. D, hexameric structures of T. thermophilus rLonC (left panel) and E. coli pLonC (right panel) are shown in a schematic representation. Each subunit is colored in a spectrum from the N terminus (blue) to the C terminus (red). The loop containing 299TPFPAP304 is colored in magenta. E, surface electrostatic potentials of T. thermophilus rLonC (top left panel) and E. coli pLonC (top right panel) are shown in the same view as in D, contoured in the range from −5 kT/e (red) to +5 kT/e (blue). The surface electrostatic potential of T. thermophilus rLonC is shown in two different orientations, rotated 90° (bottom left panel) and 180° (bottom right panel) around the horizontal axis. The basic cleft is indicated by a blue arrow.
Figure 2.
Figure 2.
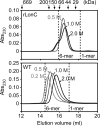
Gel filtration analysis of the rLonC domain and full-length RadA. The elution profiles of the rLonC domain (ΔN261) and full-length RadA (WT) in various salt concentrations are shown in the top and bottom panels, respectively. The NaCl concentrations are labeled. The elution peaks and molecular masses of standard proteins are indicated as black arrows and labeled in kDa, respectively. The estimated elution peaks of monomer and hexamer by the calibration curve is indicated as dashed lines. Under the condition of 0.2 m NaCl, the rLonC domain was not eluted because of adsorption to the filter or the resin.
Figure 3.
Figure 3.
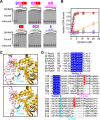
DNA-binding activity of RadA domain-truncated mutants. A and B, DNA-binding activity of the domain-truncated mutants of RadA was assessed by EMSA. The representative gels are shown in A. The protein concentrations of wild-type (WT) RadA and RadA mutants were 1.1, 2.0, 3.5, 6.0, 11, and 20 μm. Schematic representations of the domain organization of each mutant are shown above the panel as follows: light blue, a ZF domain (Z); pink, a RecA-like ATPase domain (R); and red, a LonC domain (L). The quantitative results of the protein concentration dependence in DNA binding are shown in B. The WT and mutants are colored as follows: black, WT; orange, ΔN53; pink, ΔN53/260C; red, ΔN261; green, Δ260C; and light blue, Δ54C. The error bars indicate the standard deviation of the values of fraction DNA bound from three independent experiments. The DNA-binding affinities estimated by the experiments are summarized in Table 2. C, structural comparison of the RecA-like ATPase domain of RadA from T. thermophilus HB8 (residues 54–260) with the RecA-dsDNA complex (top; PDB code, 3CMX) and RecA-ssDNA complex (bottom; PDB code, 3CMW) from E. coli. The structural model of the ATPase domain of RadA was created using the I-TASSER server (30). The predicted structure of the ATPase domain of RadA and the structure of that of RecA are aligned (r.m.s. deviation = 2.7 Å for Cα atoms) and shown in a schematic representation, colored in yellow and orange, respectively. The L1 and L2 loops of RecA are colored in magenta and cyan, respectively. The L1 and L2 loops of RadA are colored in light pink and pale cyan, respectively. D, multiple sequence alignment of the ATPase domain of RecA and RadA. The alignment was generated by Muscle (65). The Walker-type ATPase motifs and the conserved residues that are important for DNA binding are highlighted with blue and red backgrounds, respectively. The L1 and L2 loops are boxed in magenta and cyan, respectively. The accession numbers of the sequences are as follows: T. thermophilus (Tt) RecA (YP_145084); D. radiodurans (Dr) RecA (NP_296061); B. subtilis (Bs) RecA (NP_389576); E. coli (Ec) RecA (NP_417179); Tt RadA (YP_143807); Dr RadA (NP_294829); Bs RadA (NP_387968); and Ec RadA (NP_418806).
Figure 4.
Figure 4.
Identification of the DNA-binding sites of RadA. A, location of the residues for site-directed mutagenesis. An overall view of the hexameric ring and close-up views (rectangles) of three different regions (circles) are shown. The bold arrows indicate the close-up operation with small changes in viewing direction. The two molecules in the asymmetric unit are shown in different colors. The residues are shown as follows (related to Fig. 1B): cyan, the residues at the intersubunit cleft; yellow, the residues at the central hole; and gray, the residues at the outer wall and peripheral regions. B, DNA-binding activity of the site-directed mutants of RadA was assessed by EMSA. The mutants of the residues at the intersubunit cleft (cyan), central hole (orange), and outer wall and peripheral regions (gray) are shown in the left, middle, and right panels, respectively. The insets show the mutants and their respective symbols. The theoretical curves of the WT result are shown as a black dotted line (related to Fig. 3B). The error bars indicate the standard deviation of the values of fraction DNA bound from three independent experiments. The DNA-binding affinities estimated by the experiments are summarized in Table 2.
Figure 5.
Figure 5.
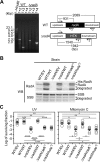
Gene disruption and in vivo complementation assays using the DNA-binding-deficient mutants. A, confirmation of gene disruption by genomic PCR. Agarose gel electrophoresis of the PCR products (left panel) and a schematic representation of the genomic regions around the radA gene of the wild type and ΔradA (right panel) are shown. The primers used in the PCR are indicated by black arrows. The theoretical lengths (bp) of the PCR products and the primer sets are shown. The sequences of the primers are listed in Table 5. B, estimation of protein expression levels in T. thermophilus HB8 cells by Western blot analysis using anti-RadA and anti-SSB antisera. C, effects of DNA-binding deficient mutations to UV light (left panel) and mitomycin C (right panel) sensitivity in T. thermophilus HB8 cells. The sensitivity is shown as log10-transformed survival fraction. The mean value (black line) of six independent experiments and each of their values (gray circle) are indicated. The error bar indicates the standard error of the mean. Statistical analysis was performed using Welch's t test, and multiplicity was adjusted using Holm-Bonferroni method: *, p < 0.05; **, p < 0.01; ***, p < 0.001; ****, p < 0.0001. Statistical comparisons evaluated as “not significant” are not indicated. The cleft*1 and hole*2 show the R286A/R385A*1 and R305A/R314A/K345A*2 mutants, respectively. EV, empty vector; WT, wild type.
Figure 6.
Figure 6.
DNA-dependent ATPase activity. A, ATP concentration dependence of the rate constants in the absence (black) and presence of 30 μm (bp) dsDNA (blue) and 30 μm (nucleotides) ssDNA (red). The results for the wild type, R286A/R385A, and R305A/R314A/K345A are shown in the left, middle, and right panels, respectively. The kinetic parameters estimated by the experiments are summarized in Table 3. B, DNA concentration dependence of the rate constants in ATP hydrolysis of the wild type (black), R286A/R385A (cyan), and R305A/R314A/K345A (yellow) in the presence of 500 μm ATP. The results for dsDNA and ssDNA are shown in the left and right panels, respectively. The DNA-binding affinities estimated by the experiments are summarized in Table 4. The error bars indicate the standard deviation of the kapp values from three independent experiments. WT, wild type. C, summary of the DNA-binding sites of rLonC and their functions revealed by this study. The schematic representation of the hexameric ring structure of rLonC is colored in purple. The ATPase domain in each subunit is shown as a gray circle with a dotted line. The DNA molecule is colored in orange.

References

    1. Cromie G. A., Connelly J. C., and Leach D. R. (2001) Recombination at double-strand breaks and DNA ends: conserved mechanisms from phage to humans. Mol. Cell 8, 1163–1174 - PubMed
    1. Krejci L., Altmannova V., Spirek M., and Zhao X. (2012) Homologous recombination and its regulation. Nucleic Acids Res. 40, 5795–5818 - PMC - PubMed
    1. Shin D. S., Chahwan C., Huffman J. L., and Tainer J. A. (2004) Structure and function of the double-strand break repair machinery. DNA Repair 3, 863–873 - PubMed
    1. West S. C. (2003) Molecular views of recombination proteins and their control. Nat. Rev. Mol. Cell Biol. 4, 435–445 - PubMed
    1. Brigulla M., and Wackernagel W. (2010) Molecular aspects of gene transfer and foreign DNA acquisition in prokaryotes with regard to safety issues. Appl. Microbiol. Biotechnol. 86, 1027–1041 - PubMed

LinkOut - more resources