. 2017 May 17;37(20):5123-5143.
doi: 10.1523/JNEUROSCI.2715-16.2017. Epub 2017 Apr 21.

Focal Local Field Potential Signature of the Single-Axon Monosynaptic Thalamocortical Connection

Affiliations

Focal Local Field Potential Signature of the Single-Axon Monosynaptic Thalamocortical Connection

Espen Hagen et al. J Neurosci. .

Abstract

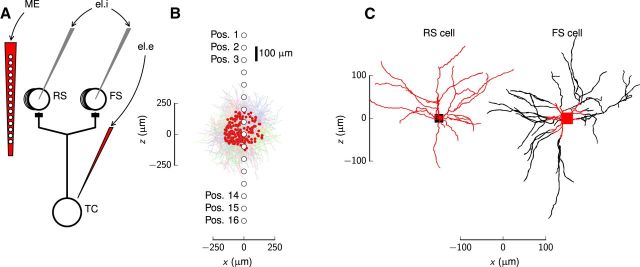
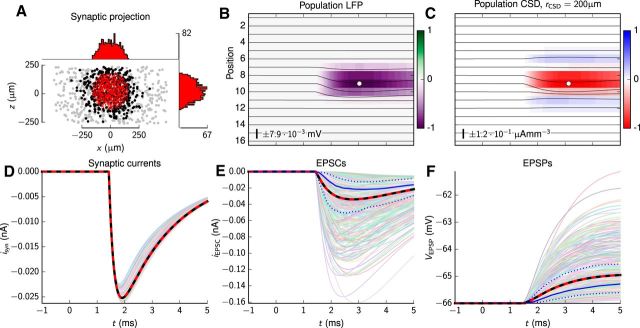
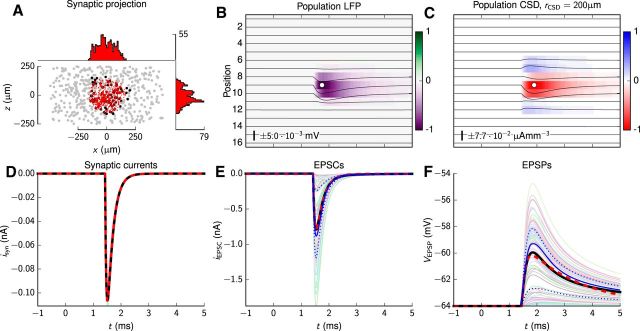
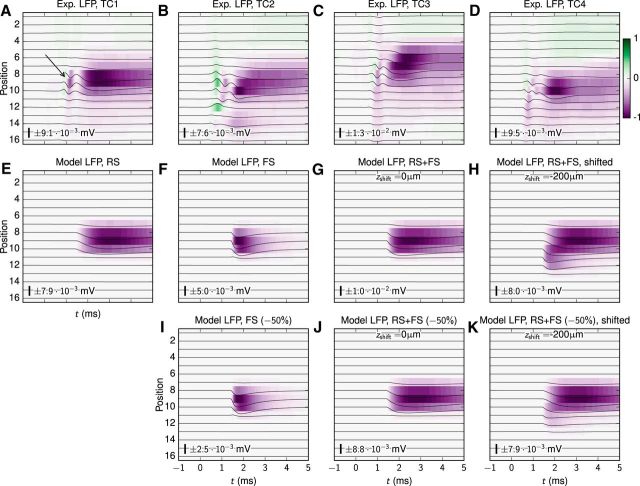
A resurgence has taken place in recent years in the use of the extracellularly recorded local field potential (LFP) to investigate neural network activity. To probe monosynaptic thalamic activation of cortical postsynaptic target cells, so called spike-trigger-averaged LFP (stLFP) signatures have been measured. In these experiments, the cortical LFP is measured by multielectrodes covering several cortical lamina and averaged on spontaneous spikes of thalamocortical (TC) cells. Using a well established forward-modeling scheme, we investigated the biophysical origin of this stLFP signature with simultaneous synaptic activation of cortical layer-4 neurons, mimicking the effect of a single afferent spike from a single TC neuron. Constrained by previously measured intracellular responses of the main postsynaptic target cell types and with biologically plausible assumptions regarding the spatial distribution of thalamic synaptic inputs into layer 4, the model predicted characteristic contributions to monosynaptic stLFP signatures both for the regular-spiking (RS) excitatory neurons and the fast-spiking (FS) inhibitory interneurons. In particular, the FS cells generated stLFP signatures of shorter temporal duration than the RS cells. Added together, a sum of the stLFP signatures of these two principal synaptic targets of TC cells were observed to resemble experimentally measured stLFP signatures. Outside the volume targeted by TC afferents, the resulting postsynaptic LFP signals were found to be sharply attenuated. This implies that such stLFP signatures provide a very local measure of TC synaptic activation, and that newly developed inverse current-source density (CSD)-estimation methods are needed for precise assessment of the underlying spatiotemporal CSD profiles.SIGNIFICANCE STATEMENT Despite its long history and prevalent use, the proper interpretation of the extracellularly recorded local field potential (LFP) is still not fully established. Here we investigate by biophysical modeling the origin of the focal LFP signature of the single-axon monosynaptic thalamocortical connection as measured by spike-trigger-averaging of cortical LFPs on spontaneous spikes of thalamocortical neurons. We find that this LFP signature is well accounted for by a model assuming thalamic projections to two cortical layer-4 cell populations: one excitatory (putatively regular-spiking cells) and one inhibitory (putatively fast-spiking cells). The LFP signature is observed to decay sharply outside the cortical region receiving the thalamocortical projection, implying that it indeed provides a very local measure of thalamocortical synaptic activation.

Keywords: layer 4; local field potential; modeling; monosynaptic; sensory cortex; thalamocortical.


Figures

Figure 1.
Figure 1.
Illustration of the TC connection to the cortex, postsynaptic model populations, and reconstructed morphologies with corresponding synapse sites. A, Schematic view of the monosynaptic TC projection to layer 4 and corresponding measurements of responses for an axon of a single TC cell connecting monosynaptically to RS and FS cells in layer 4. ME, Extracellular multicontact electrode recording the LFP through the cortex; el.i, whole-cell patch-clamp electrodes that record intracellular responses in terms of EPSPs and corresponding currents; el.e, extracellular recording electrode in the topographically aligned thalamic region that detects or initiates spiking activity in the TC cell. B, Postsynaptic model populations shown with 40 reconstructed stellate cells (RS cells) and 10 reconstructed interneurons (FS cells). Locations of synaptic inputs from the TC cell are denoted by red dots, all within a radius of 165 μm from the center of the synaptic projection pattern (compare Eq. 4). The locations of ME contact points penetrating the population are denoted by circles labeled Pos. 1–16. C, Reconstructed morphologies of the RS principal neuron and FS interneuron employed in the model populations. Putative locations of synaptic inputs of TC afferents onto the RS cell and FS cell are marked in red, i.e., dendritic compartments of the RS cell and within 50 μm of, and including, the soma for the FS cell.
Figure 2.
Figure 2.
Schematic representation of the RS-cell population and their postsynaptic responses. The responses are obtained for 470 postsynaptic cells and 1311 dendritic synapses corresponding to the putative monosynaptic connection of a TC afferent onto RS cells. Synapses were allowed within a sphere with radius rsyn = 165 μm, vertically offset by μz = 35 μm (compare Eq. 4). A, Scatter plot of synaptic and somatic locations within the population. Gray dots denote somas of neurons without TC synapses; black dots denote somas of postsynaptic cells; red dots denote synapse locations. The histograms on top and to the right show the spatial distribution of synapse locations along the horizontal x-axis and vertical z-axis, respectively. The single tick label of each histogram denotes the maximum synapse count within 10 μm bins along the depicted axes. B, LFP responses from the 16-channel laminar electrode shown as image and line plots. The white circle marker denotes the position and time of the global LFP minimum relative to the image plot (electrode position 9 and t = 3.03 ms). C, Ground-truth CSD for the postsynaptic response. The global CSD minimum is at electrode position 9 and t = 3.13 ms. The default spatial filtering procedure was applied. D, Synaptic input currents: traces of individual synaptic currents (thin colored lines), averaged current (black line), and least-square fit of the two-exponential function to the averaged current (dashed red line). E, Somatic EPSCs recorded in the somas of postsynaptic cells with the somatic voltages clamped to the resting potential of each neuron: individual EPSC traces (thin colored lines), averaged EPSC (black line), and least-square fit of the two-exponential function to averaged EPSC (dashed red line). The solid blue line denotes the median EPSC, and the dotted blue lines denote the lower and upper quartile (25 and 75% percentile) of the data. F, Somatic EPSPs recorded in the somas of postsynaptic cells: individual EPSP traces (thin colored lines), averaged EPSP (black line), and least-square fit of the two-exponential function to averaged EPSP (dashed red line). The solid blue line denotes the median EPSP, and the dotted blue lines denote the lower and upper quartile (25 and 75% percentile) of the data. Note that in D–F, the black lines almost completely overlap the red lines. In B and C, the number and scale bar describe the amplitude of the line plots. The number also gives the LFP/CSD values corresponding to ±1 of the color bar.
Figure 3.
Figure 3.
Schematic of the postsynaptic FS-cell population and their postsynaptic responses. These results were obtained from 88 postsynaptic cells and 932 somatic and proximal synapses. Synapses were located in a sphere with radius of rsyn = 165 μm, but with no vertical offset (μz = 0 μm). A, Scatter plot of synaptic and somatic locations. Gray dots denote somas of neurons without synapses; black dots denote neurons with synapses; red dots denote synaptic locations. The histograms on top and to the right show the spatial distribution of synapse locations along the horizontal x-axis and vertical z-axis, respectively. The single tick label of each histogram denotes the maximum synapse count within 10 μm bins along the depicted axes. B, LFP responses from the 16-channel laminar electrode shown as image and line plots. The white circle marker denotes the position and time of the global LFP minimum relative to the image plot (electrode position 9 and t = 1.75 ms). C, Ground-truth CSD for the postsynaptic response. The maximum and minimum values in the color plot are ±0.077 μA/mm3. The global CSD minimum is at electrode position 9 and t = 1.90 ms. The default spatial filtering procedure was applied. D, Synaptic input currents: traces of individual synaptic currents (thin colored lines), averaged current (black line), and least-square fit of the two-exponential function to the averaged current (dashed red line). E, Somatic EPSCs recorded in the somas of postsynaptic cells with the somatic voltages clamped to the resting potential of each neuron: individual EPSC traces (thin colored lines), averaged EPSC (black line), and least-square fit of the two-exponential function to the average EPSC (dashed red line). The solid blue line denotes the median EPSC, and the dotted blue lines denote the upper and lower quartile of the data. F, Somatic EPSPs recorded in the somas of postsynaptic cells: individual EPSP traces (thin colored lines), averaged EPSP (black line), and least-square fit of the two-exponential function to the average EPSP (dashed red line). The solid blue line denotes the median EPSP; the dotted blue lines denote the upper and lower quartile of the data. In B and C, the number and scale bar describe the amplitude of the line plots. The number also gives the LFP/CSD values corresponding to ±1 of the color bar.
Figure 4.
Figure 4.
Model versus experimental stLFPs. Comparison of stLFP recordings obtained in vivo with model LFPs from the RS-cell and FS-cell populations, independently and with superposition of the contributions from each model population. A, Postsynaptic LFP responses from an individual TC afferent in the rabbit somatosensory (S1) cortex, from Swadlow et al. (2002, their Fig. 1B–N1). The arrow points to the short presynaptic contribution to the LFP. B, Postsynaptic LFP responses of another TC afferent projecting to S1 from Swadlow et al. (2002, their Fig. 1B–N2). C, stLFP responses from a LGN afferent obtained in rabbit visual cortex (V1), from Stoelzel et al. (2008, their Fig. 1E). D, Postsynaptic responses of another LGN afferent recorded in V1 from the same study (Stoelzel et al., 2008, their Fig. 2A1). E, Postsynaptic LFPs from the model RS-cell population (see Results, Contribution to stLFP signature from RS cell population). F, Postsynaptic LFPs from the model FS-cell population (compare Results, Contribution to stLFP signature from FS cell population). G, Linear superposition of LFP contributions from the model RS-cell and FS-cell populations. H, Linear superposition of LFP contributions from the model RS-cell and FS-cell populations, but with the FS-cell contribution spatially offset vertically by −200 μm. I–K, Same as F–H, but with the FS-cell population contribution to the LFP reduced by 50%. In all panels, the number and scale bar describe the amplitude of the line plots. The number also gives the LFP values corresponding to ±1 of the color bar.
Figure 5.
Figure 5.
Effect of lateral extent of cylindrical synaptic target region on LFPs and CSDs in populations of RS cells. Synapse parameters were set to their default values, except that synapse activation occurred at t = 0 ms. The height and corresponding radius of the regions of synaptic inputs was hsyn = 200 μm and rsyn ∈ {50, 100, 200, 300, 400} μm. No vertical offsets were applied. Respective postsynaptic soma counts: {68, 209, 666, 1301, 2088}. Synapse counts: {115, 438, 1758, 3972, 6886}. A, Scatter plots showing the synaptic distributions projected in the xz and xy planes, respectively, with corresponding histograms of synaptic locations. Gray dots denote somas of neurons without synapses; black dots denote postsynaptic neurons; red dots denote the synapse locations. The histograms show the spatial distribution of synapse locations along the x-axis and z-axis, respectively. The single tick label denotes the maximum synapse count within 10 μm bins along the depicted axes. B, Effect on synaptic distribution radius on postsynaptic LFP sinks. C, Effect of synaptic distribution radius on ground-truth CSD, the domain radius rΩk is now the same as the synaptic distribution radius, rsyn. In B and C the number and scale bar describe the amplitude of the line plots. The number also gives the LFP/CSD values corresponding to ±1 of the color bar.
Figure 6.
Figure 6.
Effect of lateral electrode displacement on recorded LFPs in population of RS cells. Spatiotemporal postsynaptic LFP responses with lateral offsets of electrode device obtained for synaptic projection patterns with spherical, cylindrical, and Gaussian kernels, respectively, onto populations of RS cells. Synapse properties were similar to those of the default RS-cell population, but synapses were activated at t = 0 ms. A, Postsynaptic population with a spherical synapse distribution (rsyn = 200 μm, μz = 0 μm) consisting of 764 postsynaptic cells and 2355 synapses. The scatter plots show the synaptic distributions projected in the xz and xy planes, respectively, with corresponding histograms of synaptic locations. Gray dots denote somas of neurons without synapses; black dots denote postsynaptic neurons; red dots denote the synapse locations. The histograms show the spatial distribution of synapse locations along the x-axis and z-axis, respectively. The single tick label denotes the maximum synapse count within 10 μm bins along the depicted axes. B, Population with a cylindrical synapse distribution (rsyn = hsyn = 200 μm, μz = 0 μm) resulting in 666 postsynaptic cells with 1758 synapses. C, Population with a Gaussian-type synapse distribution (σx = σy = σz = 100 μm, μz = 0 μm) consisting of 581 cells, with 1067 synapses. D, Spatiotemporal LFP signatures for spherical synaptic distribution, at different lateral offsets along the x-axis. E, Same as D, but with the cylindrical synapse distribution. F, Same as D and E, but with the Gaussian synapse distribution. The number and scale bar inside D–F describe the amplitude of the line plots. The number also gives the LFP values corresponding to ±1 of the color bar. The gray isopotential contour lines denote LFP values of −2 · 10−5 mV (dashed) and 2 · 10−5 mV, respectively.
Figure 7.
Figure 7.
Dependence of LFP on lateral electrode position. A, LFP as a function of lateral offset x for the three considered synapse projection patterns (spherical, cylindrical, Gaussian). In this and subsequent panels values are calculated at the time step corresponding to t = 1.5 ms. Further, the vertical dashed line at x = 200 μm denotes rsyn used for the cylindrical and spherical synapse distributions, and the horizontal dot-dashed line depicts the value 0. B, LFP magnitude (absolute value) for results in A. C, Same as B with logarithmic axes. Power–law function decays (∝ r−2, r−3, r−4) depicted for comparison. D–F, Same as A–C for cylindrical synapse projection patterns with varying radius rsyn as in Figure 5.
Figure 8.
Figure 8.
Biophysical origin of dependence of LFPs on lateral electrode position. A, Radial current distribution Δinet(r), i.e., total sum of transmembrane currents within spherical shells with thickness Δr = 20 μm, as a function of each shell's outer radius (i.e., r = {20, 40, …, 500} μm). B, LFP as a function of radius calculated by numerical evaluation of Equation 16 (and CCSD(r) corresponding to Δinet in D). C, Corresponding radial electrical field E = −dφ/dr and radial extracellular current density J = σE as a function of radius. For numerical procedure for integration of Equations 16 and 17 underlying E and F, see Materials and Methods.
Figure 9.
Figure 9.
Comparison of ground-truth CSD and CSD estimates from model LFPs. The tCSD and iCSD methods were applied to model LFPs corresponding to an RS-cell population. The LFPs resulted from a synapse distribution within a cylinder with rsyn = hsyn = 200 μm, and zero offset μz. Synapses were activated at t = 0 ms, and other parameters were similar to the default parameters (Table 1). The projection resulted in 666 postsynaptic neurons and 1758 dendritic synapses. A, Illustration of the postsynaptic RS-cell population and synapse positions. The scatter plots show the synaptic distributions projected in the xz and xy planes, respectively, with corresponding histograms of synaptic locations. Gray dots denote somas of neurons without synapses; black dots denote postsynaptic neurons; red dots denote the synapse locations. The histograms show the spatial distribution of synapse locations along the x-axis and z-axis, respectively. The single tick label denotes the maximum synapse count within 10 μm bins along the depicted axes. B, LFP response from TC input. C, Ground-truth CSD, filtered. Spatial resolution corresponded to the LFP recording, i.e., hz = 100 μm. The ground-truth CSDs correspond to a radius rΩk = rsyn = 200 μm. D, Ground-truth CSDs calculated with increased spatial resolution (hz = 20 μm), filtered. The ground-truth CSDs correspond to a radius rΩk = rsyn = 200 μm. E, Deviations between ground-truth CSD (C and D) and δ-iCSD and spline-iCSD estimates as a function of source radius rCSD. The least-square error measure LS is defined in Equation 13, and values are normalized such that the global minimum is 1 (occurring for the value of rCSD giving the best fit). Also shown is the correlation coefficient, i.e., Pearson product–moment correlation coefficient, cc, between ground-truth CSD and the iCSD estimates. F, Standard CSD estimate from model LFP in B. G, δ-iCSD method estimate based on model LFP in B, rCSD = 100 μm. H, Spline-iCSD method estimate based on model LFP in B, rCSD = 100 μm. I–L, δ-iCSD estimates for a set of different values for rCSD, i.e., 50, 200, 500 and 109 μm, respectively. The number and scale bar inside B–D and F–L describe the amplitude of the line plots. The number also gives the LFP or CSD values corresponding to ±1 of the color bar.
Figure 10.
Figure 10.
CSD estimates from experimental LFPs. A, Experimental postsynaptic LFPs (column 1), corresponding to Swadlow et al., (2002, their Fig. 1B–N1), with corresponding standard CSD (column 2), δ-iCSD (column 3), and spline-iCSD estimates (column 4). B, Experimental postsynaptic LFP and CSD estimates (Swadlow et al., 2002, their Fig. 1B–N2). C, Experimental postsynaptic LFP and CSD estimates (Stoelzel et al., 2008, their Fig. 1E). D, Experimental postsynaptic LFP and CSD estimates (Stoelzel et al., 2008, their Fig. 2A1). For the iCSD methods, a column radius of rCSD = 100 μm was assumed. In each panel, the number and scale bar describe the amplitude of the line plots. The number also gives the LFP/CSD values corresponding to ±1 of the color bar.

Similar articles

Cited by

References

    1. Ahmed B, Anderson JC, Douglas RJ, Martin KA, Nelson JC (1994) Polyneuronal innervation of spiny stellate neurons in cat visual cortex. J Comp Neurol 341:39–49. 10.1002/cne.903410105 - DOI - PubMed
    1. Ahmed B, Anderson JC, Martin KA, Nelson JC (1997) Map of the synapses onto layer 4 basket cells of the primary visual cortex of the cat. J Comp Neurol 380:230–242. 10.1002/(SICI)1096-9861(19970407)380:2%3C230::AID-CNE6%3E3.3.CO;2-T - DOI - PubMed
    1. Ascoli GA, Donohue DE, Halavi M (2007) NeuroMorpho.Org: a central resource for neuronal morphologies. J Neurosci 27:9247–9251. 10.1523/JNEUROSCI.2055-07.2007 - DOI - PMC - PubMed
    1. Bagnall MW, Hull C, Bushong EA, Ellisman MH, Scanziani M (2011) Multiple clusters of release sites formed by individual thalamic afferents onto cortical interneurons ensure reliable transmission. Neuron 71:180–194. 10.1016/j.neuron.2011.05.032 - DOI - PMC - PubMed
    1. Banitt Y, Martin KA, Segev I (2007) A biologically realistic model of contrast invariant orientation tuning by thalamocortical synaptic depression. J Neurosci 27:10230–10239. 10.1523/JNEUROSCI.1640-07.2007 - DOI - PMC - PubMed

Publication types

LinkOut - more resources