. 2017 May 1;214(5):1281-1296.
doi: 10.1084/jem.20161375. Epub 2017 Apr 21.

Phagocytosis imprints heterogeneity in tissue-resident macrophages

Affiliations

Phagocytosis imprints heterogeneity in tissue-resident macrophages

Noelia A-Gonzalez et al. J Exp Med. .

Abstract

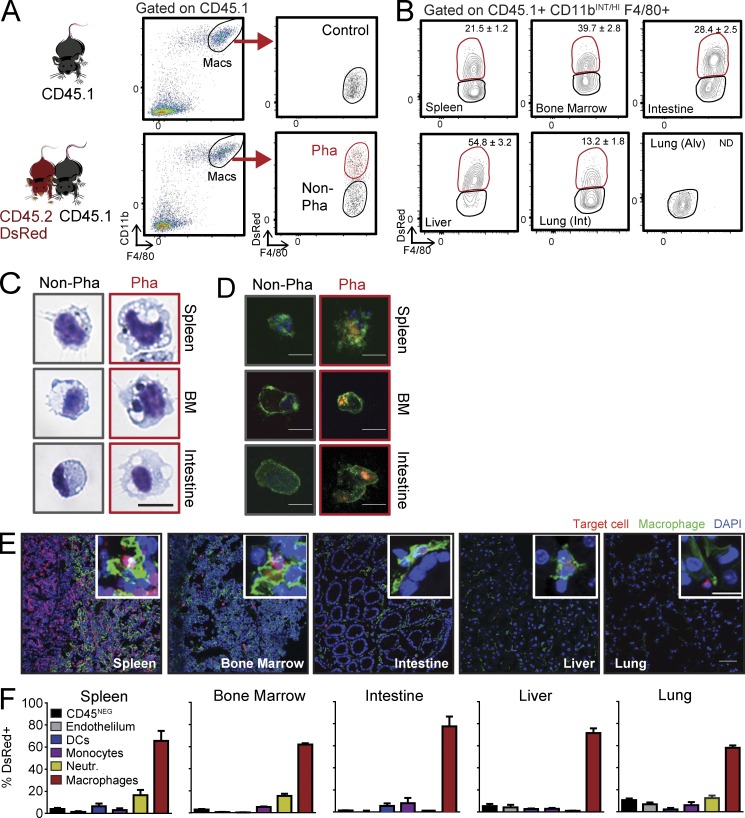
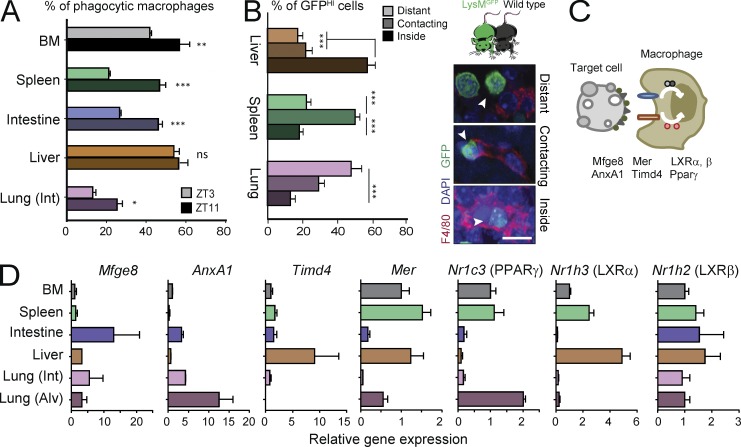
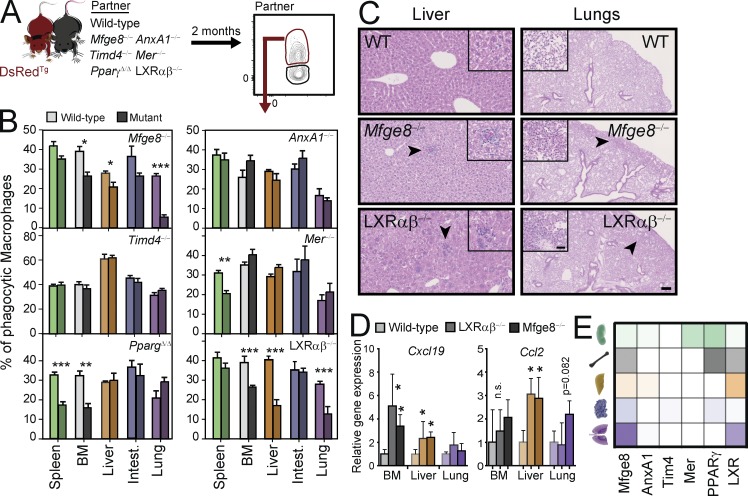
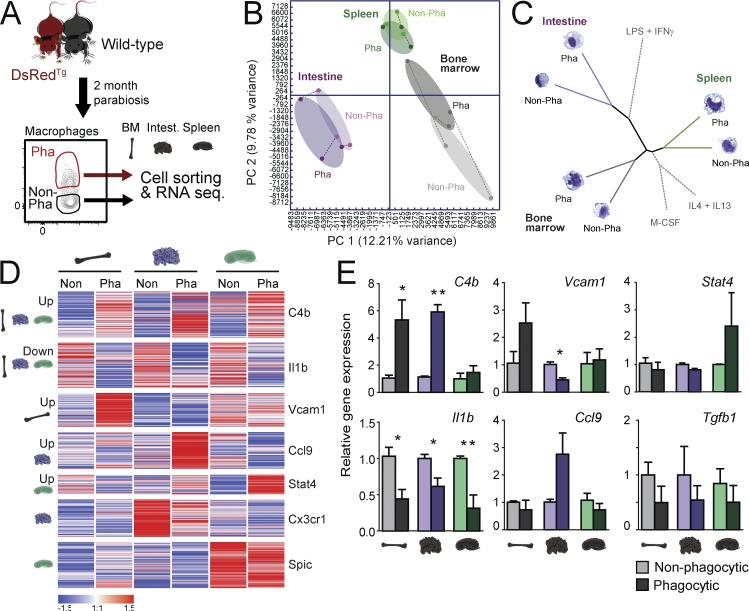
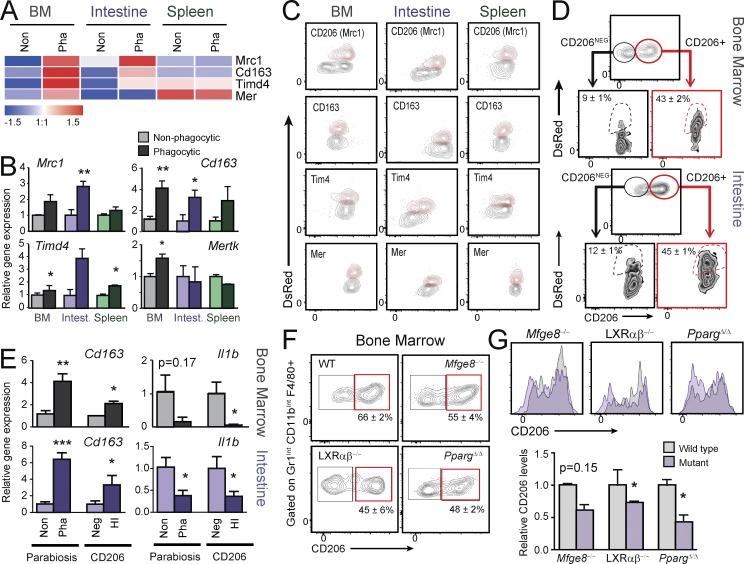
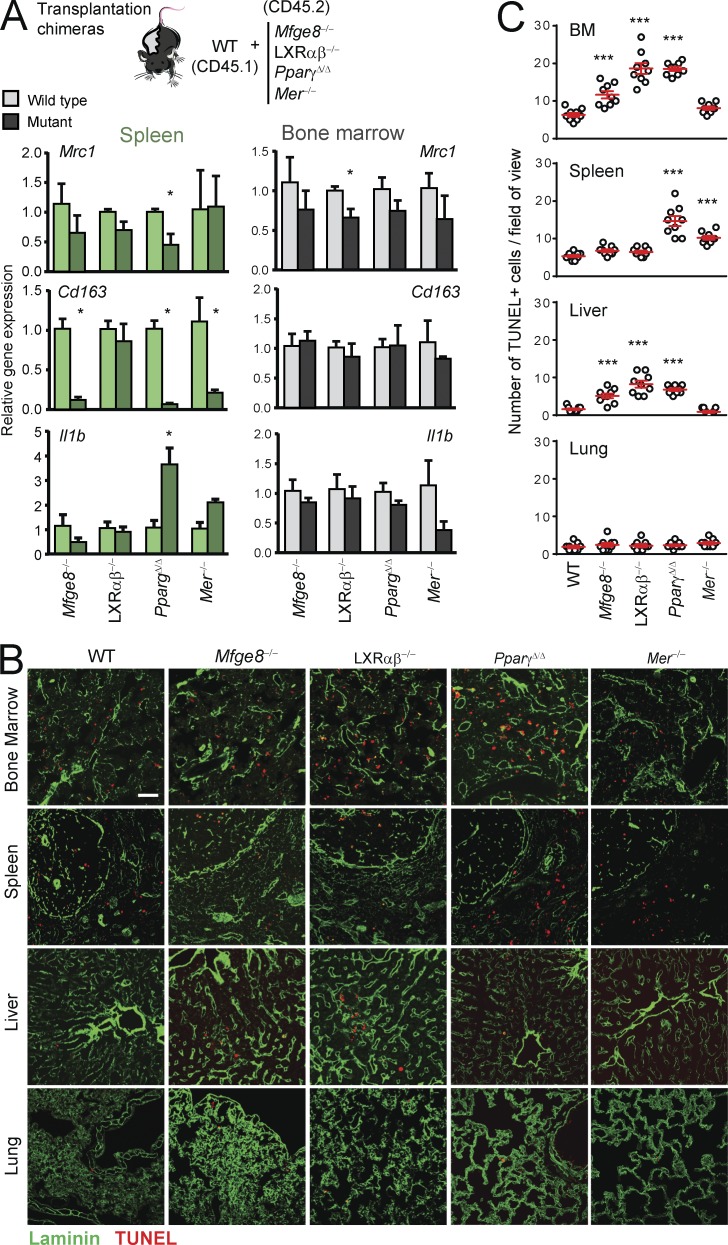
Tissue-resident macrophages display varying phenotypic and functional properties that are largely specified by their local environment. One of these functions, phagocytosis, mediates the natural disposal of billions of cells, but its mechanisms and consequences within living tissues are poorly defined. Using a parabiosis-based strategy, we identified and isolated macrophages from multiple tissues as they phagocytosed blood-borne cellular material. Phagocytosis was circadianally regulated and mediated by distinct repertoires of receptors, opsonins, and transcription factors in macrophages from each tissue. Although the tissue of residence defined the core signature of macrophages, phagocytosis imprinted a distinct antiinflammatory profile. Phagocytic macrophages expressed CD206, displayed blunted expression of Il1b, and supported tissue homeostasis. Thus, phagocytosis is a source of macrophage heterogeneity that acts together with tissue-derived factors to preserve homeostasis.


Figures

Figure 1.
Figure 1.
Identification and characterization of phagocytic macrophages in healthy tissues. (A) Experimental strategy used for the identification of tissue macrophages that engulf blood-borne DsRed+ cells from their parabiotic partners by flow cytometry. Labeling of the differential CD45.1 allele and gain of DsRed identifies phagocytic versus nonphagocytic cells. (B) Representative density plots indicating the frequencies of phagocytic macrophages in different tissues from WT: DsRedTg parabionts; n = 9 pairs from three independent experiments. (C) Giemsa staining showing sorted phagocytic and nonphagocytic macrophages in spleen, bone marrow, and intestine. Bar, 10 µm. (D) Immunofluorescence staining of sorted CD45.1 macrophages from the same tissues showing ingested DsRed+ material from the parabiotic partner (green, F/80 or CD11b; blue, DAPI; red, DsRed). Bars, 10 µm. n = 10 pairs from four independent experiments. (E) Representative immunofluorescence images of tissues with resident macrophages (F4/80, green) and partner-derived target cells (red), some of which are inside macrophages (insets). Bars: 50 µm; (insets) 10 µm. n = 4 pairs. (F) Percentage of cells subsets that uptake DsRed+ material through the parabiotic exchange, within different tissues. Bars show mean ± SEM. CD45NEG cells are also CD31NEG; Neutr., neutrophils; n = 5 pairs from two independent experiments.
Figure 2.
Figure 2.
Tissue-specific dynamics and expression of phagocytic mediators. (A) Frequency of phagocytic macrophages across different tissues in the morning (ZT3) or evening (ZT11). n = 6 per group from two independent experiments. (B) Distribution of partner-derived GFPHI neutrophils from WT: Lyz2GFP parabionts, relative to host macrophages in liver, spleen, and interstitial space of lungs. Data are from 12–46 tissue regions from two to three mice. Micrographs at right show examples of distant, contacting, and engulfed neutrophils from the same parabiotic pairs. (C) Scheme showing molecules associated with phagocytosis of target cells by macrophages. (D) Expression of genes related to phagocytosis in macrophages from bone marrow, spleen, liver, lung (interstitial or alveolar), and large intestine. All bars show mean ± SEM. *, P < 0.05; **, P < 0.01; ***, P < 0.001, as determined by unpaired Student’s t test (A) or one-way ANOVA analysis with Bonferroni correction (B and D). Int and Alv. refer to the interstitial and alveolar space of the lungs, respectively. n = 3 mice from one experiment.
Figure 3.
Figure 3.
Heterogeneous use of phagocytic mediators by tissue macrophages. Experimental scheme (A) and frequency (B) of phagocytic macrophages in different tissues of parabionts of DsRedTg mice with wild-type partners or partners deficient in various genes related to phagocytosis. n = 5–9 pairs from two independent experiments. (C) Histological sections of livers and lungs from the indicating mutants or control mice showing leukocyte infiltrates in Mfge8−/− and LXRαβ−/− mice (insets). Bars: 100 µm: (insets) 25 µm. (D) Expression of the inflammatory chemokines Cxcl19 and Ccl2 in bone marrow, liver, and lungs of LXRαβ−/−, Mfge8−/−, and control mice; n = 3 mice per genotype. (E) Functional heat map of phagocytic mediators according to their contribution across five different tissues, as determined in (B). n = 4 animals per group. All bars show mean ± SEM. *, P < 0.05; **, P < 0.01; ***, P < 0.001, as determined by unpaired Student’s t test. Lung refers to macrophages in the interstitial space of lungs.
Figure 4.
Figure 4.
Distinct transcriptional profile of phagocytic macrophages. (A) Experimental strategy for transcriptomic analysis of phagocytic versus nonphagocytic macrophages. (B) Principal component analysis comparing the transcriptional profile of phagocytic and nonphagocytic macrophages from the bone marrow, spleen, and large intestine. Samples of phagocytic and nonphagocytic macrophages from the same pool of mice are linked by dashed lines. (C) Distance tree illustrating the relative transcriptional proximity of macrophages based on their tissue of residence and phagocytic capacity. For reference, the relative position of in vitro–polarized M0 (M-CSF), M1 (LPS + IFN-γ), and M2 (IL-4 + IL-13) macrophages (obtained from Li et al. [2015]) is shown. (D) K-means clustering (K = 9) of 634 differentially expressed genes in phagocytic (Pha) and nonphagocytic (Non) macrophages; n = 3 samples per group. (E) Validation by quantitative PCR of genes identified in the transcriptomic analyses of phagocytic and nonphagocytic from bone marrow, spleen, and large intestine; n = 5–6 samples per group from two independent experiments. All bars show mean ± SEM. *, P < 0.05; **, P < 0.01, as determined by paired Student’s t test analysis.
Figure 5.
Figure 5.
Prospective identification of phagocytic macrophages by Mrc1/CD206 expression. (A) Heat-map showing normalized expression of Mrc1, CD163, Mertk, and Timd4 in phagocytic (Pha) and nonphagocytic (Non) macrophages. (B) Validation of the data shown in A by quantitative PCR analyses of macrophages sorted from bone marrow, spleen, and large intestine (intest.). n = 5–6 samples per group from two independent experiments. (C) Cytometry plots showing the expression levels of Mrc1/CD206, Tim4, Mer, and CD163 in phagocytic (DsRed+; red contours) and nonphagocytic macrophages (DsRedneg; gray contours) from the bone marrow, spleen, and intestine of WT mice in parabiosis with DsRedTg partners. (D) Representative cytometry plots showing expression of CD206 in macrophages from bone marrow and intestine, and the frequency of phagocytic (DsRed+) macrophages within the CD206+ and CD206neg subsets. n = 6 pairs from two independent experiments. (E) Expression of the genes encoding IL1β and CD163 in CD206+ and CD206neg macrophages sorted from the bone marrow and intestine; n = 6 samples per group from two independent experiments. (F) Cytometry plots showing the frequencies of CD206+ macrophages in the bone marrow of wild-type, PpargΔ/Δ, Mfge8−/−, and LXRαβ−/− mice; n = 3–5. (G) Histograms and relative expression levels of CD206 in bone marrow macrophages from the experiments shown in F. All bars show mean ± SEM. *, P < 0.05; **, P < 0.01; ***, P < 0.001, as determined by paired (B and E) and unpaired (G) Student’s t test analysis.
Figure 6.
Figure 6.
Phagocytosis limits accumulation of dying cells in tissues. (A) Expression in macrophages sorted from the bone marrow and spleen of chimeric mice of genes encoding for factors required for leukocyte recruitment and disposal; n = 3 pairs per group from one experiment. (B) Representative micrographs of tissues stained for apoptotic cells (TUNEL+; red) in bone marrow, spleen, liver, and lung of wild-type and the indicated mutant mice. Laminin (green) stains for tissue vasculature. Bar, 100 µm. (C) Number of TUNEL+ cells per field of view in the different tissues of mutants shown in (B). Bars show mean ± SEM. *, P < 0.05; ***, P < 0.001, as determined by paired Student’s t test (A) or one-way ANOVA with Dunnett’s multiple comparison test (C). Data are from 15–35 tissue regions from three mice.

Similar articles

Cited by

References

    1. A-Gonzalez N., Bensinger S.J., Hong C., Beceiro S., Bradley M.N., Zelcer N., Deniz J., Ramirez C., Díaz M., Gallardo G., et al. . 2009. Apoptotic cells promote their own clearance and immune tolerance through activation of the nuclear receptor LXR. Immunity. 31:245–258. 10.1016/j.immuni.2009.06.018 - DOI - PMC - PubMed
    1. A-Gonzalez N., Guillen J.A., Gallardo G., Diaz M., de la Rosa J.V., Hernandez I.H., Casanova-Acebes M., Lopez F., Tabraue C., Beceiro S., et al. . 2013. The nuclear receptor LXRα controls the functional specialization of splenic macrophages. Nat. Immunol. 14:831–839. 10.1038/ni.2622 - DOI - PMC - PubMed
    1. Arandjelovic S., and Ravichandran K.S.. 2015. Phagocytosis of apoptotic cells in homeostasis. Nat. Immunol. 16:907–917. 10.1038/ni.3253 - DOI - PMC - PubMed
    1. Bosurgi L., Bernink J.H., Delgado Cuevas V., Gagliani N., Joannas L., Schmid E.T., Booth C.J., Ghosh S., and Rothlin C.V.. 2013. Paradoxical role of the proto-oncogene Axl and Mer receptor tyrosine kinases in colon cancer. Proc. Natl. Acad. Sci. USA. 110:13091–13096. 10.1073/pnas.1302507110 - DOI - PMC - PubMed
    1. Brown G.C., Vilalta A., and Fricker M.. 2015. Phagoptosis - cell death by phagocytosis - plays central roles in physiology, host defense and pathology. Curr. Mol. Med. 15:842–851. 10.2174/156652401509151105130628 - DOI - PubMed