

A microRNA-mRNA expression network during oral siphon regeneration in Ciona
- PMID: 28432214
- PMCID: PMC5450834
- DOI: 10.1242/dev.144097
A microRNA-mRNA expression network during oral siphon regeneration in Ciona
Abstract
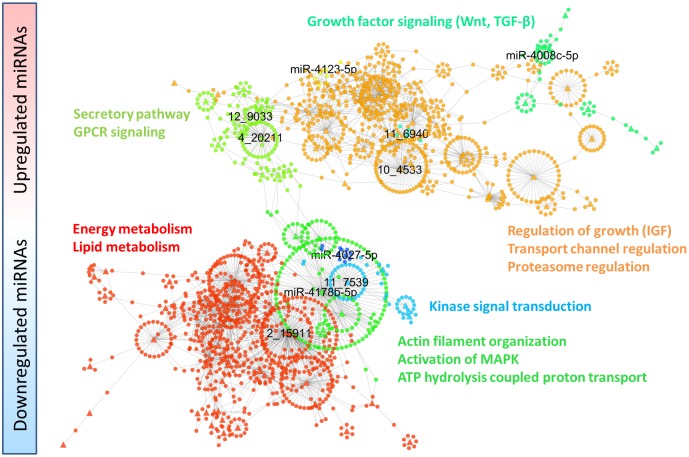
Here we present a parallel study of mRNA and microRNA expression during oral siphon (OS) regeneration in Ciona robusta, and the derived network of their interactions. In the process of identifying 248 mRNAs and 15 microRNAs as differentially expressed, we also identified 57 novel microRNAs, several of which are among the most highly differentially expressed. Analysis of functional categories identified enriched transcripts related to stress responses and apoptosis at the wound healing stage, signaling pathways including Wnt and TGFβ during early regrowth, and negative regulation of extracellular proteases in late stage regeneration. Consistent with the expression results, we found that inhibition of TGFβ signaling blocked OS regeneration. A correlation network was subsequently inferred for all predicted microRNA-mRNA target pairs expressed during regeneration. Network-based clustering associated transcripts into 22 non-overlapping groups, the functional analysis of which showed enrichment of stress response, signaling pathway and extracellular protease categories that could be related to specific microRNAs. Predicted targets of the miR-9 cluster suggest a role in regulating differentiation and the proliferative state of neural progenitors through regulation of the cytoskeleton and cell cycle.
Keywords: Ciona; Correlation network; MicroRNA; RNAseq; Regeneration.
© 2017. Published by The Company of Biologists Ltd.
Conflict of interest statement
Competing interestsThe authors declare no competing or financial interests.
Figures


Similar articles
-
Evolution of the chordate regeneration blastema: Differential gene expression and conserved role of notch signaling during siphon regeneration in the ascidian Ciona.Dev Biol. 2015 Sep 15;405(2):304-15. doi: 10.1016/j.ydbio.2015.07.017. Epub 2015 Jul 20. Dev Biol. 2015. PMID: 26206613 Free PMC article.
-
Computational prediction and experimental validation of Ciona intestinalis microRNA genes.BMC Genomics. 2007 Nov 29;8:445. doi: 10.1186/1471-2164-8-445. BMC Genomics. 2007. PMID: 18047675 Free PMC article.
-
Siphon regeneration capacity is compromised during aging in the ascidian Ciona intestinalis.Mech Ageing Dev. 2012 Sep-Oct;133(9-10):629-36. doi: 10.1016/j.mad.2012.08.003. Epub 2012 Aug 19. Mech Ageing Dev. 2012. PMID: 22935550 Free PMC article.
-
Regeneration, Stem Cells, and Aging in the Tunicate Ciona: Insights from the Oral Siphon.Int Rev Cell Mol Biol. 2015;319:255-82. doi: 10.1016/bs.ircmb.2015.06.005. Epub 2015 Jul 17. Int Rev Cell Mol Biol. 2015. PMID: 26404471 Review.
-
Ciona intestinalis as a model for cardiac development.Semin Cell Dev Biol. 2007 Feb;18(1):16-26. doi: 10.1016/j.semcdb.2006.12.007. Epub 2006 Dec 20. Semin Cell Dev Biol. 2007. PMID: 17223594 Free PMC article. Review.
Cited by
-
Progenitor targeting by adult stem cells in Ciona homeostasis, injury, and regeneration.Dev Biol. 2019 Apr 15;448(2):279-290. doi: 10.1016/j.ydbio.2018.09.005. Epub 2018 Sep 8. Dev Biol. 2019. PMID: 30205080 Free PMC article.
-
Molecular characterization of the immediate wound response of the solitary ascidian Polycarpa mytiligera.Dev Dyn. 2022 Dec;251(12):1968-1981. doi: 10.1002/dvdy.526. Epub 2022 Sep 19. Dev Dyn. 2022. PMID: 36001356 Free PMC article.
-
JmjC Domain-Encoding Genes Are Conserved in Highly Regenerative Metazoans and Are Associated with Planarian Whole-Body Regeneration.Genome Biol Evol. 2019 Feb 1;11(2):552-564. doi: 10.1093/gbe/evz021. Genome Biol Evol. 2019. PMID: 30698705 Free PMC article.
-
Regeneration Roadmap: database resources for regenerative biology.Nucleic Acids Res. 2022 Jan 7;50(D1):D1085-D1090. doi: 10.1093/nar/gkab870. Nucleic Acids Res. 2022. PMID: 34591960 Free PMC article.
-
Development of a miRNA Sensor by an Inducible CRISPR-Cas9 Construct in Ciona Embryogenesis.Mol Biotechnol. 2021 Jul;63(7):613-620. doi: 10.1007/s12033-021-00324-9. Epub 2021 Apr 20. Mol Biotechnol. 2021. PMID: 33880702
References
Publication types
MeSH terms
Substances
Grants and funding
LinkOut - more resources
Full Text Sources
Other Literature Sources
