. 2017 May 23;8(21):34896-34910.
doi: 10.18632/oncotarget.16820.

Small molecules targeting histone demethylase genes (KDMs) inhibit growth of temozolomide-resistant glioblastoma cells

Affiliations

Small molecules targeting histone demethylase genes (KDMs) inhibit growth of temozolomide-resistant glioblastoma cells

Barbara Banelli et al. Oncotarget. .

Abstract

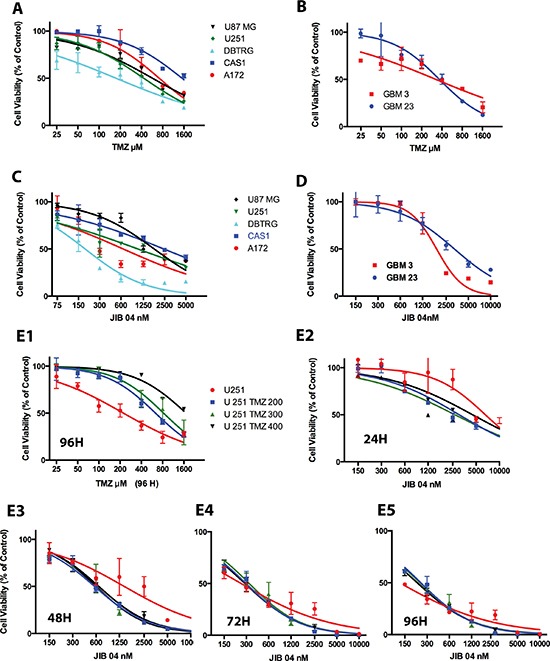
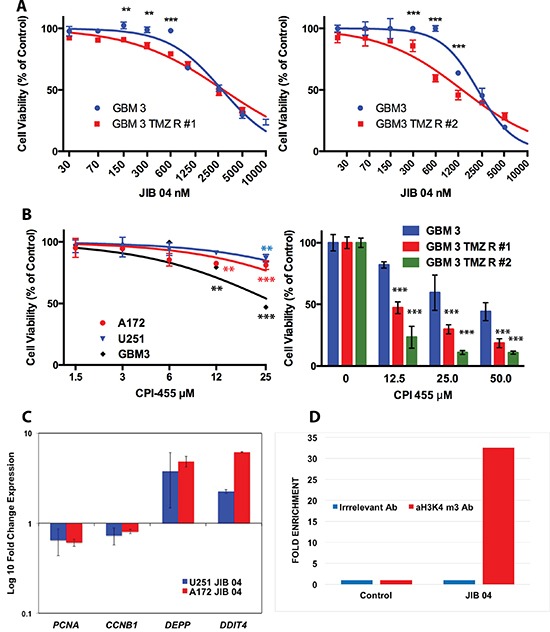
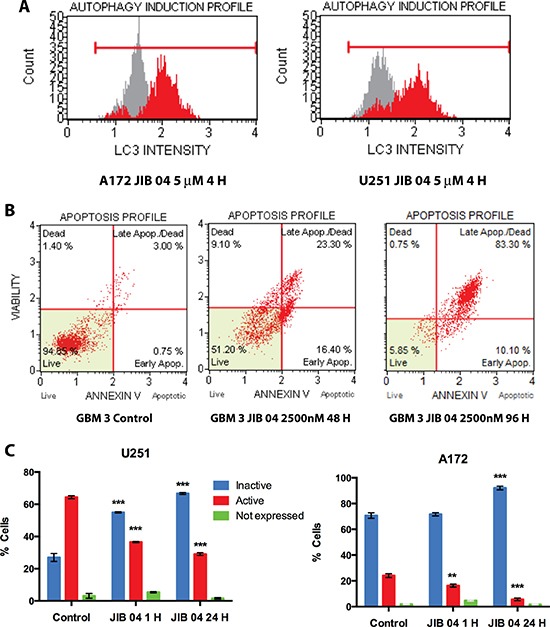
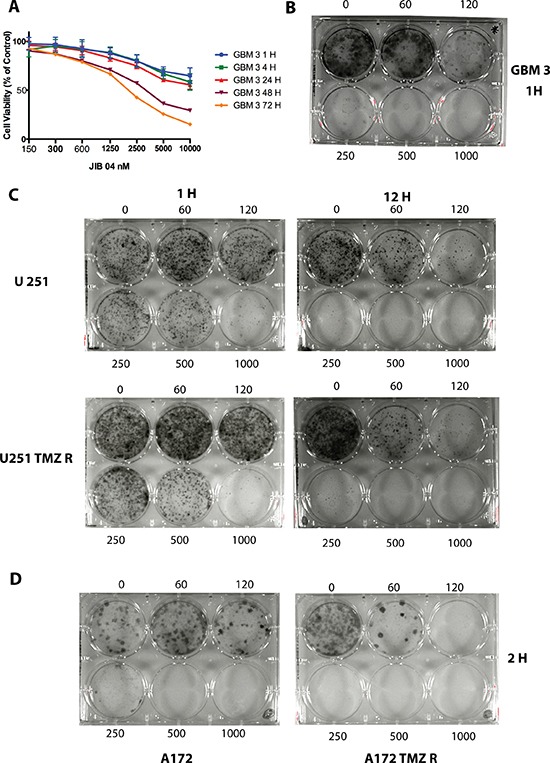
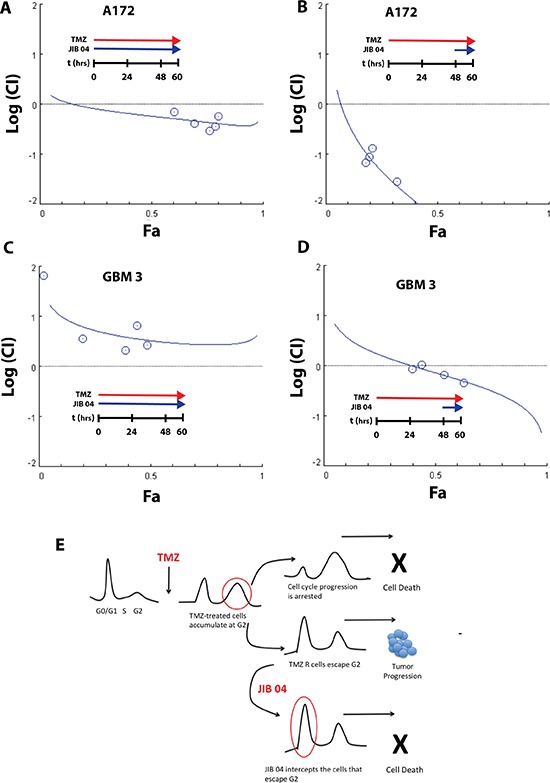
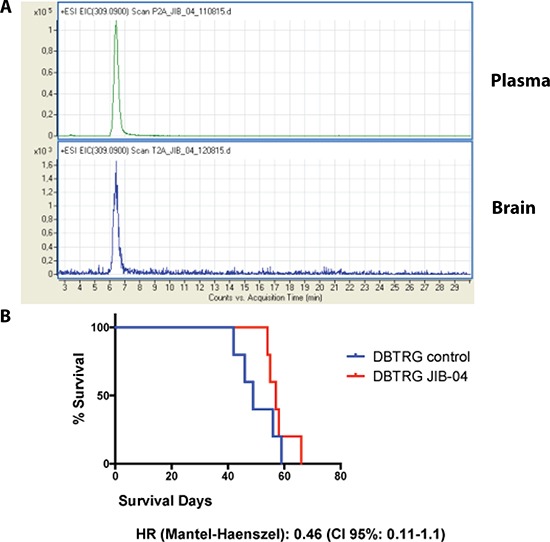
In glioblastoma several histone demethylase genes (KDM) are overexpressed compared to normal brain tissue and the development of Temozolomide (TMZ) resistance is accompanied by the transient further increased expression of KDM5A and other KDMs following a mechanism that we defined as "epigenetic resilience". We hypothesized that targeting KDMs may kill the cells that survive the cytotoxic therapy.We determined the effect of JIB 04 and CPI-455, two KDM inhibitors, on glioblastoma cells and found that both molecules are more effective against TMZ-resistant rather than native cells.Because of its lower IC50, we focused on JIB 04 that targets KDM5A and other KDMs as well. We have shown that this molecule activates autophagic and apoptotic pathways, interferes with cell cycle progression, inhibits cell clonogenicity and dephosphorylates Akt thus inactivating a potent pro-survival pathway. We performed combination temozolomide/JIB 04 in vitro treatments showing that these two molecules, under certain conditions, have a strong synergic effect and we hypothesize that JIB 04 intercepts the cells that escape the G2 block exerted by TMZ. Finally we studied the permeability of JIB 04 across the blood-brain barrier and found that this molecule reaches bioactive concentration in the brain; furthermore a pilot in vivo experiment in an orthotopic GB xenograft model showed a trend toward longer survival in treated mice with an Hazard Ratio of 0.5.In conclusion we propose that the combination between cytotoxic drugs and molecules acting on the epigenetic landscape may offer the opportunity to develop new therapies for this invariably lethal disease.

Keywords: drug resistance; epigenetics; glioblastoma; histone demethylase; temozolomide.


Conflict of interest statement

CONFLICTS OF INTEREST

None of the Authors has any conflicts of interest that could have biased the work and the funding agencies had no role in the conduction of the experimental work neither in the interpretation of the results.

Figures

Figure 1
Figure 1. Effect of TMZ and JIB 04 on native GB primary cultures and cell lines
(Panel A) Activity of TMZ on a panel of GB cell lines measured by MTS. Each point represents the mean value of three replicates. Treatment time: 72 hours. IC50 values were: A172 731μM; CAS1 1544 μM; DBTRG 175 μM; U87 MG 573 μM; U251 431 μM. (Panel B) Activity of TMZ on stem-enriched GB cells primary cultures measured by MTS. Treatment time: 72 hours. Each point represents the mean value of three replicates. IC50 values were: GBM3 324 μM; GBM 23 356 μM. The statistical significance of the effect of TMZ on cell viability (Panels A and B) is reported in Supplementary Table 1A. (Panel C) MTS analysis of GB cell lines exposed for 48 hours to JIB 04. Each point represents the mean value of three replicates. IC50 values were: A172 647 nM; CAS1 2400 nM; DBTRG 186 nM; U251 1047 nM; U87 MG 1784 nM. (Panel D) MTS analysis of patient's-derived GB primary culture exposed for 96 hours to JIB 04. Each point represents the mean value of three replicates. IC50 values: GBM 3 1860 nM, GBM 23 3200 nM. The statistical significance of the effect of JIB 04 on cell viability (Panels C and D) is reported in Supplementary Table 1B. (Panels E1E5) RealTime-Glo MT analysis of U251 cells exposed to TMZ or JIB 04. U251 TMZ 200, TMZ 300 and TMZ 400 are U251 cells made resistant to TMZ after growth in 200, 300 or 400 μM TMZ. Each datapoint represents the average of three replicates and two separate experiments. IC50 values and significance of the observed differences is reported in Supplementary Figure 1, Panels 1B and 1C.
Figure 2
Figure 2. Effect of JIB 04 and CPI 455 on TMZ resistant GB cell lines and primary cultures and effect of JIB 04 on gene expression and H3 methylation
(Panel A) Effect of JIB 04 on two TMZ resistant derivatives of the GBM3 stem-enriched culture obtained independently at a distance of one year. Treatment time 96 hours. Each datapoint represents the mean of triplicate assays. Significance of the difference of TMZ resistance between native and TMZ R cells was determined by ANOVA with the Bonferroni's correction for multiple comparisons and is indicated for each point (*P = 0.05; **P = 0.01; ***P = 0.001). (Panel B left): sensitivity of GB cells to the selective KDM5 inhibitor CPI 455 evaluated by MTS. Treatment time 120 hours. The significance of the difference between treated and control cells was determined by ANOVA as described for Panel A. (Panel B right): sensitivity of two independent TMZ resistant derivatives of the GBM3 stem-enriched culture to CPI 455 evaluated by MTS. Treatment time 120 hours. The significance of the difference between TMZ-resistant and native cells treated with the same concentration of CPI 455 was determined by ANOVA as described for Panel A. (Panel C) Expression of CCNB1, PCNA, DEPP and DDIT4 genes in A172 and U251 cells exposed to JIB 04 for 4 hours normalized against untreated cells (fold-change = 1.0). (Panel D) Chromatin immunoprecipitation of A172 cells exposed to JIB 04 for 4 hours with an antibody against H3K4 me3 and with an irrelevant antibody. The immunoprecipitated was then amplified by qPCR with a set of primers for the promoter region of DEPP and the results show a > 30 fold enrichment for H3K4me3 over the irrelevant antibody only in the JIB 04 treated cells.
Figure 3
Figure 3. Functional effects of JIB 04 treatment on GB cells
(Panel A) Cytofluorimetric analysis of LC3 translocation into autophagosomes upon treatment of GB A172 and U251 cells with JIB 04 for 4 hours. Red and gray profiles represent the test and control sample, respectively. Autophagy induction is the ratio between the mean autophagy intensity of the treated sample and that of the untreated, control sample. (Panel B) scatterogram of Annexin V staining of GBM 3 cells upon treatment with JIB 04 (2500 nM) for 48 and 96 hours. (Panel C) Flow-cytometry analysis of Akt phosphorylation after 1 and 24 hours of treatment with JIB04 of U251 and A172 cells. These plots show the presence of significant decrease in the phosphorylation of Akt indicating inactivation of the PI3K pathway. Each datapoint represents the mean value of two experiments. The significance of the differences respect the untreated cells was calculated determined by ANOVA with the Bonferroni's correction for multiple comparisons and is indicated for each point (*P = 0.05; **P = 0.01; ***P = 0.001).
Figure 4
Figure 4. JIB 04 is a fast-acting molecule that inhibits clonogenicity
(Panel A) Kinetic of JIB 04 activity on GBM3 cells at 1, 4, 24, 48 and 72 hours of treatment showing that the reduction of cell vitality becomes evident after 1 hour of treatment at the highest molecule concentrations. The significance of the effect of JIB 04 respect untreated cells at each time point for each dose of the molecule is reported in Supplementary Table 3. (Panel B) Clonogenicity of the GBM3 stem-enriched culture after 1 hour treatment with JIB 04. Range of concentrations: 60–1000 nM). (Panel C) Clonogenicity of U251 (upper part of the panel) and of U251 TMZ R (lower part) GB cells after 1 and 12 hours treatment with JIB 04. Range of concentrations 60–1000 nM. (Panel D) Clonogenicity of A172 (left) and of A172 TMZ R (right) GB cells after 2 hours treatment with JIB 04. Range of concentrations 60–1000 nM.
Figure 5
Figure 5. Synergy between JIB 04 and TMZ
(Panel A) Plot of the log(CI) index vs. the effect (Fa) of JIB 04 treatment of A172 cells. The effect considered was the induction of apoptosis measured by Annexin V staining. Each data point represents the mean of duplicate analysis. Cells were incubated for 60 hours with a constant ratio of the two molecules (JIB 04 = 1; TMZ = 500). The plot of the CI indicates a moderate synergy between the two molecules. (Panel B) same as Panel A except that the cells were incubated for 48 hours with TMZ alone, and for 12 hours with TMZ and JIB 04. The ratio between JIB 04 and TMZ was the same of Panel A. The plot of the CI indicates a very strong synergy between the two molecules. (Panel C) Plot of the log(CI) index vs the effect (Fa) of JIB 04 treatment on GBM 3 primary GB cultures. The effect considered was the cell vitality measured by MTS. Each data point represents the men of triplicate analysis. Cells were incubated for 60 hours with a constant ratio of the two molecules (JIB 04 = 1; TMZ = 500). The plot of the CI indicates a modest to moderate antagonism between the two molecules. (Panel D) same as Panel C except that the cells were incubated for 48 hours with TMZ alone, followed by 12 hours with TMZ and JIB 04. The ratio between JIB 04 and TMZ was the same of Panel C. The plot of the CI indicates an additive effect at the lowest concentration and moderate synergy between the two molecules at higher concentrations. (Panel E) Working hypothesis on the mechanism of the combined effect of JIB 04 and TMZ. TMZ blocks the cell cycle at the G2 checkpoint. The cells that acquire TMZ resistance can pass G2 and resume proliferation. JIB 04 target these cycling cells cooperating with TMZ (see also Supplementary Figure 4 for the effect of JIB 04 on cell cycle).
Figure 6
Figure 6. In vivo analysis of JIB 04
(Panel A) M Pharmacokinetics of JIB-04: extracted ion current of m/z 309.09 [M+H]+ in plasma and brain extracts of mice treated for 5 days with 60 mg/kg of JIB 04. The presence of an identical peak corresponding to JIB 04 (see Supplementary Figure 5) in the two extracts indicates the passage of the molecule through the blood brain barrier. (Panel B) Kaplan-Maier plots of 10 mice orthotopically xenografted with DBTRG cells treated with JIB 04 (N: 5) or with placebo (N: 5). The hazard ratio of the mice treated with JIB 04 is 0.5.

References

    1. Ellis HP, Greenslade M, Powell B, Spiteri I, Sottoriva A, Kurian KM. Current Challenges in Glioblastoma: Intratumour Heterogeneity, Residual Disease, and Models to Predict Disease Recurrence. Frontiers in oncology. 2015;5:251. - PMC - PubMed
    1. Florio T, Barbieri F. The status of the art of human malignant glioma management: the promising role of targeting tumor-initiating cells. Drug Discov Today. 2012;17:1103–1110. - PubMed
    1. Friedman HS, Kerby T, Calvert H. Temozolomide and treatment of malignant glioma. Clin Cancer Res. 2000;6:2585–2597. - PubMed
    1. Stupp R, Mason WP, van den Bent MJ, Weller M, Fisher B, Taphoorn MJ, Belanger K, Brandes AA, Marosi C, Bogdahn U, Curschmann J, Janzer RC, Ludwin SK, et al. European Organisation for Research and Treatment of Cancer Brain Tumor and Radiotherapy Groups, and National Cancer Institute of Canada Clinical Trials Group. Radiotherapy plus concomitant and adjuvant temozolomide for glioblastoma. N Engl J Med. 2005;352:987–996. - PubMed
    1. Hegi ME, Diserens AC, Gorlia T, Hamou MF, de Tribolet N, Weller M, Kros JM, Hainfellner JA, Mason W, Mariani L, Bromberg JE, Hau P, Mirimanoff RO, et al. MGMT gene silencing and benefit from temozolomide in glioblastoma. N Engl J Med. 2005;352:997–1003. - PubMed

MeSH terms