. 2017 Apr 21;7(1):1019.
doi: 10.1038/s41598-017-01023-9.

Quiescence of adult oligodendrocyte precursor cells requires thyroid hormone and hypoxia to activate Runx1

Affiliations

Quiescence of adult oligodendrocyte precursor cells requires thyroid hormone and hypoxia to activate Runx1

Yasuhito Tokumoto et al. Sci Rep. .

Abstract

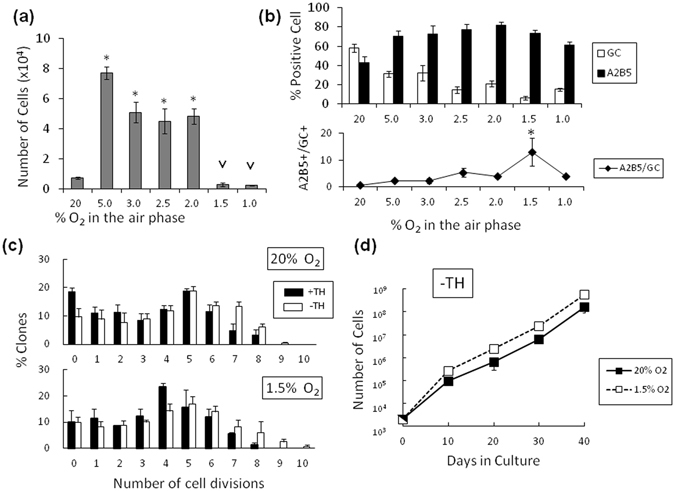
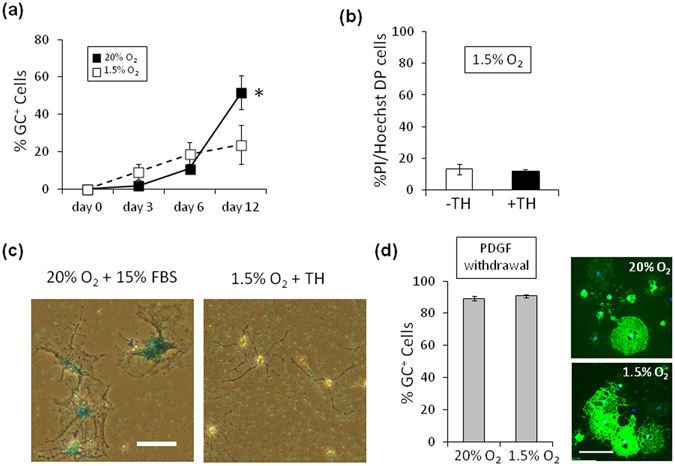
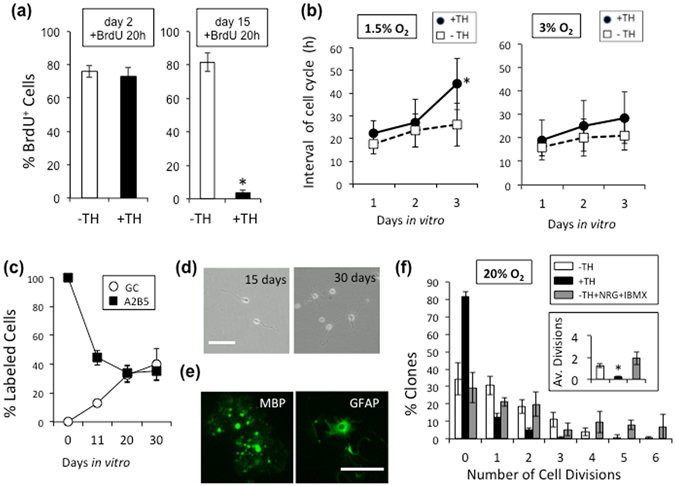
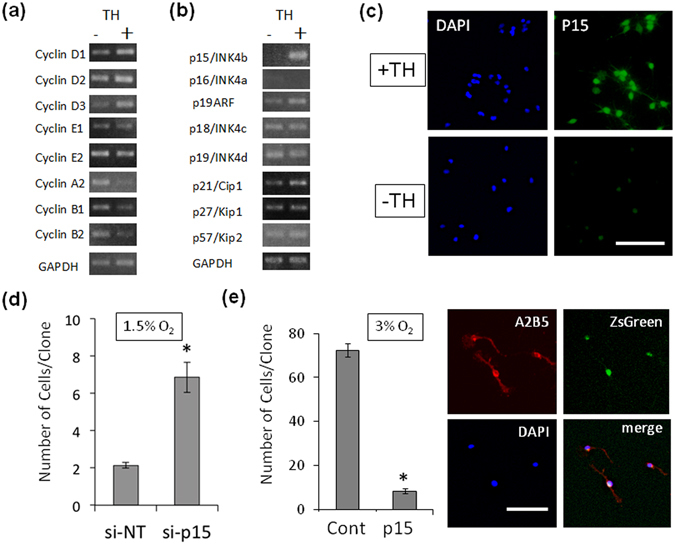
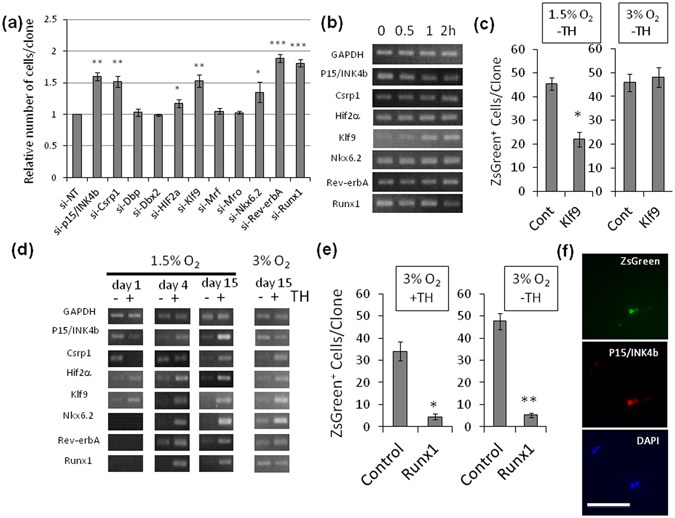
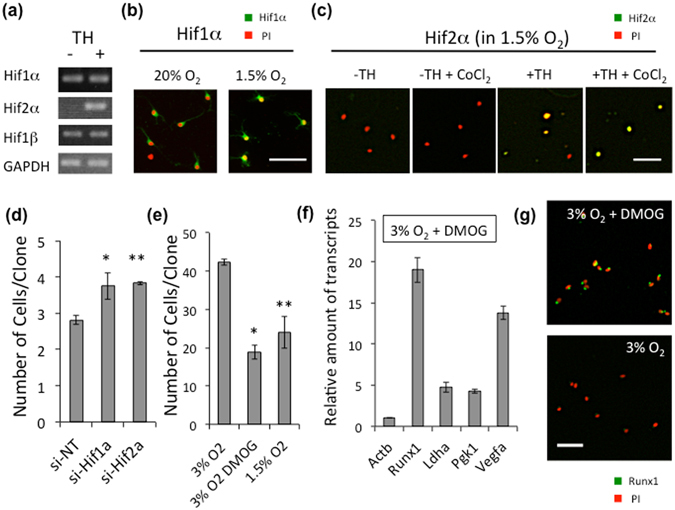
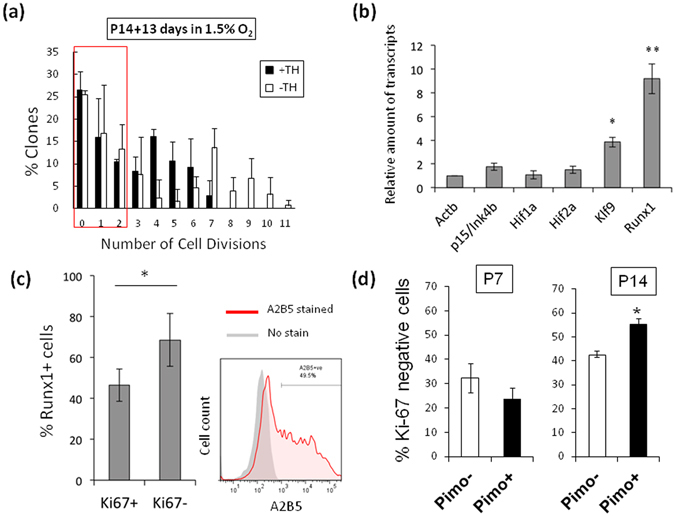
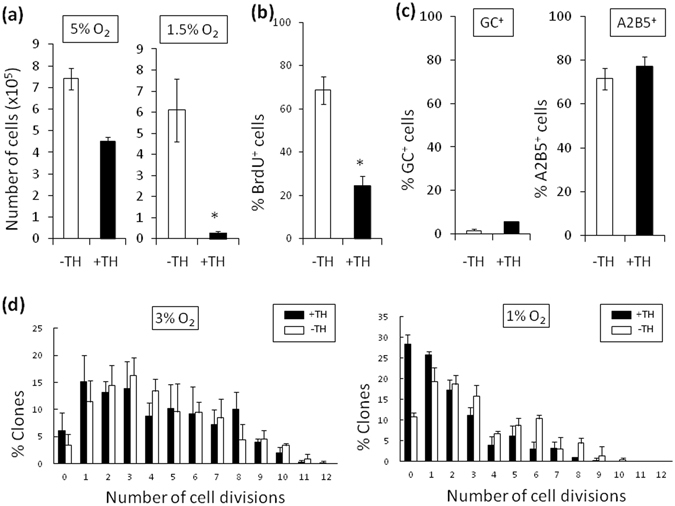
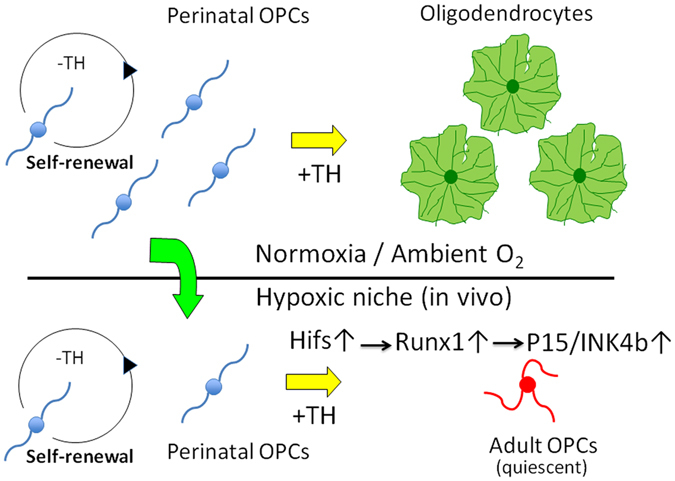
The adult mammalian central nervous system (CNS) contains a population of slowly dividing oligodendrocyte precursor cells (OPCs), i.e., adult OPCs, which supply new oligodendrocytes throughout the life of animal. While adult OPCs develop from rapidly dividing perinatal OPCs, the mechanisms underlying their quiescence remain unknown. Here, we show that perinatal rodent OPCs cultured with thyroid hormone (TH) under hypoxia become quiescent and acquire adult OPCs-like characteristics. The cyclin-dependent kinase inhibitor p15/INK4b plays crucial roles in the TH-dependent cell cycle deceleration in OPCs under hypoxia. Klf9 is a direct target of TH-dependent signaling. Under hypoxic conditions, hypoxia-inducible factors mediates runt-related transcription factor 1 activity to induce G1 arrest in OPCs through enhancing TH-dependent p15/INK4b expression. As adult OPCs display phenotypes of adult somatic stem cells in the CNS, the current results shed light on environmental requirements for the quiescence of adult somatic stem cells during their development from actively proliferating stem/progenitor cells.


Conflict of interest statement

The authors declare that they have no competing interests.

Figures

Figure 1
Figure 1
The proliferation and differentiation of purified P7 rat OPCs in clonal-density cultures containing PDGF and TH depends on the O2 concentration. (a) 2,000 of P7 OPCs were cultured in 1–20% O2 for 10 days, and the number of cells was counted. The P value of the cell number compared that of in 20% O2 conditions are shown *P < 0.05 (ANOVA with Fisher’s LSD test, n = 3), and compared that of in 2% O2 conditions are shown VP < 0.05 (ANOVA, n = 3). (b) The cells in (a) were stained with anti-GC or A2B5 antibody, and the percentage of GC+ cells (white bars) and A2B5+ cells (black bars) was determined (upper panel). And the ratios of A2B5+ versus GC+ are shown in the lower panel. *P < 0.05 (ANOVA with Fisher’s LSD test, n = 3). (c) Clonal analysis of P7 OPCs cultured at clonal-density in PDGF in 20% or 1.5% O2 with TH (black bars) or without TH (white bars). After 11 days, the number of cells in each clone was counted and the number of cell divisions was estimated (n = 3). (d) P7 OPCs were cultured in PDGF without TH in either 20% O2 (closed squares) or 1.5% O2 (open squares) and were passaged every 10 days (1,000 cells per T25 flask). Cell numbers were estimated from the total cell number at the last passage multiplied by the proliferation rate (n = 3).
Figure 2
Figure 2
Hypoxia does neither induce cell death and replicative senescence, nor inhibit OL differentiation. (a) P7 OPCs cultured in PDGF and TH, in either 20% O2 (closed squares) or 1.5% (open squares), were stained for GC after 3, 6 and 12 days, and the % of GC+ cells were counted at each time point. *P < 0.05 (unpaired Student’s t-test, n = 3). (b) P7 OPCs were cultured in PDGF, without TH (-TH, white bar) or with TH (+TH, black bar), in 1.5% O2 for 15 days, and the percentage of dead cells (PI+, Hoechst 33342+ double positive cells) was determined (n = 3). (c) P7 OPCs were cultured in PDGF and TH in 1.5% O2 for 20 days and stained for SA-βGal (left panel); as a positive control, P7 OPCs cultured in 15% FBS in 20% O2 for 20 days to induce replicative senescence were also stained for SA-βGal (right panel). Scale bar: 50 μm. (d) Freshly purified P7 OPCs were cultured in the absence of PDGF for 3 days, in either 20% O2 (upper right panel) or 1.5% O2 (lower right panel), and were labeled with anti-GC antibody (green) and DAPI (blue). Scale bar: 100 μm. Percentages of GC+ cells in 20% O2 culture and 1.5% O2 culture are shown in the graph on the left (n = 3). Note that rat OL differentiation obeying withdrawal of PDGF is not inhibited in 1.5% O2, the extensions of GC+ membrane-like structure around the cell body in 1.5% O2 were comparable with those in 20% O2.
Figure 3
Figure 3
Hypoxia converts perinatal OPCs to adult-like OPCs in culture. (a) After 2 or 15 days, with TH (+TH; black bars) or without TH (-TH; white bars), the P7 OPCs cultured in 1.5% O2 condition were treated with BrdU for 20 hours and then the % of BrdU+ cells was determined. *P < 0.001. (b) Freshly prepared P7 OPCs were plated in PDGF, with TH (closed circles) or without TH (open squares) and in either 1.5% or 3% O2 cultured for 24 hours, after which they were followed by time-lapse video microscopy. The average time between M-phases was estimated on day 1 (0–23.5 hours), day 2 (24–47.5 hours), and day 3 (48–71.5 hours). At the start of image recording, the following number of cells were analyzed: 42 in 1.5% O2 with TH; 48 in 1.5% O2 without TH; 131 in 3% O2 with TH; 89 in 3% O2 without TH. *P < 0.05. (c) After P7 OPCs were cultured at clonal-density for 11, 20 or 30 days in PDGF, TH, and 1.5% O2, the cells were labeled with anti-GC and A2B5 monoclonal antibodies and the percent of each type of labeled cells was determined. (d) P7 OPCs were cultured in PDGF and TH in 1.5% O2 for 15 or 30 days, and representative fields were examined by phase-contrast microscopy. Scale bar: 50 μm. (e) P7 OPCs cultured for 15 days as in (d) were then either deprived of PDGF for 5 days and labeled for MBP or treated with 10% FBS for 5 days and labeled for GFAP. Scale bar: 100 μm. (f) P7 OPCs cultured in PDGF and TH in 1.5% O2 for 15 days were removed and re-cultured at clonal-density for another 7 days in PDGF in 20% O2 — without TH (white bars), with TH (black bars), or without TH in the presence of NRG1 (50 ng/ml) and IBMX (100 μM) (gray bars). The average numbers of cell divisions are show in the inset (1.24 ± 0.18 without TH; 0.24 ± 0.60 with TH; 1.95 ± 0.60 without TH, but with NRG1 and IMBX). *P < 0.001.
Figure 4
Figure 4
An increase in p15/INK4b in hypoxic OPCs in culture helps mediate the TH-dependent G1 arrest of OPCs. (a and b) P7 OPCs were cultured in 1.5% O2 in PDGF, with or without TH, for 15 days, and assayed by RT-PCR. GAPDH was used as an internal control. (a) In Cyclin genes, TH decreased the mRNA for G2/M Cyclins A2, B1 and B2. (b) In CKI genes, TH strongly increased the mRNA for p15/INK4b. (c) P7 OPCs were cultured in PDGF without TH for 10 days in 1.5% O2, and then TH was added to some cultures (+TH) but not to others (−TH) for 2 days. The cells were then labeled with rabbit anti-p15/INK4b antibodies (green) and DAPI (blue). Note that p15/INK4b protein increased in the nucleus of the TH-treated cells. Scale bar: 100 μm. (d) P7 OPCs cultured in 3% O2 in PDGF without TH for 12 days were co-transfected with anti-p15/INK4b siRNA (si-p15) and GFP expressing transfection-reporter plasmid DNA (pMaxGFP); a non-targeting siRNA pool (si-NT) served as a negative control. Cells were re-cultured at clonal-density in 1.5% O2, PDGF and TH for another 5 days. The number of GFP+ cells in each clone was counted. Note that the anti-p15/INK4b siRNA prevented the deceleration of cell cycle that occurs in 1.5% O2 in the presence of TH. *P < 0.001 (unpaired Student’s t-test, n = 3). (e) Freshly prepared P7 OPCs were infected with either a p15/INK4b-IRES-ZsGreen expressing retrovirus vector (p15) or the ZsGreen expressing empty vector as a negative control (Cont), and the cells were cultured at clonal-density in 3% O2 and PDGF without TH for 7 days. The number of ZsGreen+ cells in each clone was counted, and the results are shown in the graph on left. Note that the cells over expressing p15/INK4b proliferated much less than control. *P < 0.001 (unpaired Student’s t-test, n = 3). The p15/INK4b-IRES-ZsGreen expressing cells were also labeled with A2B5 antibody (red) and DAPI (blue); as shown in the panels on right, the ZsGreen+ OPCs (green) are bipolar and A2B5+. Scale bar: 100 μm.
Figure 5
Figure 5
Runx1 dictates the cell cycle deceleration of OPCs in hypoxia. (a) P7 rat OPCs were cultured without TH in 1.5% O2 conditions for 12 days, then the cells were co-transfected with anti-p15/INK4b siRNA (si-p15/INK4b) or siRNA against the gene of each transcription factor and pMaxGFP. Cells were cultured with TH in 1.5% O2 conditions for another 4 days. The number of GFP+ cells in each clone was counted. Data was normalized against the average number of negative control (cells transfected with non-target siRNA; si-NT). *P < 0.05, **P < 0.01, ***P < 0.001 (unpaired Student’s t-test, n = 3). (b) To investigate the immediate early responses of the genes of the deceleration of cell cycle related transcription factors, P7 rat OPCs cultured without TH for 10 days in 1.5% O2 were pre-treated with cycloheximide (50 μg/ml) for 6 hours, after then TH was added to the medium. Cells were harvested at 0, 0.5, 1 and 2 hours later. RT-PCR assay was carried out. GAPDH was used as a negative control. (c) P7 rat OPCs were infected with retrovirus vector Klf9-IRES-ZsGreen and were cultured for 7 days without TH in 1.5% or 3% O2 conditions. Cont; empty vector RetroX-IRES-ZsGreen1 infected OPCs, Klf9; Klf9 over expressing cells. *P < 0.001 (unpaired Student’s t-test, n = 3). (d) P7 rat OPCs cultured with (+) or without TH (−) in 1.5% O2 for 1, 4 and 15 days, or in 3% O2 for 15 days. Then RT-PCR assay was carried out. GAPDH was used as an internal control. (e) Freshly prepared P7 OPCs were cultured without TH in 3% O2 conditions overnight. Then cells were infected with Runx1 (Runx1b-IRES-ZsGreen) over-expressing retrovirus vector (Runx1) or ZsGreen expressing empty vector (Control). Cells were cultured for 7 days with or without TH in 3% O2. The number of ZsGreen+ cells in each clone was counted. *P < 0.005, **P < 0.001 (unpaired Student’s t-test, n = 3). (f) OPCs overexpressing Runx1 (green) in (d) were stained with the nuclear stain DAPI (blue) and rabbit anti-p15/INK4b antibodies (red). Scale bar: 100 μm.
Figure 6
Figure 6
Stabilization of Hifα proteins permits TH-dependent Runx1 gene expression. (a) P7 OPCs cultured in 1.5% O2 in PDGF, with (+) or without TH (−), for 15 days were assayed gene expressions of Hifs by RT-PCR. (b) P7 OPCs were cultured in 20% O2 in PDGF without TH for 7 days, and some were then changed to 1.5% O2 for 20 hours. The cells were labeled with rabbit anti-Hif1α antibodies (green) and PI (red). Scale bar: 50 μm. (c) P7 OPCs were cultured in 1.5% O2 in PDGF with (+TH) or without TH (−TH) for 10 days. The cells were labeled with rabbit anti-Hif2α antibodies (green) and PI (red). To prevent the degradation of Hif2α protein, some cultures were treated with 0.2 mM of CoCl2 for last 7 hours. Scale bar: 50 μm. (d) P7 rat OPCs were cultured without TH in 1.5% O2 conditions for 12 days, then co-transfected with anti-Hif1α siRNA or anti-Hif2α siRNA and pMaxGFP. Cells were cultured with TH in 1.5% O2 conditions for another 4 days. The number of GFP+ cells in each clone was counted. si-NT; non-target siRNA, si-Hif1a; anti-Hif1α siRNA, si-Hif2a; anti-Hif2α siRNA. *P < 0.05, **P < 0.01. (e) Freshly prepared OPCs from P7 rat optic nerve were cultured with TH in 1.5% O2 or 3% O2 conditions. For several flasks in 3% O2, DMOG (1 mM) was added. After 7 days, the number of cells in each clone was counted. *P < 0.005, **P < 0.05. (f) P7 rat OPCs cultured in 3% O2 with TH were treated with DMOG (1 mM) for 24 hours. Then qRT-PCR analysis was carried out. Results were presented as the relative amount of transcripts to that of the DMOG free culture using comparative ∆∆Ct method. Actb is an endogenous negative control. Ldha, Pgk1 and Vegfa are HIFs-inducible positive control. The P values of these genes are P < 0.001 (ANOVA with Fisher’s LSD test, n = 3). (g) After 24 hours of DMOG treatment, OPCs (3% O2 + TH) were stained with rabbit anti-Runx1 antibodies (green) and PI (red). Scale bars; 50 μm.
Figure 7
Figure 7
Relevance of adult-like OPCs in culture and adult OPCs in P14 rat optic nerves. (a) Clonal analysis of P14 A2B5+/GC OPCs cultured at clonal-density in PDGF in 1.5% O2 with TH (black bars) or without TH (white bars). After 13 days, the number of cells in each clone was counted and the number of cell divisions was estimated (n = 3). Around 50% of clones contained the cells of which divided less than two times are shown in red square. (b) P7 OPCs and P14 OPCs were purified from rat optic nerve and their total RNA were prepared immediately. qRT-PCR analysis was carried out. The resulting values were normalized to the endogenous control gene, Actb. Results of P14 OPCs are presented as the relative expression to those of P7 OPCS using the ∆∆Ct methods. *P < 0.001, **P < 0.001 (ANOVA with Fisher’s LSD test, n = 3). (c) GC-negative optic nerve cells prepared from P14 rat were sorted with A2B5 monoclonal antibody (right panel). These GC/A2B5+ were stained for Runx1 and Ki-67 and examined in immunochemistry. The percentages of Runx1 expressing cells in Ki-67+ or Ki-67 cells are shown (left graph). *P < 0.01 (unpaired Student’s t-test, n = 10). (d) Pimonidazole was injected intraperitoneally into P7 rats or P14 rats. 2 hours later, OPCs were purified from the rat optic nerves. These cells were stained for pimonidazole and Ki-67. The percentages of Ki-67 OPCs that were Pimo (white bars) or Pimo+ (black bars) at P7 and P14 are shown. *P < 0.001 (unpaired Student’s t-test, n = 4).
Figure 8
Figure 8
TH-dependent deceleration of cell cycle of OPCs purified from P7 rat cerebral cortex or P7 mouse optic nerve. Purification of OPCs from P7 rat cerebral cortex was carried out obeying Dugas et al.. 2,000 of OPCs were cultured without TH (−TH; white bars) or with TH (+TH; black bars). (a) Cells were cultured in 5% O2 or 1.5% O2. The numbers of cells were counted at day 11. 0.01 < *P < 0.02 (unpaired Student’s t-test, n = 3). (b) Cells cultured in 1.5% O2 for 10 days were treated with BrdU for 20 hours and then labeled with anti-BrdU antibody and Hoechst 33342 dye, and the percentage of BrdU+ cells was determined. *P < 0.01 (unpaired Student’s t-test, n = 3). (c) Cells were cultured in 1.5% O2 for 11 days. They were then stained with the nuclear stain DAPI and a monoclonal anti-GC or A2B5 antibody, and the percentage of the DAPI+ cells that were GC+ or A2B5+ was determined (unpaired Student’s t-test, n = 3). Note that most of the cells cultured were remained OPC specific morphologies with GC, A2B5+. (d) OPCs were purified from P7 C57BL/6 mouse optic nerve by immunopanning according to Watkins et al. and cultured at clonal-density according to Durand et al.. The cells were cultured for 12 days in PDGF, with TH (black bars) or without TH (white bars), in either 3% or 1% O2. The number of cell divisions was estimated from the cell numbers in each clone (n = 3).
Figure 9
Figure 9
A schematic diagram of perinatal to adult transition of OPCs. In developing rat optic nerves, thyroid hormone inhibits the proliferation of perinatal OPCs. In normoxia, cells differentiate into oligodendrocytes. On the other hand, in a hypoxic niche, quiescent OPCs sustain their potential capacities of proliferation and differentiation as adult somatic stem cells (Adult OPCs). Hypoxia-inducible factors-mediated Runx1 expression and resultant p15/INK4b induction contributes to development of adult OPCs.

References

    1. Richardson WD, Kessaris N, Pringle N. Oligodendrocyte wars. Nature Rev. Neurosci. 2006;7:11–18. doi: 10.1038/nrn1826. - DOI - PMC - PubMed
    1. Small RK, Riddle P, Noble M. Evidence for migration of oligodendrocyte-type-2 astrocyte progenitor cells into the developing rat optic nerve. Nature. 1987;328:155–157. doi: 10.1038/328155a0. - DOI - PubMed
    1. Raff M. Intracellular developmental timers. Cold Spring Harb. Symp. Quant. Biol. 2007;72:431–43. doi: 10.1101/sqb.2007.72.007. - DOI - PubMed
    1. ffrench-Constant C, Raff MC. Proliferating bipotential glial progenitor cells in adult rat optic nerve. Nature. 1986;319:499–502. doi: 10.1038/319499a0. - DOI - PubMed
    1. Wolswijk G, Noble M. Identification of an adult-specific glial progenitor cell. Development. 1989;105:387–400. - PubMed

Publication types

MeSH terms

Substances