. 2017 May 20;389(10083):1981-2004.
doi: 10.1016/S0140-6736(17)30874-7. Epub 2017 Apr 19.

Evolution and patterns of global health financing 1995-2014: development assistance for health, and government, prepaid private, and out-of-pocket health spending in 184 countries

Collaborators

Evolution and patterns of global health financing 1995-2014: development assistance for health, and government, prepaid private, and out-of-pocket health spending in 184 countries

Global Burden of Disease Health Financing Collaborator Network. Lancet. .

Abstract

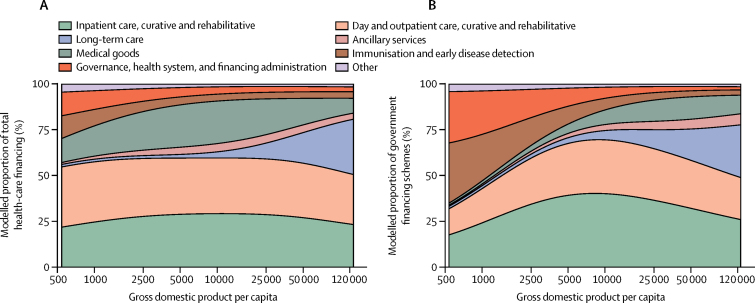
Background: An adequate amount of prepaid resources for health is important to ensure access to health services and for the pursuit of universal health coverage. Previous studies on global health financing have described the relationship between economic development and health financing. In this study, we further explore global health financing trends and examine how the sources of funds used, types of services purchased, and development assistance for health disbursed change with economic development. We also identify countries that deviate from the trends.

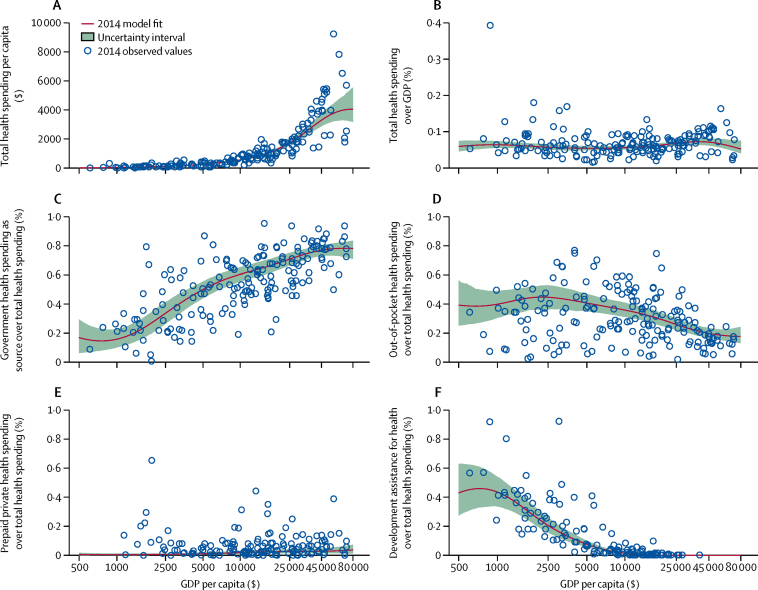
Methods: We estimated national health spending by type of care and by source, including development assistance for health, based on a diverse set of data including programme reports, budget data, national estimates, and 964 National Health Accounts. These data represent health spending for 184 countries from 1995 through 2014. We converted these data into a common inflation-adjusted and purchasing power-adjusted currency, and used non-linear regression methods to model the relationship between health financing, time, and economic development.

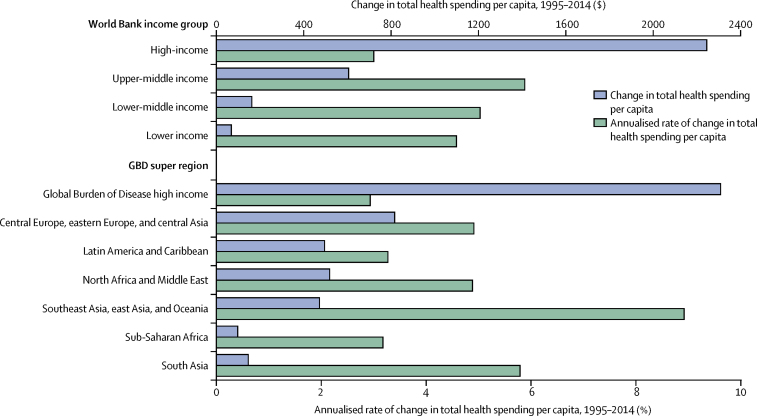
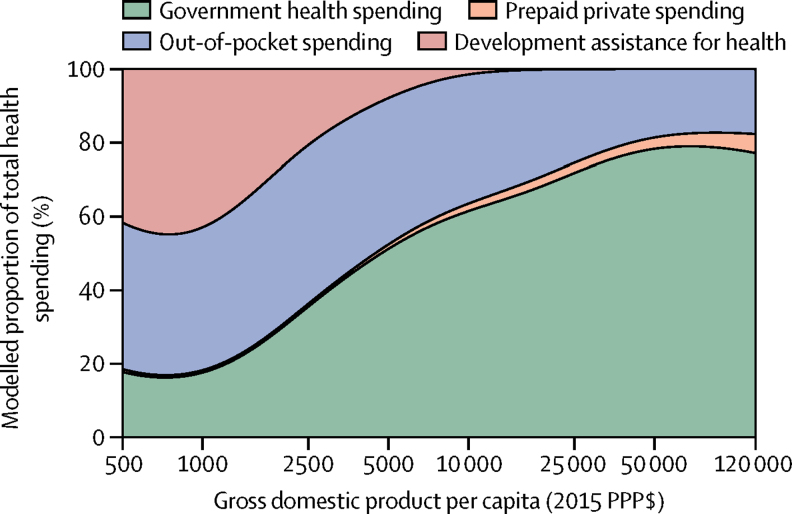
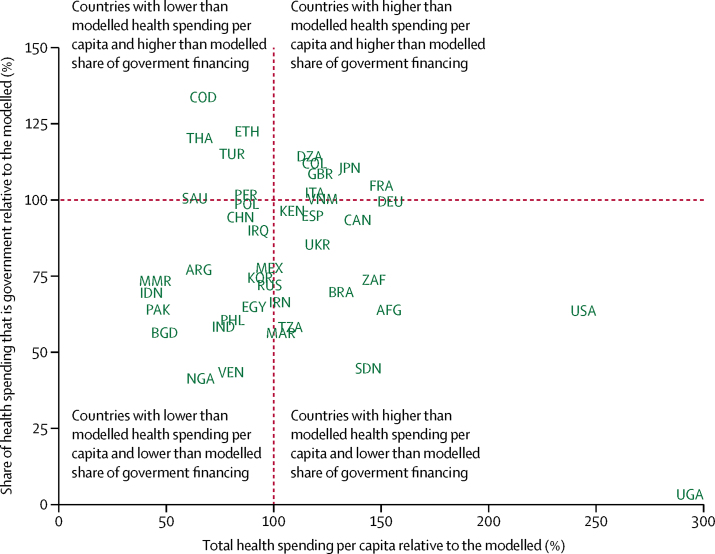
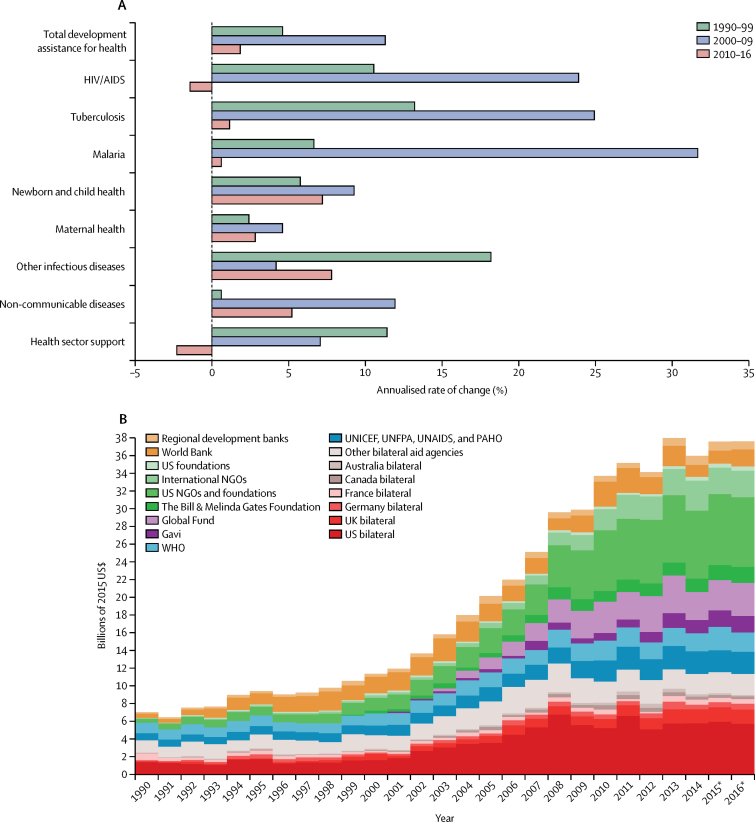
Findings: Between 1995 and 2014, economic development was positively associated with total health spending and a shift away from a reliance on development assistance and out-of-pocket (OOP) towards government spending. The largest absolute increase in spending was in high-income countries, which increased to purchasing power-adjusted $5221 per capita based on an annual growth rate of 3·0%. The largest health spending growth rates were in upper-middle-income (5·9) and lower-middle-income groups (5·0), which both increased spending at more than 5% per year, and spent $914 and $267 per capita in 2014, respectively. Spending in low-income countries grew nearly as fast, at 4·6%, and health spending increased from $51 to $120 per capita. In 2014, 59·2% of all health spending was financed by the government, although in low-income and lower-middle-income countries, 29·1% and 58·0% of spending was OOP spending and 35·7% and 3·0% of spending was development assistance. Recent growth in development assistance for health has been tepid; between 2010 and 2016, it grew annually at 1·8%, and reached US$37·6 billion in 2016. Nonetheless, there is a great deal of variation revolving around these averages. 29 countries spend at least 50% more than expected per capita, based on their level of economic development alone, whereas 11 countries spend less than 50% their expected amount.

Interpretation: Health spending remains disparate, with low-income and lower-middle-income countries increasing spending in absolute terms the least, and relying heavily on OOP spending and development assistance. Moreover, tremendous variation shows that neither time nor economic development guarantee adequate prepaid health resources, which are vital for the pursuit of universal health coverage.

Funding: The Bill & Melinda Gates Foundation.


Figures

Figure 1
Figure 1
Changes in health spending by income group and Global Burden of Disease (GBD) super region, 1995–2014 Currency reported in 2015 purchasing power parity adjusted $.
Figure 2
Figure 2
Health spending by source (total health spending [A, B], government health spending [C]; out-of-pocket health spending [D]; prepaid private health spending [E], and development assistance for health [F]), 2014 Health spending relative to gross domestic product (GDP) per capita (reported in 2015 purchasing-power-parity [PPP] adjusted $). Although all countries and years of data were used for this analysis, the trend line reflects the 2014 model fit.
Figure 3
Figure 3
Composition of health-care spending by source, 2014 PPP=purchasing-power-parity.
Figure 4
Figure 4
Observed government and total health spending relative to modelled spending, 2014 The figure shows the total health spending relative to modelled spending, and the share of health spending that is from the government relative to the modelled share. The vertical and horizontal red lines indicate where the observed spending is equal to the modelled spending (100%). Although all countries and years of data were used for this analysis, the deviations reflects the 2014 model fit. Only countries with a population higher than 30 million and 2014 data are included as points to avoid too many markers. A version with all countries included a dots is included in the appendix (p 68). AFG=Afghanistan. ARG=Argentina. BGD=Bangladesh. BRA=Brazil. CAN=Canada. CHN=China. COD=Democratic Republic of the Congo. COL=Colombia. DEU=Germany. DZA=Algeria. EGY=Egypt. ESP=Spain. ETH=Ethiopia. FRA=France. GBR=UK. IDN=Indonesia. IND=India. IRN=Iran. IRQ=Iraq. ITA=Italy. JPN=Japan. KEN=Kenya. KOR=South Korea. MAR=Morocco. MEX=Mexico. MMR=Myanmar. NGA=Nigeria. PAK=Pakistan. PER=Peru. PHL=Philippines. POL=Poland. RUS=Russia. SAU=Saudi Arabia. SDN=Sudan. THA=Thailand. TUR=Turkey. TZA=Tanzania. UGA=Uganda. UKR=Ukraine. USA=USA. VEN=Venezuela. VNM=Vietnam. ZAF=South Africa.
Figure 5
Figure 5
Changes in development assistance for health disbursements, 1990–2016 Development assistance for health as annualised growth rates (A) and disaggregated by channel (B). (A) Growth rates are shown for 1990–99, 2000–09, and 2010–16. (B) Estimates are shown from 1990 to 2016, all in billions of 2015 US$. World Bank includes the International Development Association and the International Bank for Reconstruction and Development; and regional development banks include the Inter-American Development Bank, the African Development Bank, and the Asian Development Bank. NGOs=non-governmental organisations. Global Fund=The Global Fund to Fight AIDS, Tuberculosis and Malaria. Gavi=Gavi, the Vaccine Alliance. UNICEF=United Nations Children's Fund. UNFPA=United Nations Population Fund. UNAIDS=Joint United Nations Programme on HIV/AIDS. PAHO=Pan American Health Organization. *Data for 2015 and 2016 are preliminary estimates based on budget data and estimation.
Figure 6
Figure 6
Flow of developmental assistance for health for all funds dispersed, 1995–2014 The figures shows the flow of development assistance for health from sources, through intermediary channels, to health focus areas and the region where the development assistance was ultimately received. Data are cumulative developmental assistance for health from 1995 to the end of 2014 in billions of 2015 US$. Each column disaggregates the total developmental assistance for health disbursed from 1995 through to 2014, which was US$423·0 billion. Funding sources are shown on the left, channels in the middle left, health focus areas on the middle right, and Global Burden of Disease (GBD) recipient super-regions are on the right. Private philanthropy includes corporate donations among other private philanthropy. Other sources include debt repayments and funds whose sources are unallocable. NGOs and foundations include non-governmental organisations and US foundations. UN Agencies include the UN Children's Fund, UN Population Fund, Joint UN Programme on HIV/AIDS, Pan American Health Organization, and WHO. Development banks include the World Bank International Development Association, the World Bank International Bank for Reconstruction and Development, the Inter-American Development Bank, the African Development Bank, and the Asian Development Bank. Other health focus areas correspond to developmental assistance for health for which we have project-level information but which is not identified as funding any of the health focus areas we tracked. Unallocable in terms of health focus area corresponds to developmental assistance for health for which we do not have project-level information and cannot parse across health focus areas. Latin America and the Caribbean includes Argentina, Chile, and Uruguay, which are now high-income countries when they were each middle-income countries. Southeast Asia, east Asia, and Oceania includes South Korea, which is also now a high-income country when it was a middle-income country. Unallocable in recipient region also corresponds to development assistance for health for which we do not have project-level information and thus, cannot parse across recipients. UNICEF=United Nations Children's Fund. UNFPA=United Nations Population Fund. UNAIDS=Joint United Nations Programme on HIV/AIDS. PAHO=Pan American Health Organization. Global Fund=The Global Fund to Fight AIDS, Tuberculosis and Malaria. Gavi=Gavi, the Vaccine Alliance.
Figure 7
Figure 7
Composition of health spending by type of goods and services, 2014 The modelled proportion of total (A) and government (B) health spending across gross domestic product per capita by types of goods and services. Other health spending includes all other health spending that is not otherwise classified in this taxonomy. Spending on education and counselling programs, epidemiological surveillance, and disaster preparedness was excluded.

Comment in

References

    1. Gottret P, Schieber G. Health financing revisited. A practitioner's guide. The World Bank; Washington DC: 2006.
    1. Emanuel E, Tanden N, Altman S. A systemic approach to containing health care spending. N Engl J Med. 2012;367:949–954. - PubMed
    1. Center for American Progress Cutting health care costs. Leading experts propose bold solutions. 2012. https://www.americanprogress.org/issues/healthcare/news/2012/08/02/11970... (accessed Dec 5, 2016).
    1. Herman B. Healthcare spending growth rate rises again in 2015. Mod. Healthc. 2016. http://www.modernhealthcare.com/article/20160713/news/160719963 (accessed Dec 5, 2016).
    1. United Nations Population Fund The Prime Minister of Tanzania calls on regional leaders to increase health spending to 15 per cent of national budgets and to strive for achieving health MDGs. 2007. http://www.unfpa.org/press/prime-minister-tanzania-calls-regional-leader... (accessed Dec 6, 2016).

Publication types