

Future and potential spending on health 2015-40: development assistance for health, and government, prepaid private, and out-of-pocket health spending in 184 countries
- PMID: 28433260
- PMCID: PMC5440765
- DOI: 10.1016/S0140-6736(17)30873-5
Future and potential spending on health 2015-40: development assistance for health, and government, prepaid private, and out-of-pocket health spending in 184 countries
Erratum in
-
Department of Error.Lancet. 2017 May 20;389(10083):1980. doi: 10.1016/S0140-6736(17)31302-8. Lancet. 2017. PMID: 28534750 Free PMC article. No abstract available.
Abstract
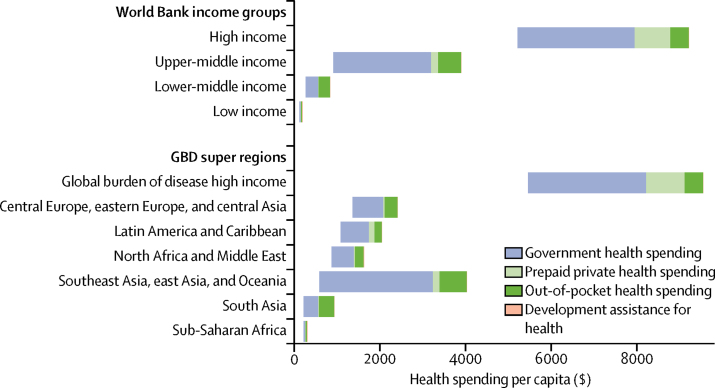
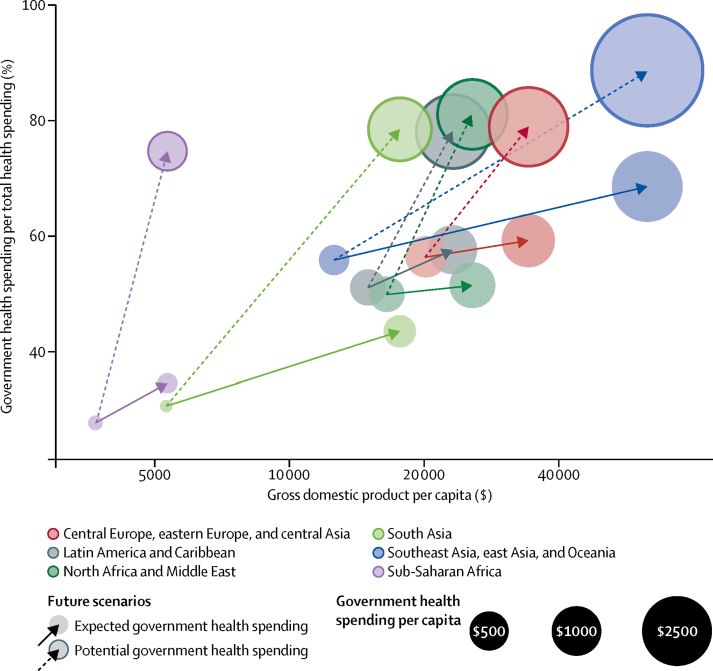
Background: The amount of resources, particularly prepaid resources, available for health can affect access to health care and health outcomes. Although health spending tends to increase with economic development, tremendous variation exists among health financing systems. Estimates of future spending can be beneficial for policy makers and planners, and can identify financing gaps. In this study, we estimate future gross domestic product (GDP), all-sector government spending, and health spending disaggregated by source, and we compare expected future spending to potential future spending.
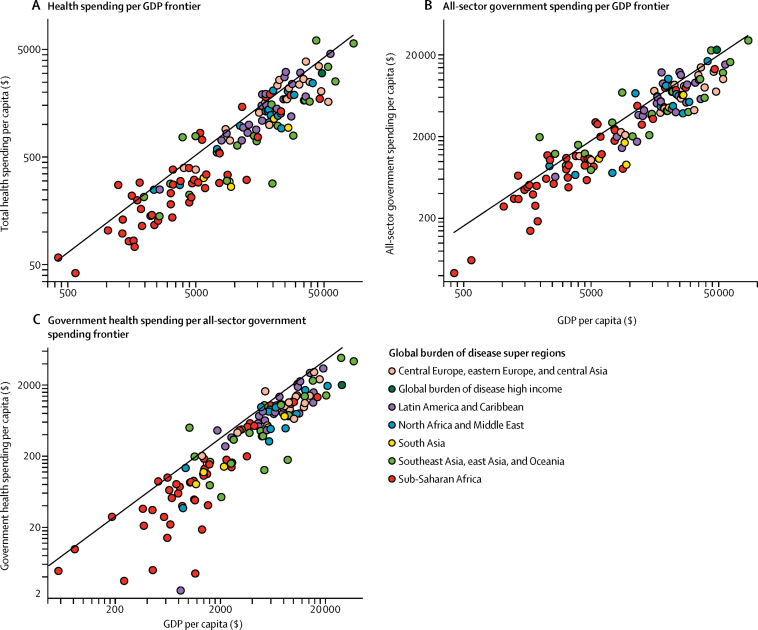
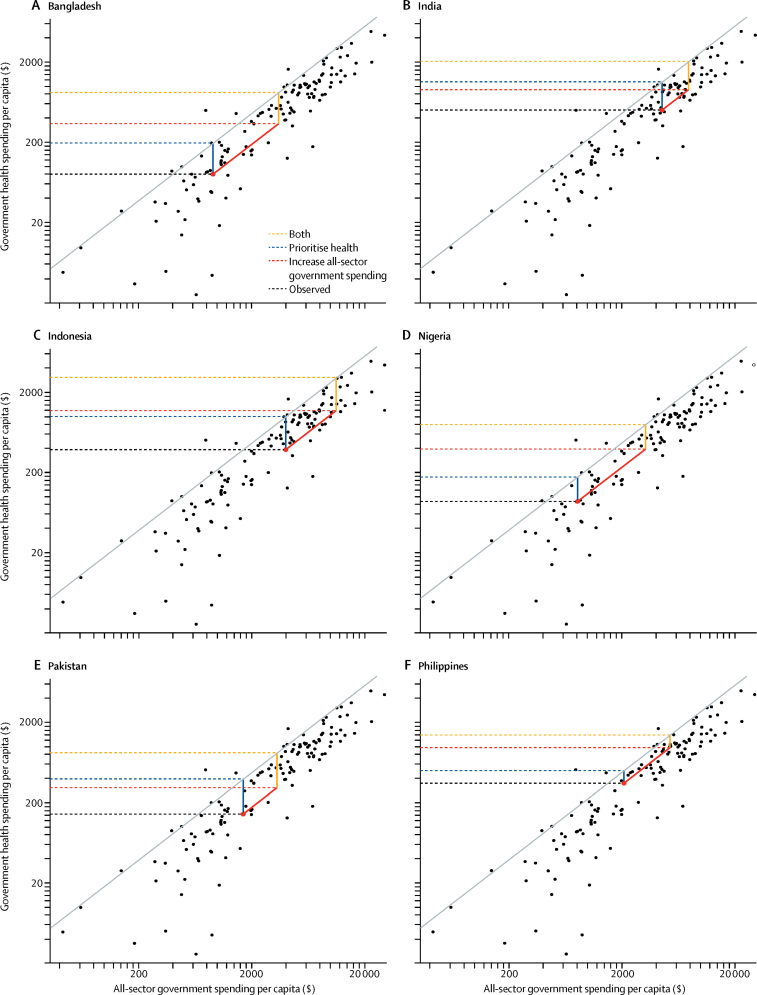
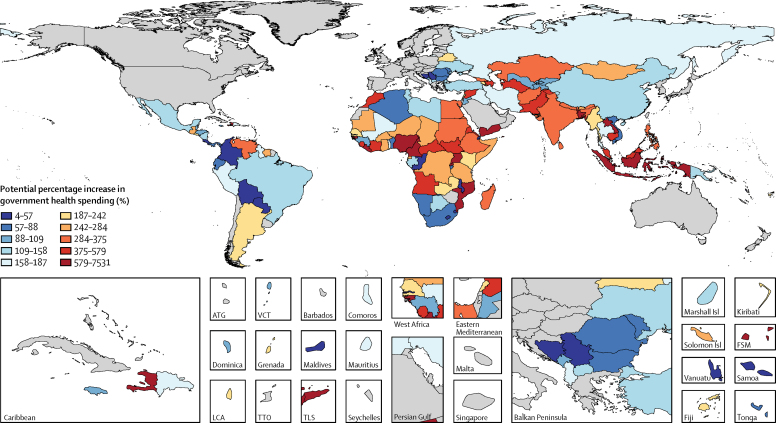
Methods: We extracted GDP, government spending in 184 countries from 1980-2015, and health spend data from 1995-2014. We used a series of ensemble models to estimate future GDP, all-sector government spending, development assistance for health, and government, out-of-pocket, and prepaid private health spending through 2040. We used frontier analyses to identify patterns exhibited by the countries that dedicate the most funding to health, and used these frontiers to estimate potential health spending for each low-income or middle-income country. All estimates are inflation and purchasing power adjusted.
Findings: We estimated that global spending on health will increase from US$9·21 trillion in 2014 to $24·24 trillion (uncertainty interval [UI] 20·47-29·72) in 2040. We expect per capita health spending to increase fastest in upper-middle-income countries, at 5·3% (UI 4·1-6·8) per year. This growth is driven by continued growth in GDP, government spending, and government health spending. Lower-middle income countries are expected to grow at 4·2% (3·8-4·9). High-income countries are expected to grow at 2·1% (UI 1·8-2·4) and low-income countries are expected to grow at 1·8% (1·0-2·8). Despite this growth, health spending per capita in low-income countries is expected to remain low, at $154 (UI 133-181) per capita in 2030 and $195 (157-258) per capita in 2040. Increases in national health spending to reach the level of the countries who spend the most on health, relative to their level of economic development, would mean $321 (157-258) per capita was available for health in 2040 in low-income countries.
Interpretation: Health spending is associated with economic development but past trends and relationships suggest that spending will remain variable, and low in some low-resource settings. Policy change could lead to increased health spending, although for the poorest countries external support might remain essential.
Funding: Bill & Melinda Gates Foundation.
Copyright © 2017 The Author(s). Published by Elsevier Ltd. This is an Open Access article under the CC BY 4.0 license. Published by Elsevier Ltd.. All rights reserved.
Figures

Comment in
-
Patterns of global health financing and potential future spending on health.Lancet. 2017 May 20;389(10083):1955-1956. doi: 10.1016/S0140-6736(17)31001-2. Epub 2017 Apr 20. Lancet. 2017. PMID: 28433257 No abstract available.
References
-
- Xu K, Evans DB, Carrin G, Aguilar-Rivera AM, Musgrove P, Evans T. Protecting households from catastrophic health spending. Health Aff (Millwood) 2007;26:972–983. - PubMed
-
- Falkingham J. Poverty, out-of-pocket payments and access to health care: evidence from Tajikistan. Soc Sci Med. 2004;58:247–258. - PubMed
-
- Piette JD, Heisler M, Wagner TH. Problems paying out-of-pocket medication costs among older adults with diabetes. Diabetes Care. 2004;27:384–391. - PubMed
-
- Damme WV, Leemput LV, Por I, Hardeman W, Meessen B. Out-of-pocket health expenditure and debt in poor households: evidence from Cambodia. Trop Med Int Health. 2004;9:273–280. - PubMed
MeSH terms
Grants and funding
LinkOut - more resources
Full Text Sources
Other Literature Sources
Medical
Miscellaneous
