

Aortic sinus flow stasis likely in valve-in-valve transcatheter aortic valve implantation
- PMID: 28433356
- PMCID: PMC5479725
- DOI: 10.1016/j.jtcvs.2017.03.053
Aortic sinus flow stasis likely in valve-in-valve transcatheter aortic valve implantation
Abstract
Objective: Valve-in-valve procedures using transcatheter aortic valves are increasingly performed to treat degenerated bioprosthetic surgical aortic valves because they are less invasive than redo aortic valve replacement. The objective of this study is to quantify the changes in aortic sinus blood flow dynamics before and after a valve-in-valve procedure to gain insight into mechanisms for clinical and subclinical thrombosis of leaflets.
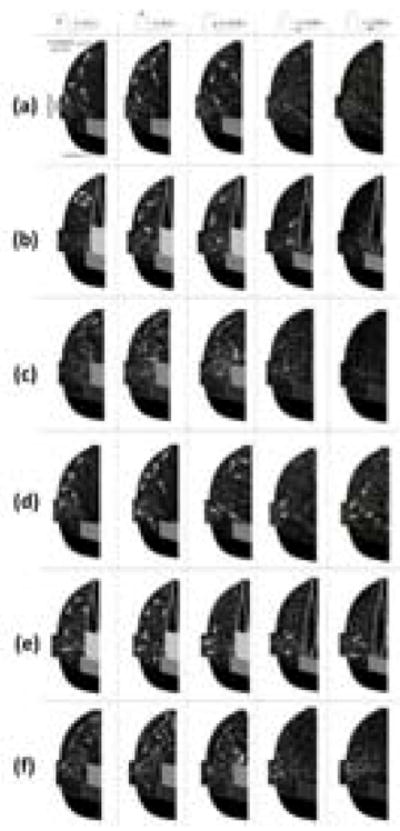
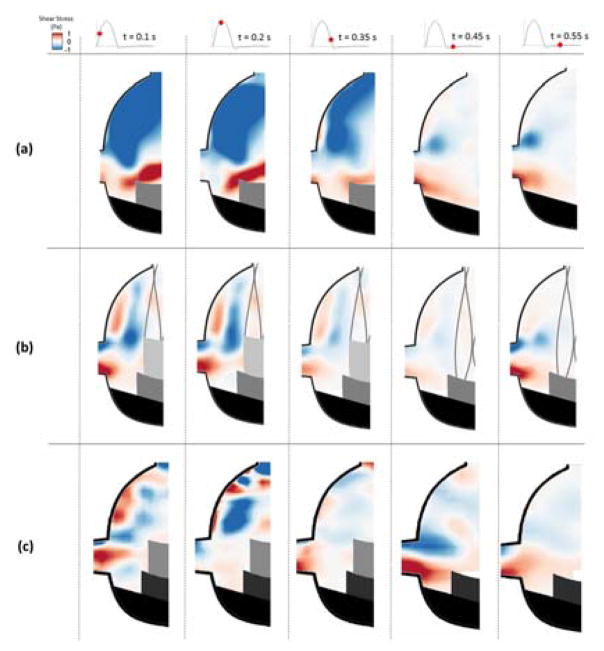
Methods: A detailed description of the sinus hemodynamics for valve-in-valve implantation was performed in vitro. A Medtronic Hancock II (Medtronic Inc, Minneapolis, Minn) porcine bioprosthesis was modeled as a surgical aortic valve, and Medtronic CoreValve and Edwards Sapien (Edwards Lifesciences, Irvine, Calif) valves were used as the transcatheter aortic valves. High-resolution particle image velocimetry was used to compare the flow patterns from these 2 valves within both the left coronary and noncoronary sinuses in vitro.
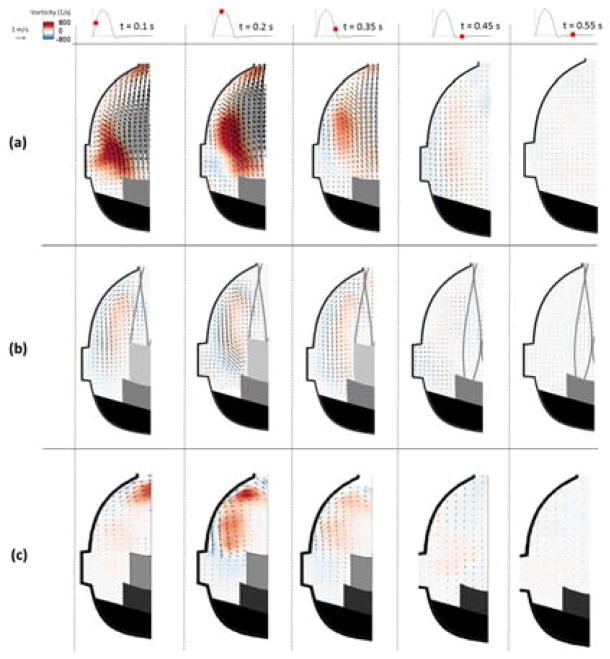
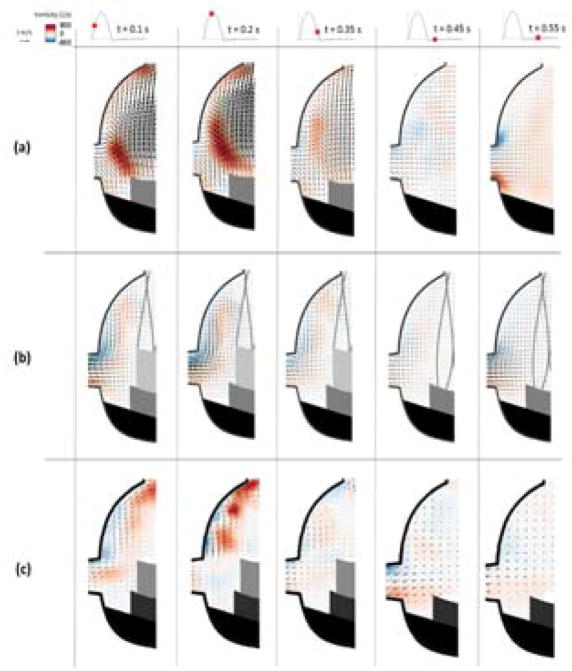
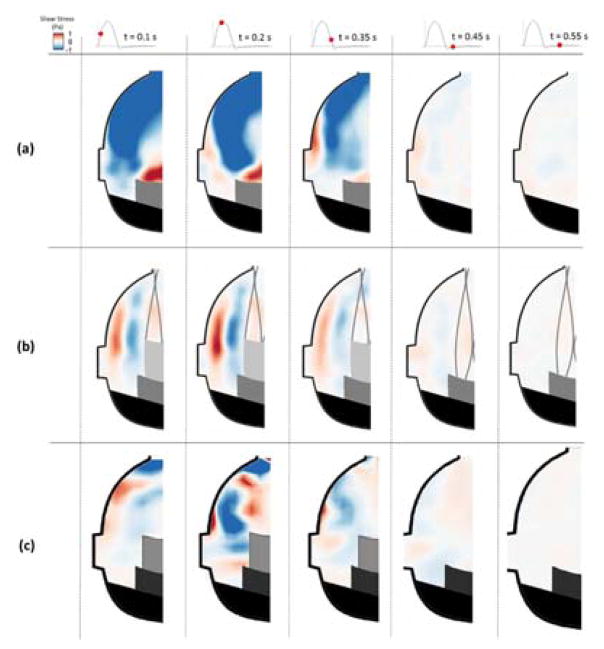
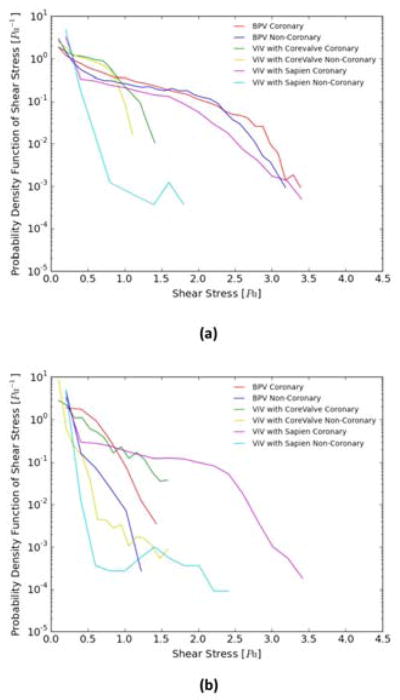
Results: Velocity and vorticity within the surgical valve sinuses reached peak values of 0.7 m/s and 1000 s-1, with a 70% decrease in peak fluid shear stress near the aortic side of the leaflet in the noncoronary sinus. With the introduction of transcatheter aortic valves, peak velocity and vorticity were reduced to approximately 0.4 m/s and 550 s-1 and 0.58 m/s and 653 s-1 without coronary flow and 0.60 m/s and 631 s-1 and 0.81 m/s and 669 s-1 with coronary flow for the CoreValve and Sapien valve-in-valve implantations, respectively. Peak shear stress was approximately 38% higher along the aortic side of the coronary versus noncoronary transcatheter aortic valve leaflet.
Conclusions: Decreased flow and shear stress in valve-in-valve procedures indicate a higher risk of leaflet thrombosis secondary to flow stasis, perhaps more so in the noncoronary sinus.
Keywords: aortic sinus; calcification; thrombosis; transcatheter aortic valve implantation.
Copyright © 2017 The American Association for Thoracic Surgery. Published by Elsevier Inc. All rights reserved.
Conflict of interest statement
Figures
Comment in
-
Transcatheter aortic valve-in-valve implantation: Go with the flow?J Thorac Cardiovasc Surg. 2017 Jul;154(1):44-45. doi: 10.1016/j.jtcvs.2017.03.103. Epub 2017 Apr 2. J Thorac Cardiovasc Surg. 2017. PMID: 28433354 No abstract available.
References
-
- Bapat V, Attia R, Redwood S, et al. Use of transcatheter heart valves for a valve-in-valve implantation in patients with degenerated aortic bioprosthesis: technical considerations and results. The Journal of thoracic and cardiovascular surgery. 2012;144:1372–1380. - PubMed
-
- Makkar RR, Fontana G, Jilaihawi H, et al. Possible Subclinical Leaflet Thrombosis in Bioprosthetic Aortic Valves. New England Journal of Medicine. 2015;373:2015–2024. - PubMed
-
- De Marchena E, Mesa J, Pomenti S, et al. Thrombus Formation Following Transcatheter Aortic Valve Replacement. Jacc-Cardiovascular Interventions. 2015;8:728–739. - PubMed
-
- De Marchena E, Mesa J, Pomenti S, et al. Thrombus Formation Following Transcatheter Aortic Valve Replacement (vol 8, pg 728, 2015) Jacc-Cardiovascular Interventions. 2015;8:1140–1141. - PubMed
-
- Hatoum H, Crestanello J, Dasi LP. Possible Subclinical Leaflet Thrombosis in Bioprosthetic Aortic Valves. New England Journal of Medicine. 2016;374:1590–1592. - PubMed
MeSH terms
Grants and funding
LinkOut - more resources
Full Text Sources
Other Literature Sources
