

Disconnect between alcohol-induced alterations in chromatin structure and gene transcription in a mouse embryonic stem cell model of exposure
- PMID: 28433419
- PMCID: PMC5484046
- DOI: 10.1016/j.alcohol.2017.01.007
Disconnect between alcohol-induced alterations in chromatin structure and gene transcription in a mouse embryonic stem cell model of exposure
Abstract
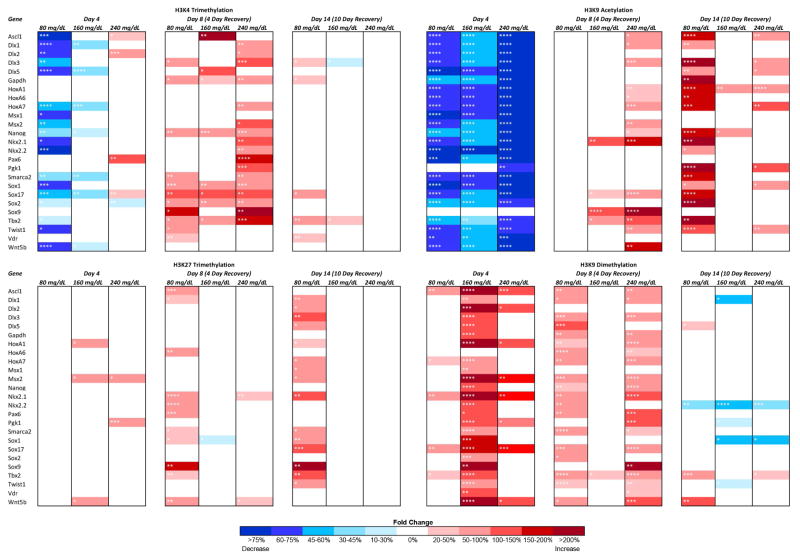
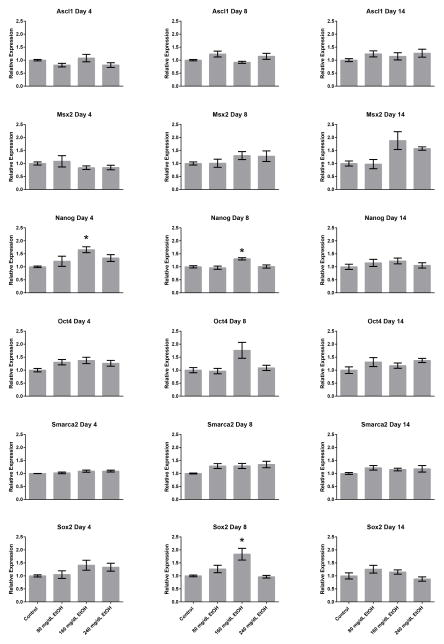
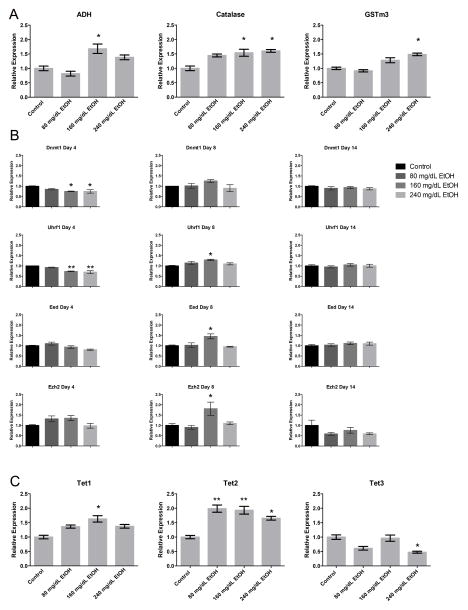
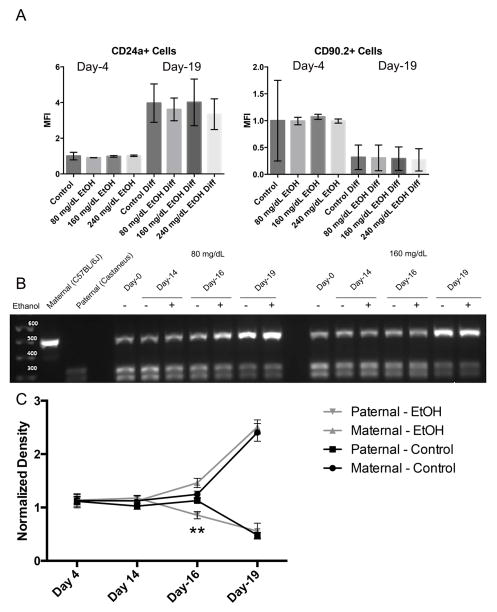
Alterations to chromatin structure induced by environmental insults have become an attractive explanation for the persistence of exposure effects into subsequent life stages. However, a growing body of work examining the epigenetic impact that alcohol and other drugs of abuse exert consistently notes a disconnection between induced changes in chromatin structure and patterns of gene transcription. Thus, an important question is whether perturbations in the 'histone code' induced by prenatal exposures to alcohol implicitly subvert gene expression, or whether the hierarchy of cellular signaling networks driving development is such that they retain control over the transcriptional program. To address this question, we examined the impact of ethanol exposure in mouse embryonic stem cells cultured under 2i conditions, where the transcriptional program is rigidly enforced through the use of small molecule inhibitors. We find that ethanol-induced changes in post-translational histone modifications are dose-dependent, unique to the chromatin modification under investigation, and that the extent and direction of the change differ between the period of exposure and the recovery phase. Similar to in vivo models, we find post-translational modifications affecting histone 3 lysine 9 are the most profoundly impacted, with the signature of exposure persisting long after alcohol has been removed. These changes in chromatin structure associate with dose-dependent alterations in the levels of transcripts encoding Dnmt1, Uhrf1, Tet1, Tet2, Tet3, and Polycomb complex members Eed and Ezh2. However, in this model, ethanol-induced changes to the chromatin template do not consistently associate with changes in gene transcription, impede the process of differentiation, or affect the acquisition of monoallelic patterns of expression for the imprinted gene Igf2R. These findings question the inferred universal relevance of epigenetic changes induced by drugs of abuse and suggest that changes in chromatin structure cannot unequivocally explain dysgenesis in isolation.
Keywords: Chromatin; Developmental programming; Embryonic stem cells; Environmental epigenetics; Epigenetic inheritance; Epigenetics; Fetal alcohol syndrome; Neurodevelopmental programming; Teratogen.
Copyright © 2017 Elsevier Inc. All rights reserved.
Figures

Similar articles
-
Dose-dependent alcohol-induced alterations in chromatin structure persist beyond the window of exposure and correlate with fetal alcohol syndrome birth defects.Epigenetics Chromatin. 2015 Sep 28;8:39. doi: 10.1186/s13072-015-0031-7. eCollection 2015. Epigenetics Chromatin. 2015. PMID: 26421061 Free PMC article.
-
The BAF (BRG1/BRM-Associated Factor) chromatin-remodeling complex exhibits ethanol sensitivity in fetal neural progenitor cells and regulates transcription at the miR-9-2 encoding gene locus.Alcohol. 2017 May;60:149-158. doi: 10.1016/j.alcohol.2017.01.003. Epub 2017 Apr 7. Alcohol. 2017. PMID: 28438527 Free PMC article.
-
Alcohol-induced epigenetic alterations to developmentally crucial genes regulating neural stemness and differentiation.Alcohol Clin Exp Res. 2013 Jul;37(7):1111-22. doi: 10.1111/acer.12080. Epub 2013 Mar 12. Alcohol Clin Exp Res. 2013. PMID: 23488822 Free PMC article.
-
Changes to histone modifications following prenatal alcohol exposure: An emerging picture.Alcohol. 2017 May;60:41-52. doi: 10.1016/j.alcohol.2017.01.005. Epub 2017 Feb 4. Alcohol. 2017. PMID: 28431792 Review.
-
Potential roles of imprinted genes in the teratogenic effects of alcohol on the placenta, somatic growth, and the developing brain.Exp Neurol. 2022 Jan;347:113919. doi: 10.1016/j.expneurol.2021.113919. Epub 2021 Nov 6. Exp Neurol. 2022. PMID: 34752786 Review.
Cited by
-
Knockdown of DNMT1 Induces SLCO3A1 to Promote Follicular Growth by Enhancing the Proliferation of Granulosa Cells in Mammals.Int J Mol Sci. 2024 Feb 20;25(5):2468. doi: 10.3390/ijms25052468. Int J Mol Sci. 2024. PMID: 38473715 Free PMC article.
-
Silencing TET1 expression alters the epigenomic landscape and amplifies transcriptomic responses to allergen in airway epithelial cells.Environ Epigenet. 2025 Mar 20;11(1):dvaf007. doi: 10.1093/eep/dvaf007. eCollection 2025. Environ Epigenet. 2025. PMID: 40401166 Free PMC article.
-
Programmed increases in LXRα induced by paternal alcohol use enhance offspring metabolic adaptation to high-fat diet induced obesity.Mol Metab. 2019 Dec;30:161-172. doi: 10.1016/j.molmet.2019.09.016. Epub 2019 Oct 3. Mol Metab. 2019. PMID: 31767168 Free PMC article.
-
EZH2-dependent epigenetic reprogramming in the central nucleus of amygdala regulates adult anxiety in both sexes after adolescent alcohol exposure.Transl Psychiatry. 2024 Apr 26;14(1):197. doi: 10.1038/s41398-024-02906-y. Transl Psychiatry. 2024. PMID: 38670959 Free PMC article.
-
Nonconceptus Mechanisms of Prenatal Alcohol Exposure That Disrupt Embryo-Fetal Development: An Integrative View.Alcohol Res. 2025 Jul 16;45(1):07. doi: 10.35946/arcr.v45.1.07. eCollection 2025. Alcohol Res. 2025. PMID: 40692661 Free PMC article. Review.
References
-
- Bartolomei MS, Tilghman SM. Genomic imprinting in mammals. Annual Review of Genetics. 1997;31(1):493–525. - PubMed
-
- Bekdash RA, Zhang C, Sarkar DK. Gestational choline supplementation normalized fetal alcohol-induced alterations in histone modifications, DNA methylation, and proopiomelanocortin (POMC) gene expression in β-endorphin-producing POMC neurons of the hypothalamus. Alcoholism, Clinical and Experimental Research. 2013;37(7):1133–42. - PMC - PubMed
-
- Bernstein BE, Mikkelsen TS, Xie X, Kamal M, Huebert DJ, Cuff J, et al. A bivalent chromatin structure marks key developmental genes in embryonic stem cells. Cell. 2006;125(2):315–26. - PubMed
Publication types
MeSH terms
Substances
Grants and funding
LinkOut - more resources
Full Text Sources
Other Literature Sources
Miscellaneous
