. 2017 May:60:135-147.
doi: 10.1016/j.alcohol.2017.01.006. Epub 2017 Feb 20.

DNA Methylation program in normal and alcohol-induced thinning cortex

Affiliations

DNA Methylation program in normal and alcohol-induced thinning cortex

Nail Can Öztürk et al. Alcohol. 2017 May.

Abstract

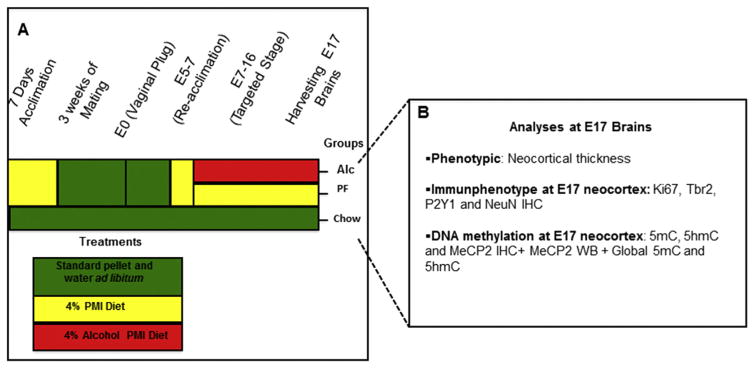
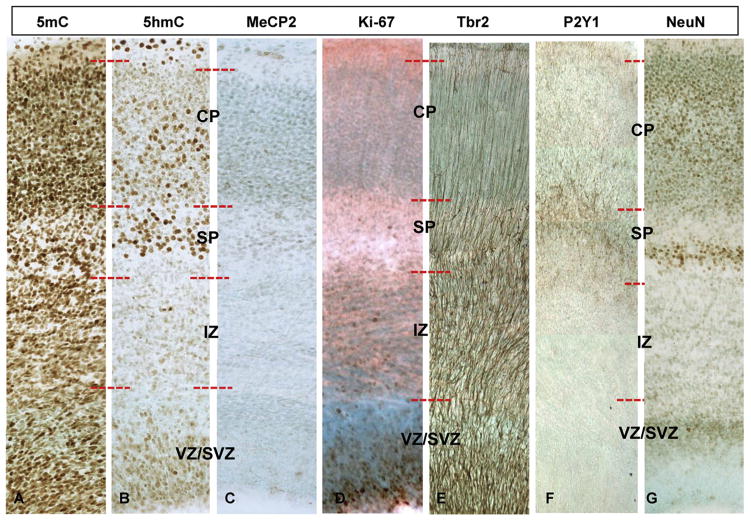
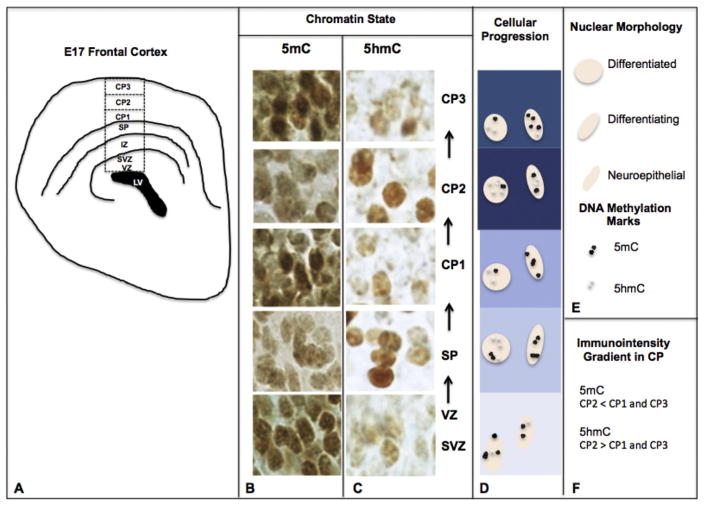
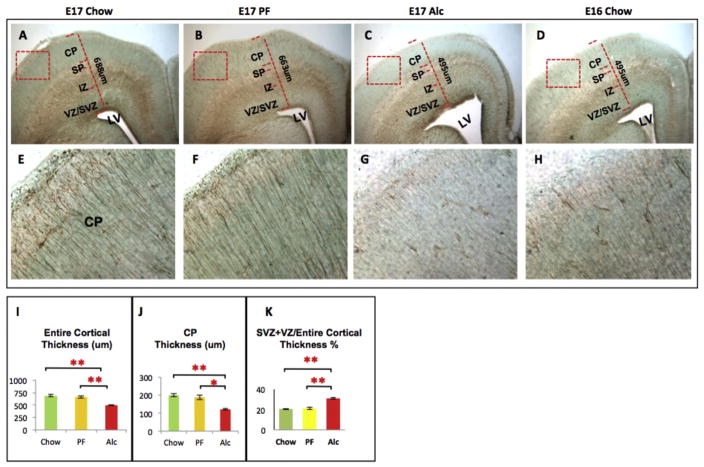
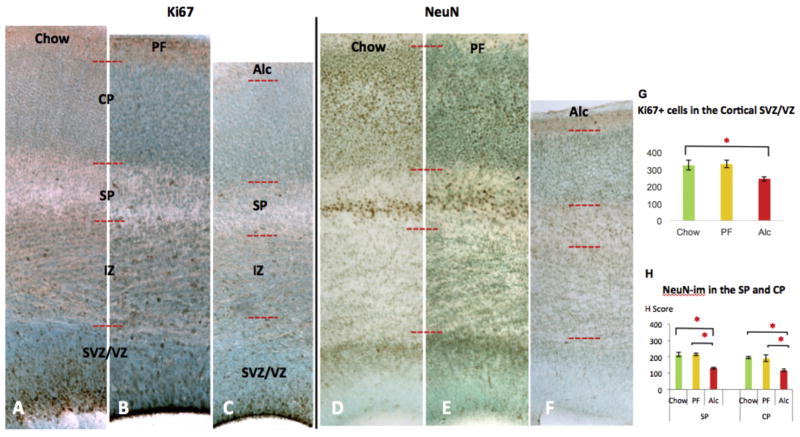
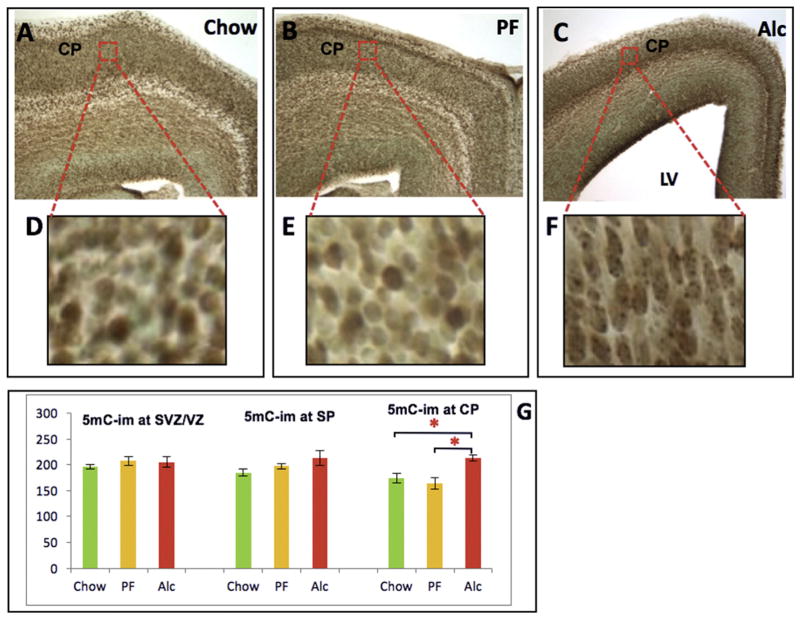
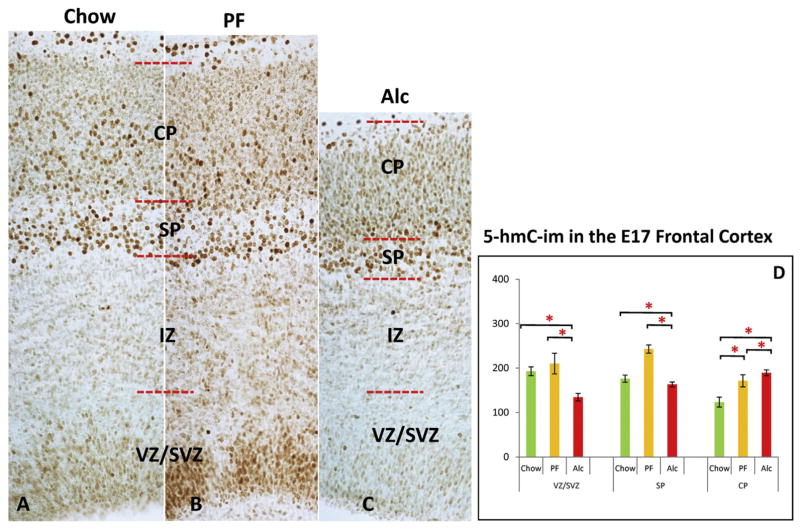
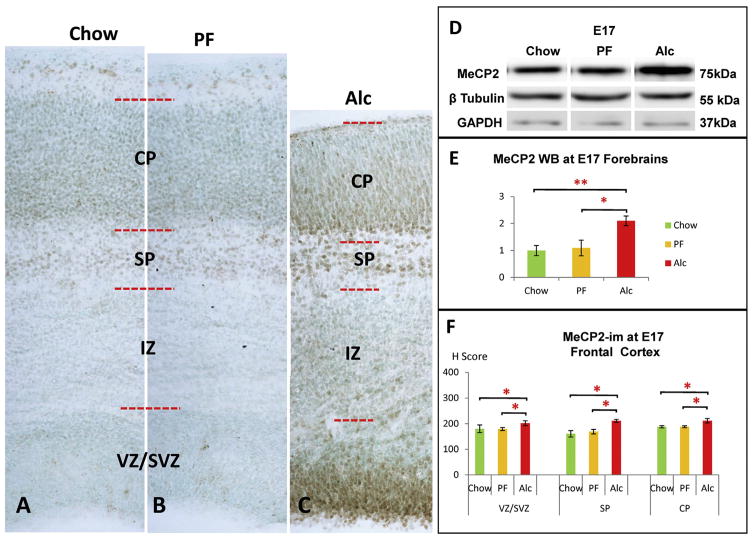
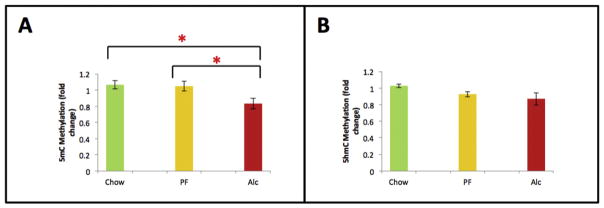
While cerebral underdevelopment is a hallmark of fetal alcohol spectrum disorders (FASD), the mechanism(s) guiding the broad cortical neurodevelopmental deficits are not clear. DNA methylation is known to regulate early development and tissue specification through gene regulation. Here, we examined DNA methylation in the onset of alcohol-induced cortical thinning in a mouse model of FASD. C57BL/6 (B6) mice were administered a 4% alcohol (v/v) liquid diet from embryonic (E) days 7-16, and their embryos were harvested at E17, along with isocaloric liquid diet and lab chow controls. Cortical neuroanatomy, neural phenotypes, and epigenetic markers of methylation were assessed using immunohistochemistry, Western blot, and methyl-DNA assays. We report that cortical thickness, neuroepithelial proliferation, and neuronal migration and maturity were found to be deterred by alcohol at E17. Simultaneously, DNA methylation, including 5-methylcytosine (5mC) and 5-hydroxcylmethylcytosine (5hmC), which progresses as an intrinsic program guiding normal embryonic cortical development, was severely affected by in utero alcohol exposure. The intricate relationship between cortical thinning and this DNA methylation program disruption is detailed and illustrated. DNA methylation, dynamic across the multiple cortical layers during the late embryonic stage, is highly disrupted by fetal alcohol exposure; this disruption occurs in tandem with characteristic developmental abnormalities, ranging from structural to molecular. Finally, our findings point to a significant question for future exploration: whether epigenetics guides neurodevelopment or whether developmental conditions dictate epigenetic dynamics in the context of alcohol-induced cortical teratogenesis.

Keywords: Epigenetics; Fetal Alcohol Spectrum Disorders (FASD); Neurodevelopmental deficit; Neuroepigenetics; Neurogenesis.


Figures

Fig. 1
Fig. 1
Summary of experimental procedure. (A) C57BL/6 (B6) females were conditioned to receive the liquid diet devoid of alcohol for 7 days preceding mating. After conception, the liquid diet was re-introduced at E5 and either an alcohol diet or an isocaloric pair-fed diet was administered from E7–E16 (equivalent to the late first and second human trimesters). Each color in the schema represents a specific treatment: green (standard pellet and water ad libitum), yellow (alcohol-free PMI liquid diet), or red (4% v/v alcohol PMI liquid diet ad libitum). (B) At E17, brains from each litter across the three groups were processed for either immunophenotypic or molecular assessments. Alc (alcohol); IHC (immunohistochemistry); PF (pair-fed). (For interpretation of the references to colour in this figure legend, the reader is referred to the web version of this article.)
Fig. 2
Fig. 2
Comparative phenotypic and DNA methylation dynamics in the embryonic neocortex. (A–C) Representative cortical columns from the Chow E17 frontal neocortex immunostained with DMP markers (5mC, 5hmC, MeCP2) and (D–G) phenotypic neural markers (Ki67, Tbr2, P2Y1, and NeuN) are presented for comparison of the DMP dynamics along the radially progressing corticogenesis of the E17 brain. SVZ/VZ (Subventricular Zone/Ventricular Zone); IZ (Intermediate Zone); SP (Subplate); CP (Cortical plate).
Fig. 3
Fig. 3
The DNA methylation program of the embryonic cortex. (A) At E17, the embryonic cortex develops in distinct layers progressing from the roof of the lateral ventricle (LV). Neuroepithelial cells (NEs) sequentially migrate through the proliferative ventricular zone (VZ) to the uppermost cortical superficial layers. (B, C) During this developmental progression, cells of the layers are diverse in their maturational states and simultaneously unique in their chromatic distribution of DNA methylation markers. Specifically, NECs of the proliferative VZ exhibit strong 5mC (B) followed by a weaker 5hmC signal (C). (B–D) As these cells undergo differentiation and radial migration into the subplate layer (SP), cellular morphology changes from ellipsoidal to larger, rounded nuclei. During this transition, a characteristic rise in 5hmC is observed, in contrast to a weakening of 5mC. (E) Legend for nuclear morphology and DNA methylation mark. (B–D, F) As cells reach their target layers within the cortical plate (CP), the distribution (immunointensity gradient) of 5mC/5hmC shows an opposite trend within three sublayers of the CP (CP1/2/3). SVZ (Subventricular Zone).
Fig. 4
Fig. 4
Tbr2-im at the E17 frontal cortex across experimental groups. Structural abnormalities were observed during immunophenotypic investigation. Notably, the thickness of cortical plate (J) as well as the entire thickness of frontal cortex (I) were markedly reduced in Alcohol group frontal cortex as compared to their Chow and PF control cortices (A–C). Fetal alcohol exposure also increased the proportion of SVZ + VZ/entire cortical thickness (K) as compared to controls. Lateral Ventricle (LV) expansion was also observed in E17 alcohol cortices (A–C). (G) Finally, Tbr2-im (a marker for neural progenitor migration) was normally observed as a radially extending fiber ascending from the base of the lateral ventricle up to the pial surface. Alcohol noticeably reduced the Tbr2 immunoreactivity in the CP layer. E16 Chow brains were used as developmental stage controls and more closely resembled the E17 alcohol developmental state than E17 Chow (C–D, G–H). Quantitative measurements among the three groups were analyzed by one-way ANOVA, and the difference between paired groups were compared by Student t-test *p < 0.05, **p < 0.005. N (structural analysis) = Chow (5), PF (5), Alc (5). N (Tbr2-im analysis) = Chow (3), PF (3), Alc (3), E16 Chow (3). SVZ/VZ (Subventricular Zone/Ventricular Zone); IZ (Intermediate Zone); SP (Subplate); CP (Cortical plate).
Fig. 5
Fig. 5
Alcohol-induced changes of Ki67-im and NeuN-im across different groups of E17 cortices. Representative cortical column of E17 Chow (A, D), PF (B, E), and (C, F) Alc group coronal sections for Ki67 and NeuN immunostaining. Fetal alcohol-induced reduction of Ki67 immunoreactivity was observed mainly in the SVZ/VZ zone, the neuroepithelial cellular zones. Quantitative assessment of Ki67-im (+) cells further confirmed an alcohol-related reduction in the SVZ/VZ zone (G); N = Chow (5), PF (4), Alc (7). Alcohol reduced NeuN-im throughout cortical SP and CP layers (F) compared to Chow (D) and PF (E). No significant change was observed between Chow and PF groups. Quantitative assessment of NeuN-im was further quantified by single-cell density analysis (H Scoring) across the three groups (H). *p < 0.05. Data are mean ± SEM. VZ/SVZ (Ventricular Zone/Subventricular Zone); IZ (Intermediate Zone); SP (Subplate); CP (Cortical plate).
Fig. 6
Fig. 6
Developmental 5mC-im in the E17 frontal cortex and alcohol-induced developmental delay. (A–C) E17 frontal cortex across three groups (Chow, PF, and Alc). Red-boxed areas in CP (A–C) were enlarged in all D–F. While no change in 5mC-im was detected across the groups in the SVZ/VZ or SP, 5mC was significantly increased in the Alcohol group CP (G). Enlarged CP areas further demonstrated that alcohol induced a morphological delay of CP neurons (as observed by their ellipsoidal shape and granular intranuclear 5mC-im distribution) compared to the mature roundedness of Chow and PF CP neurons (D–F). *p < 0.05. N = Chow (5), PF (4), Alc (5). LV (Lateral Ventricle); SVZ/VZ (Subventricular Zone/Ventricular Zone); IZ (Intermediate Zone); SP (Subplate); CP (Cortical plate); MZ (Marginal Zone). (For interpretation of the references to colour in this figure legend, the reader is referred to the web version of this article.)
Fig. 7
Fig. 7
5hmC-im in the E17 frontal cortex across groups. Alcohol reduced 5hmC-im in the cortical SVZ/VZ layers (C) compared to Chow (A) and PF controls (B), while no significant change was observed between controls (D). At the SP cortical layer, the only significant alteration detected was an increase in the PF group as compared to both Chow and Alc groups. (A–D) A marked increase of 5hmC-im was observed at the CP region in both the PF and Alc groups as compared to the Chow group, while a significant increment was also evident in the Alc group CP as compared to the PF group. *p < 0.05. N = Chow (5), PF (4), Alc (5). CP (cortical plate); MZ (marginal zone); SP (subplate); SVZ (subventricular zone); VZ (Ventricular zone).
Fig. 8
Fig. 8
Alcohol-induced MeCP2 increase in the E17 cortex. (A–C) Representative columns from the E17 frontal cortex across the three groups. (C, F) Alcohol increased MeCP2-im throughout cortical SVZ/VZ, SP, and CP layers compared to controls. No significant change was observed between Chow and PF groups. *p < 0.05. N = Chow (5), PF (4), Alc (5). (D–E) Densitometry of MeCP2 whole-brain Western blot (WB) showed a significant increase of MeCP2 expression at E17 in the Alc group compared to its counterparts. (One-way ANOVA: F = 6.95, p < 0.05). Post hoc analysis showed no significant difference between PF and Chow groups. Western blot band intensity was normalized to GAPDH as an internal control. N = Chow (4), PF (3), Alc (4) mean ± SEM *p < 0.05 **p < 0.005. WB (Western blot).
Fig. 9
Fig. 9
Global quantitative DNA methylation (5mC and 5-hmC) of E17 cortex across experimental groups. (A) Global DNA methylation (5mC) was significantly decreased in the neocortex at E17. (B) Global DNA hydroxylmethylation (5hmC) was not significantly decreased in the neocortex in response to fetal alcohol exposure. Means of the three groups were compared by non-parametric Kruskal-Wallis test followed by Conover post hoc test for multiple comparisons. *p < 0.05. Data are mean ± SEM. N = Chow (6), PF (6), Alc (6).

Similar articles

Cited by

References

    1. Abbott CW, Kozanian OO, Kanaan J, Wendel KM, Huffman KJ. The impact of prenatal ethanol exposure on neuroanatomical and behavioral development in mice. Alcoholism: Clinical and Experimental Research. 2016;40:122–133. - PMC - PubMed
    1. Angevine JB, Jr, Sidman RL. Autoradiographic study of cell migration during histogenesis of cerebral cortex in the mouse. Nature. 1961;192:766–768. - PubMed
    1. Anthony B, Vinci-Booher S, Wetherill L, Ward R, Goodlett C, Zhou FC. Alcohol-induced facial dysmorphology in C57BL/6 mouse models of fetal alcohol spectrum disorder. Alcohol. 2010;44:659–671. - PMC - PubMed
    1. Anthony B, Zhou FC, Ogawa T, Goodlett CR, Ruiz J. Alcohol exposure alters cell cycle and apoptotic events during early neurulation. Alcohol and Alcoholism. 2008;43:261–273. - PMC - PubMed
    1. Aronne MP, Evrard SG, Mirochnic S, Brusco A. Prenatal ethanol exposure reduces the expression of the transcriptional factor Pax6 in the developing rat brain. Annals of the New York Academy of Sciences. 2008;1139:478–498. - PubMed

Publication types

MeSH terms