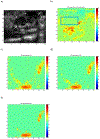
Subharmonic-Aided Pressure Estimation for Monitoring Interstitial Fluid Pressure in Tumors: Calibration and Treatment with Paclitaxel in Breast Cancer Xenografts
- PMID: 28433436
- PMCID: PMC6082419
- DOI: 10.1016/j.ultrasmedbio.2017.02.011
Subharmonic-Aided Pressure Estimation for Monitoring Interstitial Fluid Pressure in Tumors: Calibration and Treatment with Paclitaxel in Breast Cancer Xenografts
Abstract
Interstitial fluid pressure (IFP) in rats with breast cancer xenografts was non-invasively estimated using subharmonic-aided pressure estimation (SHAPE) versus an invasive pressure monitor. Moreover, monitoring of IFP changes after chemotherapy was assessed. Eighty-nine rats (calibration n = 25, treatment n = 64) were injected with 5 × 10⁶ breast cancer cells (MDA-MB-231). Radiofrequency signals were acquired (39 rats successfully imaged) with a Sonix RP scanner (BK Ultrasound, Richmond, BC, Canada) using a linear array (L9-4, transmit/receive: 8/4 MHz) after administration of Definity (Lantheus Medical Imaging, North Billerica, MA, USA; 180 μL/kg) and compared with readings from an invasive pressure monitor (Stryker, Berkshire, UK). An inverse linear relationship was established between tumor IFP and SHAPE (y = -1.06x + 28.27, r = -0.69, p = 0.01) in the calibration group. Use of this relationship in the treatment group resulted in r = 0.74 (p < 0.05) between measured (pressure monitor) and SHAPE-estimated IFP (average error: 6.24 mmHg). No significant before/after differences were observed with respect to paclitaxel treatment (5 mg/kg, Mayne Pharma, Paramus, NJ, USA) with either method (p ≥ 0.15).
Keywords: Breast cancer xenografts; Contrast agents; Interstitial fluid pressure; Microbubbles; Subharmonic-aided pressure estimation; Ultrasound.
Copyright © 2017 World Federation for Ultrasound in Medicine & Biology. Published by Elsevier Inc. All rights reserved.
Figures


Similar articles
-
Subharmonic aided pressure estimation for monitoring interstitial fluid pressure in tumours--in vitro and in vivo proof of concept.Ultrasonics. 2014 Sep;54(7):1938-44. doi: 10.1016/j.ultras.2014.04.022. Epub 2014 May 6. Ultrasonics. 2014. PMID: 24856899 Free PMC article.
-
High and low frequency subharmonic imaging of angiogenesis in a murine breast cancer model.Ultrasonics. 2015 Sep;62:50-5. doi: 10.1016/j.ultras.2015.04.012. Epub 2015 May 5. Ultrasonics. 2015. PMID: 25979676 Free PMC article.
-
Comparing Quantitative Immunohistochemical Markers of Angiogenesis to Contrast-Enhanced Subharmonic Imaging.J Ultrasound Med. 2016 Sep;35(9):1839-47. doi: 10.7863/ultra.15.05024. Epub 2016 Jul 7. J Ultrasound Med. 2016. PMID: 27388814 Free PMC article.
-
Paclitaxel and carboplatin for advanced breast cancer.Semin Oncol. 1996 Oct;23(5 Suppl 11):41-5. Semin Oncol. 1996. PMID: 8893899 Review.
-
Weekly paclitaxel: an effective and well-tolerated treatment in patients with advanced breast cancer.Crit Rev Oncol Hematol. 2002 Dec 27;44 Suppl:S15-30. doi: 10.1016/s1040-8428(02)00105-1. Crit Rev Oncol Hematol. 2002. PMID: 12505596 Review.
Cited by
-
Ultrasound Pressure Estimation for Diagnosing Portal Hypertension in Patients Undergoing Dialysis for Chronic Kidney Disease.J Ultrasound Med. 2022 Sep;41(9):2181-2189. doi: 10.1002/jum.15897. Epub 2021 Dec 1. J Ultrasound Med. 2022. PMID: 34850412 Free PMC article. Clinical Trial.
-
Mechanics of Small-Scale Spherical Inclusions Using Nonlocal Poroelasticity Integrated with Light Gradient Boosting Machine.Micromachines (Basel). 2024 Jan 30;15(2):210. doi: 10.3390/mi15020210. Micromachines (Basel). 2024. PMID: 38398939 Free PMC article.
-
Multiscale computational modeling of cancer growth using features derived from microCT images.Sci Rep. 2021 Sep 17;11(1):18524. doi: 10.1038/s41598-021-97966-1. Sci Rep. 2021. PMID: 34535748 Free PMC article.
-
Developing an Interface and Investigating Optimal Parameters for Real-Time Intracardiac Subharmonic-Aided Pressure Estimation.IEEE Trans Ultrason Ferroelectr Freq Control. 2021 Mar;68(3):579-585. doi: 10.1109/TUFFC.2020.3016264. Epub 2021 Feb 25. IEEE Trans Ultrason Ferroelectr Freq Control. 2021. PMID: 32784134 Free PMC article.
-
Hepatic Vein Contrast-Enhanced Ultrasound Subharmonic Imaging Signal as a Screening Test for Portal Hypertension.Dig Dis Sci. 2021 Dec;66(12):4354-4360. doi: 10.1007/s10620-020-06790-6. Epub 2021 Jan 4. Dig Dis Sci. 2021. PMID: 33392869 Free PMC article. Clinical Trial.
References
-
- Curti BD, Urba WJ, Gregory Alvord W, Janik JE, Smith JW, Madara K, Longo DL. Interstitial Pressure of Subcutaneous Nodules in Melanoma and Lymphoma Patients: Changes during Treatment. Cancer Res 1993;53:2204–2207. - PubMed
-
- Dave JK, Halldorsdottir VG, Eisenbrey JR, Forsberg F. Processing of subharmonic signals from ultrasound contrast agents to determine ambient pressures. Ultrason Imaging 2012a;34:81–92. - PubMed
-
- Dave J, Halldorsdottir V, Eisenbrey J, Liu JB, Lin F, Zhou JH, Wang HK, Park S, Dianis S, Chalek CL, Lin F, Thomenius K, Brown DB, Forsberg F Investigating the efficacy of subharmonic aided pressure estimation for portal vein pressures and portal hypertension monitoring. Ultrasound Med Biol. 2012b;38:1784–1798. - PMC - PubMed
-
- Dave JK, Halldorsdottir VG, Eisenbrey JR, Merton DA, Liu JB, Machado P, Zhao H, Park S, Dianis S, Chalek CL, Thomenius KE, Brown DB, Forsberg F. On the implementation of an automated acoustic output optimization algorithm for subharmonic aided pressure estimation. Ultrasonics 2013;53:880–888. - PMC - PubMed
Publication types
MeSH terms
Substances
Grants and funding
LinkOut - more resources
Full Text Sources
Other Literature Sources
Medical
Miscellaneous

