

Stability of patient-specific features of altered DNA replication timing in xenografts of primary human acute lymphoblastic leukemia
- PMID: 28433605
- PMCID: PMC5491210
- DOI: 10.1016/j.exphem.2017.04.004
Stability of patient-specific features of altered DNA replication timing in xenografts of primary human acute lymphoblastic leukemia
Abstract
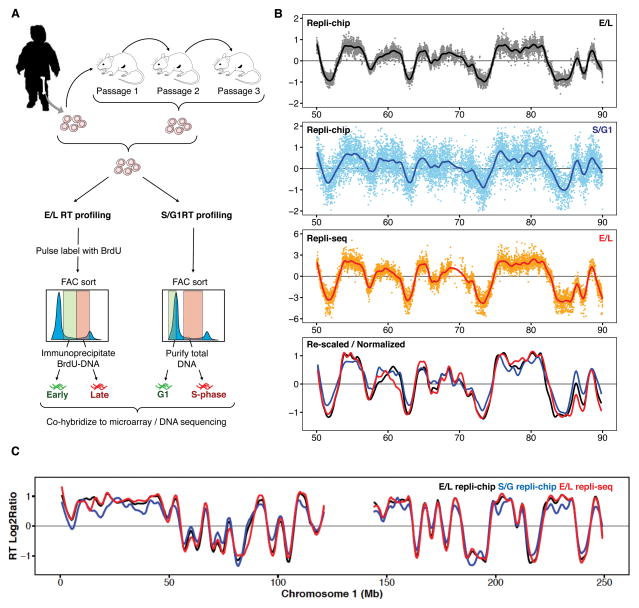
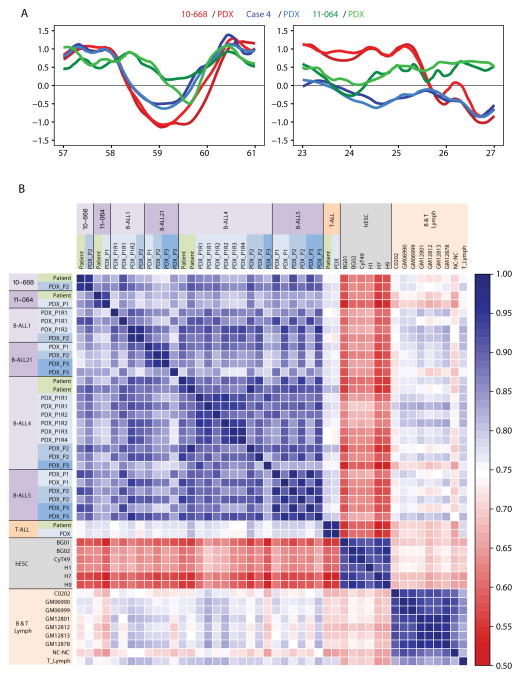
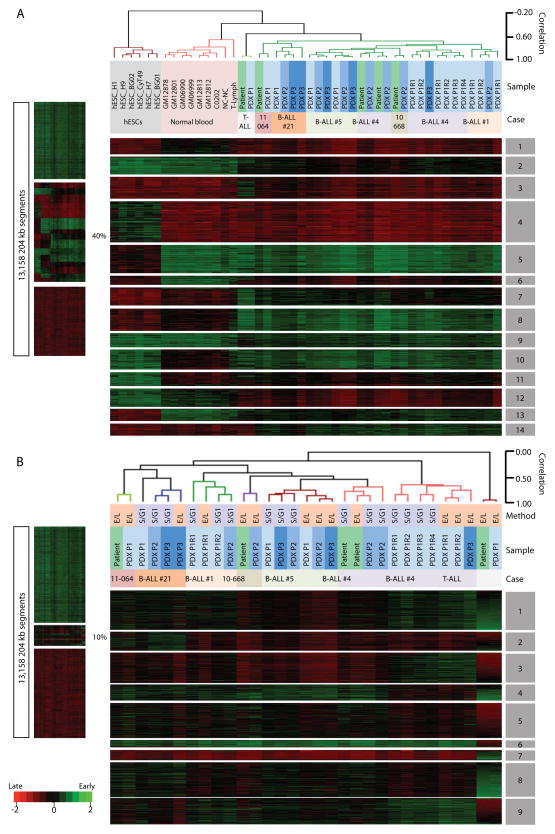
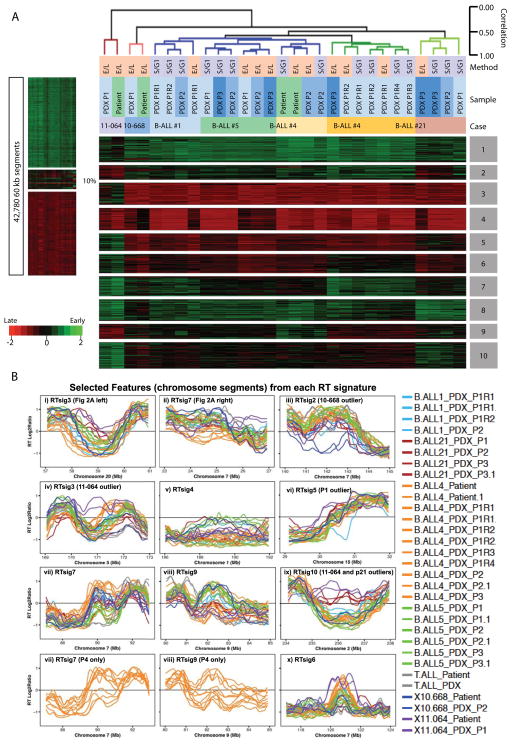
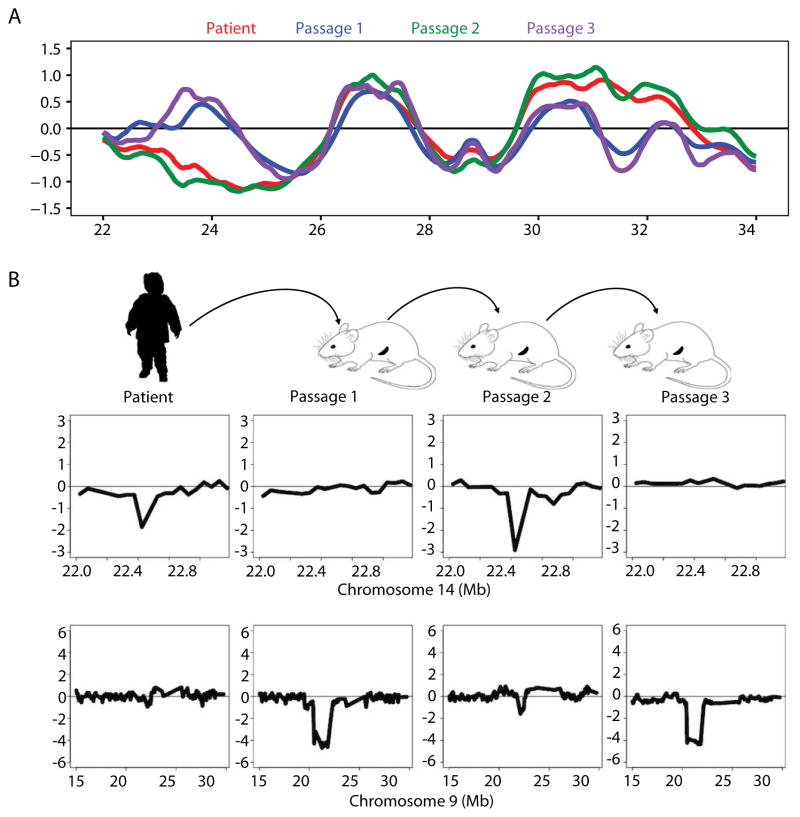
Genome-wide DNA replication timing (RT) profiles reflect the global three-dimensional chromosome architecture of cells. They also provide a comprehensive and unique megabase-scale picture of cellular epigenetic state. Thus, normal differentiation involves reproducible changes in RT, and transformation generally perturbs these, although the potential effects of altered RT on the properties of transformed cells remain largely unknown. A major challenge to interrogating these issues in human acute lymphoid leukemia (ALL) is the low proliferative activity of most of the cells, which may be further reduced in cryopreserved samples and difficult to overcome in vitro. In contrast, the ability of many human ALL cell populations to expand when transplanted into highly immunodeficient mice is well documented. To examine the stability of DNA RT profiles of serially passaged xenografts of primary human B- and T-ALL cells, we first devised a method that circumvents the need for bromodeoxyuridine incorporation to distinguish early versus late S-phase cells. Using this and more standard protocols, we found consistently strong retention in xenografts of the original patient-specific RT features. Moreover, in a case in which genomic analyses indicated changing subclonal dynamics in serial passages, the RT profiles tracked concordantly. These results indicate that DNA RT is a relatively stable feature of human ALLs propagated in immunodeficient mice. In addition, they suggest the power of this approach for future interrogation of the origin and consequences of altered DNA RT in ALL.
Copyright © 2017 ISEH - International Society for Experimental Hematology. Published by Elsevier Inc. All rights reserved.
Figures
Similar articles
-
Variegated clonality and rapid emergence of new molecular lesions in xenografts of acute lymphoblastic leukemia are associated with drug resistance.Exp Hematol. 2015 Jan;43(1):32-43.e1-35. doi: 10.1016/j.exphem.2014.09.007. Epub 2014 Oct 29. Exp Hematol. 2015. PMID: 25450514 Free PMC article.
-
Replication timing alterations in leukemia affect clinically relevant chromosome domains.Blood Adv. 2019 Nov 12;3(21):3201-3213. doi: 10.1182/bloodadvances.2019000641. Blood Adv. 2019. PMID: 31698451 Free PMC article.
-
Speed of leukemia development and genetic diversity in xenograft models of T cell acute lymphoblastic leukemia.Oncotarget. 2016 Jul 5;7(27):41599-41611. doi: 10.18632/oncotarget.9313. Oncotarget. 2016. PMID: 27191650 Free PMC article.
-
Molecular genetics of acute lymphoblastic leukemia.Annu Rev Pathol. 2009;4:175-98. doi: 10.1146/annurev.pathol.4.110807.092227. Annu Rev Pathol. 2009. PMID: 18783329 Review.
-
Updates in the Pathology of Precursor Lymphoid Neoplasms in the Revised Fourth Edition of the WHO Classification of Tumors of Hematopoietic and Lymphoid Tissues.Curr Hematol Malig Rep. 2018 Aug;13(4):275-288. doi: 10.1007/s11899-018-0456-8. Curr Hematol Malig Rep. 2018. PMID: 29951888 Review.
Cited by
-
Rapid Irreversible Transcriptional Reprogramming in Human Stem Cells Accompanied by Discordance between Replication Timing and Chromatin Compartment.Stem Cell Reports. 2019 Jul 9;13(1):193-206. doi: 10.1016/j.stemcr.2019.05.021. Epub 2019 Jun 20. Stem Cell Reports. 2019. PMID: 31231024 Free PMC article.
-
Replication timing and nuclear structure.Curr Opin Cell Biol. 2018 Jun;52:43-50. doi: 10.1016/j.ceb.2018.01.004. Epub 2018 Feb 4. Curr Opin Cell Biol. 2018. PMID: 29414592 Free PMC article. Review.
-
Genome-wide analysis of replication timing by next-generation sequencing with E/L Repli-seq.Nat Protoc. 2018 May;13(5):819-839. doi: 10.1038/nprot.2017.148. Epub 2018 Mar 29. Nat Protoc. 2018. PMID: 29599440 Free PMC article.
-
Perturbations in the Replication Program Contribute to Genomic Instability in Cancer.Int J Mol Sci. 2017 May 25;18(6):1138. doi: 10.3390/ijms18061138. Int J Mol Sci. 2017. PMID: 28587102 Free PMC article. Review.
-
Replication timing networks reveal a link between transcription regulatory circuits and replication timing control.Genome Res. 2019 Sep;29(9):1415-1428. doi: 10.1101/gr.247049.118. Epub 2019 Aug 21. Genome Res. 2019. PMID: 31434679 Free PMC article.
References
-
- Anderson K, Lutz C, van Delft FW, Bateman CM, Guo Y, Colman SM, Kempski H, Moorman AV, Titley I, Swansbury J, Kearney L, Enver T, Greaves M. Genetic variegation of clonal architecture and propagating cells in leukaemia. Nature. 2011;469:356–361. - PubMed
-
- Beer PA, Eaves CJ. Modeling normal and disordered human hematopoiesis. Trends Cancer. 2015;1:199–200. - PubMed
-
- Dileep V, Rivera-Mulia JC, Sima J, Gilbert DM. Large-Scale Chromatin Structure-Function Relationships during the Cell Cycle and Development: Insights from Replication Timing. Cold Spring Harb Symp Quant Biol 2015 - PubMed
-
- Eirew P, Steif A, Khattra J, Ha G, Yap D, Farahani H, Gelmon K, Chia S, Mar C, Wan A, Laks E, Biele J, Shumansky K, Rosner J, McPherson A, Nielsen C, Roth AJ, Lefebvre C, Bashashati A, de Souza C, Siu C, Aniba R, Brimhall J, Oloumi A, Osako T, Bruna A, Sandoval JL, Algara T, Greenwood W, Leung K, Cheng H, Xue H, Wang Y, Lin D, Mungall AJ, Moore R, Zhao Y, Lorette J, Nguyen L, Huntsman D, Eaves CJ, Hansen C, Marra MA, Caldas C, Shah SP, Aparicio S. Dynamics of genomic clones in breast cancer patient xenografts at single-cell resolution. Nature. 2015;518:422–426. - PMC - PubMed
Publication types
MeSH terms
Substances
Grants and funding
LinkOut - more resources
Full Text Sources
Other Literature Sources
