

Combined fMRI-MRS acquires simultaneous glutamate and BOLD-fMRI signals in the human brain
- PMID: 28433623
- PMCID: PMC5519502
- DOI: 10.1016/j.neuroimage.2017.04.030
Combined fMRI-MRS acquires simultaneous glutamate and BOLD-fMRI signals in the human brain
Abstract
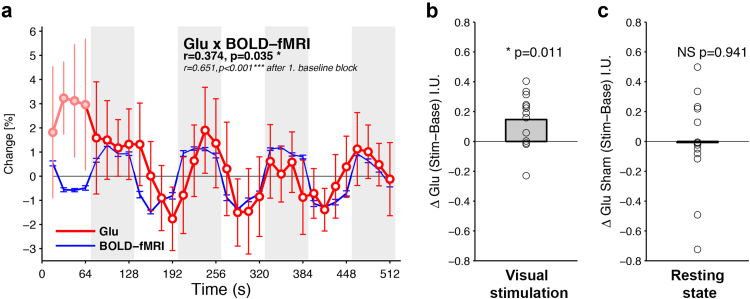
Combined fMRI-MRS is a novel method to non-invasively investigate functional activation in the human brain using simultaneous acquisition of hemodynamic and neurochemical measures. The aim of the current study was to quantify neural activity using combined fMRI-MRS at 7T. BOLD-fMRI and semi-LASER localization MRS data were acquired from the visual cortex of 13 participants during short blocks (64s) of flickering checkerboards. We demonstrate a correlation between glutamate and BOLD-fMRI time courses (R=0.381, p=0.031). In addition, we show increases in BOLD-fMRI (1.43±0.17%) and glutamate concentrations (0.15±0.05 I.U., ~2%) during visual stimulation. In contrast, we observed no change in glutamate concentrations in resting state MRS data during sham stimulation periods. Spectral line width changes generated by the BOLD-response were corrected using line broadening. In summary, our results establish the feasibility of concurrent measurements of BOLD-fMRI and neurochemicals using a novel combined fMRI-MRS sequence. Our findings strengthen the link between glutamate and functional activity in the human brain by demonstrating a significant correlation of BOLD-fMRI and glutamate over time, and by showing ~2% glutamate increases during 64s of visual stimulation. Our tool may become useful for studies characterizing functional dynamics between neurochemicals and hemodynamics in health and disease.
Keywords: BOLD fMRI; Functional Spectroscopy; Glutamate; Neurochemistry; Visual cortex.
Copyright © 2017 The Authors. Published by Elsevier Inc. All rights reserved.
Figures


Similar articles
-
Comparison of Neurochemical and BOLD Signal Contrast Response Functions in the Human Visual Cortex.J Neurosci. 2019 Oct 2;39(40):7968-7975. doi: 10.1523/JNEUROSCI.3021-18.2019. Epub 2019 Jul 29. J Neurosci. 2019. PMID: 31358655 Free PMC article.
-
Glutamate dynamics and BOLD response during OCD symptom provocation in the lateral occipital cortex: A 7 Tesla fMRI-fMRS study.J Affect Disord. 2024 Dec 15;367:416-425. doi: 10.1016/j.jad.2024.08.216. Epub 2024 Sep 2. J Affect Disord. 2024. PMID: 39233246
-
Resting-state fMRI signals contain spectral signatures of local hemodynamic response timing.Elife. 2023 Aug 11;12:e86453. doi: 10.7554/eLife.86453. Elife. 2023. PMID: 37565644 Free PMC article.
-
The neural basis of the blood-oxygen-level-dependent functional magnetic resonance imaging signal.Philos Trans R Soc Lond B Biol Sci. 2002 Aug 29;357(1424):1003-37. doi: 10.1098/rstb.2002.1114. Philos Trans R Soc Lond B Biol Sci. 2002. PMID: 12217171 Free PMC article. Review.
-
Biophysical and physiological origins of blood oxygenation level-dependent fMRI signals.J Cereb Blood Flow Metab. 2012 Jul;32(7):1188-206. doi: 10.1038/jcbfm.2012.23. Epub 2012 Mar 7. J Cereb Blood Flow Metab. 2012. PMID: 22395207 Free PMC article. Review.
Cited by
-
Glutamate concentration of medial prefrontal cortex is inversely associated with addictive behaviors: a translational study.Transl Psychiatry. 2024 Oct 12;14(1):433. doi: 10.1038/s41398-024-03145-x. Transl Psychiatry. 2024. PMID: 39396023 Free PMC article.
-
A Resting-State Functional MR Imaging and Spectroscopy Study of the Dorsal Hippocampus in the Chronic Unpredictable Stress Rat Model.J Neurosci. 2019 May 8;39(19):3640-3650. doi: 10.1523/JNEUROSCI.2192-18.2019. Epub 2019 Feb 25. J Neurosci. 2019. PMID: 30804096 Free PMC article.
-
Investigating the neurochemistry of the human visual system using magnetic resonance spectroscopy.Brain Struct Funct. 2022 May;227(4):1491-1505. doi: 10.1007/s00429-021-02273-0. Epub 2021 Apr 26. Brain Struct Funct. 2022. PMID: 33900453 Free PMC article. Review.
-
Event-related functional magnetic resonance spectroscopy.Neuroimage. 2023 Aug 1;276:120194. doi: 10.1016/j.neuroimage.2023.120194. Epub 2023 May 26. Neuroimage. 2023. PMID: 37244321 Free PMC article. Review.
-
3D magnetic resonance spectroscopic imaging reveals links between brain metabolites and multidimensional pain features in fibromyalgia.Eur J Pain. 2021 Oct;25(9):2050-2064. doi: 10.1002/ejp.1820. Epub 2021 Jun 22. Eur J Pain. 2021. PMID: 34102707 Free PMC article.
References
-
- Amaro E., Jr., Barker G.J. Study design in fMRI: basic principles. Brain Cogn. 2006;60(3):220–232. - PubMed
-
- Apsvalka D., Gadie A., Clemence M., Mullins P.G. Event-related dynamics of glutamate and BOLD effects measured using functional magnetic resonance spectroscopy (fMRS) at 3T in a repetition suppression paradigm. Neuroimage. 2015;118:292–300. - PubMed
-
- Brainard D.H. The psychophysics toolbox. Spat. Vis. 1997;10(4):433–436. - PubMed
Publication types
MeSH terms
Substances
Grants and funding
LinkOut - more resources
Full Text Sources
Other Literature Sources
Medical
