

Unbiased Quantification of Subplate Neuron Loss following Neonatal Hypoxia-Ischemia in a Rat Model
- PMID: 28434006
- PMCID: PMC5519415
- DOI: 10.1159/000460815
Unbiased Quantification of Subplate Neuron Loss following Neonatal Hypoxia-Ischemia in a Rat Model
Abstract
Background: Cellular targets of neonatal hypoxia-ischemia (HI) include both oligodendrocyte and neuronal lineages with differences in the patterns of vulnerable cells depending upon the developmental stage at which the injury occurs. Injury to the developing white matter is a characteristic feature of human preterm brain injury. Data are accumulating, however, for neuronal injury in the developing cerebral cortex. In the most widely used rodent model of preterm HI brain injury, conflicting data have been reported regarding the sensitivity of subplate neurons to early neonatal HI, with some reports of selective vulnerability and others that find no increased loss of subplate neurons in comparison with other cortical layers. Methods used to identify subplate neurons and quantify their numbers vary across studies.
Objective: To use recently developed cortical layer-specific markers quantified with definitive stereologic methods to determine the magnitude and specificity of subplate neuron cell loss following neonatal HI in a rodent model.
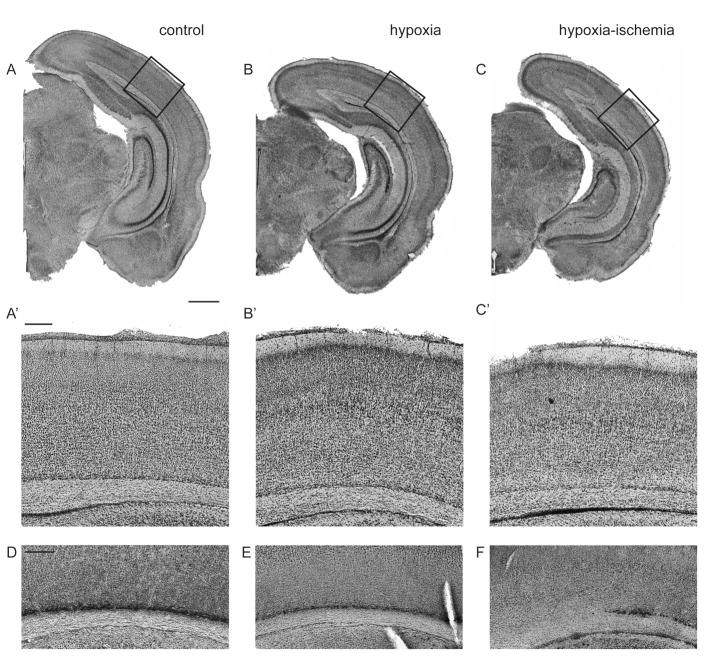
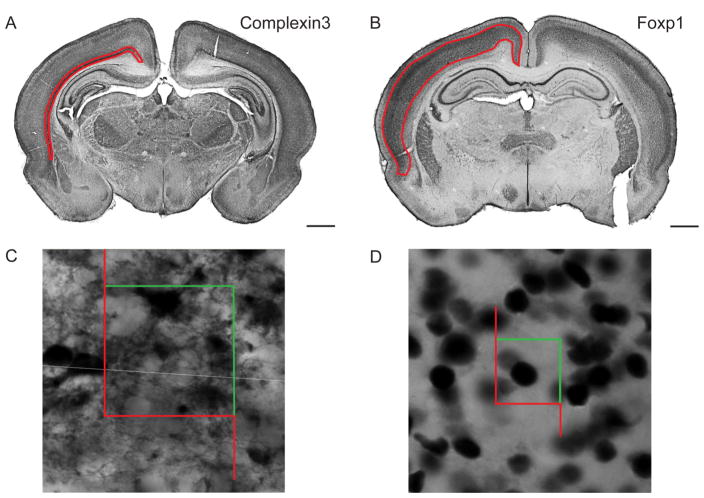
Methods: Postnatal day 2 (P2) rats underwent right common carotid artery coagulation followed by 2-3 h of hypoxia (5.6% oxygen). Categorically moderately injured brains were stained with subplate and cortical layer III-V markers (Complexin3 and Foxp1, respectively) at P8 and P21 (Foxp1 only). An Optical Fractionator was used to quantify subplate and middle/lower cortical neuronal numbers and these were compared across groups (naive control, hypoxia hemisphere, and HI hemisphere).
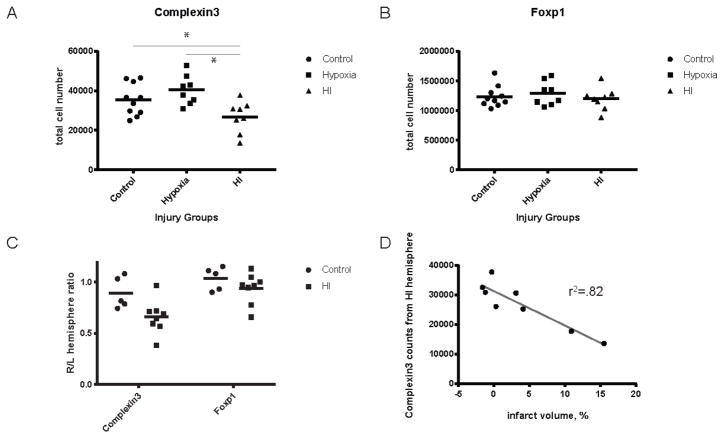
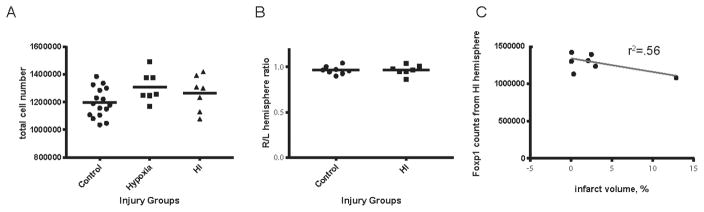
Results: Following HI at P2 in rats, the total Complexin3-expressing subplate neuron number decreases significantly in the HI hemisphere compared with naive controls or hypoxia alone (HI vs. control 26,747 ± 7,952 vs. 35,468 ± 8,029, p = 0.04; HI vs. hypoxia, 26,747 ± 7,952 vs. 40,439 ± 7,363, p = 0.003). In contrast, the total Foxp1-expressing layer III-V cell number did not differ across the 3 conditions at P8 (HI vs. control 1,195,085 ± 436,609 vs. 1,234,640 ± 178,540, p = 0.19; HI vs. hypoxia, 1,195,085 ± 436,609 vs. 1,289,195 ± 468,941, p = 0.35) and at P21 (HI vs. control 1,265,190 ± 48,089 vs. 1,195,632 ± 26,912, p = 0.19; HI vs. hypoxia, 1,265,190 ± 48,089 vs. 1,309,563 ± 41,669, p = 0.49).
Conclusions: There is significant biological variability inherent in both the subplate neuron cell number and the pattern and severity of cortical injury following HI at P2 in rats. Despite this variability, the subplate neuron cell number is lower following P2 HI in animals with mild or moderate cortical injury, whereas the middle-to-lower-layer cortical neuronal number is unchanged. In more severe cases, neurons are lost from the lower cortical layers, suggesting a relative vulnerability of subplate neurons.
Keywords: Brain injury; Cortical layer-specific marker; Optical Fractionator; Premature newborn.
© 2017 S. Karger AG, Basel.
Figures

Similar articles
-
Subplate in a rat model of preterm hypoxia-ischemia.Ann Clin Transl Neurol. 2014 Sep;1(9):679-91. doi: 10.1002/acn3.97. Epub 2014 Sep 30. Ann Clin Transl Neurol. 2014. PMID: 25493282 Free PMC article.
-
Magnesium sulphate induces preconditioning in preterm rodent models of cerebral hypoxia-ischemia.Int J Dev Neurosci. 2018 Nov;70:56-66. doi: 10.1016/j.ijdevneu.2018.01.002. Epub 2018 Feb 3. Int J Dev Neurosci. 2018. PMID: 29355709
-
White matter damage precedes that in gray matter despite similar magnetic resonance imaging changes following cerebral hypoxia-ischemia in neonatal rats.Exp Brain Res. 2005 Sep;166(1):56-60. doi: 10.1007/s00221-005-2340-8. Epub 2005 Jun 21. Exp Brain Res. 2005. PMID: 15968456
-
Perinatal subplate neuron injury: implications for cortical development and plasticity.Brain Pathol. 2005 Jul;15(3):250-60. doi: 10.1111/j.1750-3639.2005.tb00528.x. Brain Pathol. 2005. PMID: 16196392 Free PMC article. Review.
-
Developmental history of the subplate zone, subplate neurons and interstitial white matter neurons: relevance for schizophrenia.Int J Dev Neurosci. 2011 May;29(3):193-205. doi: 10.1016/j.ijdevneu.2010.09.005. Epub 2010 Sep 29. Int J Dev Neurosci. 2011. PMID: 20883772 Review.
Cited by
-
Fetal origin of brain dysmaturation in congenital heart disease - Challenges and opportunities for interventions.J Neonatal Perinatal Med. 2022;15(3):489-494. doi: 10.3233/NPM-210942. J Neonatal Perinatal Med. 2022. PMID: 35034913 Free PMC article. No abstract available.
-
Neonatal Hypoxia-Ischemia Causes Functional Circuit Changes in Subplate Neurons.Cereb Cortex. 2019 Feb 1;29(2):765-776. doi: 10.1093/cercor/bhx358. Cereb Cortex. 2019. PMID: 29365081 Free PMC article.
-
Neonatal Hypoxia-Ischemia Causes Persistent Intracortical Circuit Changes in Layer 4 of Rat Auditory Cortex.Cereb Cortex. 2022 Jun 7;32(12):2575-2589. doi: 10.1093/cercor/bhab365. Cereb Cortex. 2022. PMID: 34729599 Free PMC article.
-
Sleep Problems in Preschoolers With Autism Spectrum Disorder Are Associated With Sensory Sensitivities and Thalamocortical Overconnectivity.Biol Psychiatry Cogn Neurosci Neuroimaging. 2023 Jan;8(1):21-31. doi: 10.1016/j.bpsc.2021.07.008. Epub 2021 Jul 31. Biol Psychiatry Cogn Neurosci Neuroimaging. 2023. PMID: 34343726 Free PMC article.
-
Intranasally Administered Exosomes from Umbilical Cord Stem Cells Have Preventive Neuroprotective Effects and Contribute to Functional Recovery after Perinatal Brain Injury.Cells. 2019 Aug 8;8(8):855. doi: 10.3390/cells8080855. Cells. 2019. PMID: 31398924 Free PMC article.
References
-
- Blencowe H, Cousens S, Oestergaard MZ, Chou D, Moller A-B, Narwal R, et al. National, regional, and worldwide estimates of preterm birth rates in the year 2010 with time trends since 1990 for selected countries: a systematic analysis and implications. The Lancet. 2012 Jun 15;379:2162–2172. - PubMed
-
- The Lancet. The global burden of preterm birth. The Lancet. 2009 Oct;374:1214. - PubMed
-
- Volpe JJ. Neurology of the newborn. 5. Philadelphia: Saunders/Elsevier; 2008. Available from: http://www.loc.gov/catdir/toc/ecip083/2007044207.html.
-
- Ferriero DM. Neonatal Brain Injury. N Engl J Med. 2004;351:1985–1995. - PubMed
Publication types
MeSH terms
Grants and funding
LinkOut - more resources
Full Text Sources
Other Literature Sources
