. 2017 May 3;94(3):677-688.e6.
doi: 10.1016/j.neuron.2017.04.003. Epub 2017 Apr 20.

Medial Entorhinal Cortex Selectively Supports Temporal Coding by Hippocampal Neurons

Affiliations

Medial Entorhinal Cortex Selectively Supports Temporal Coding by Hippocampal Neurons

Nick T M Robinson et al. Neuron. .

Abstract

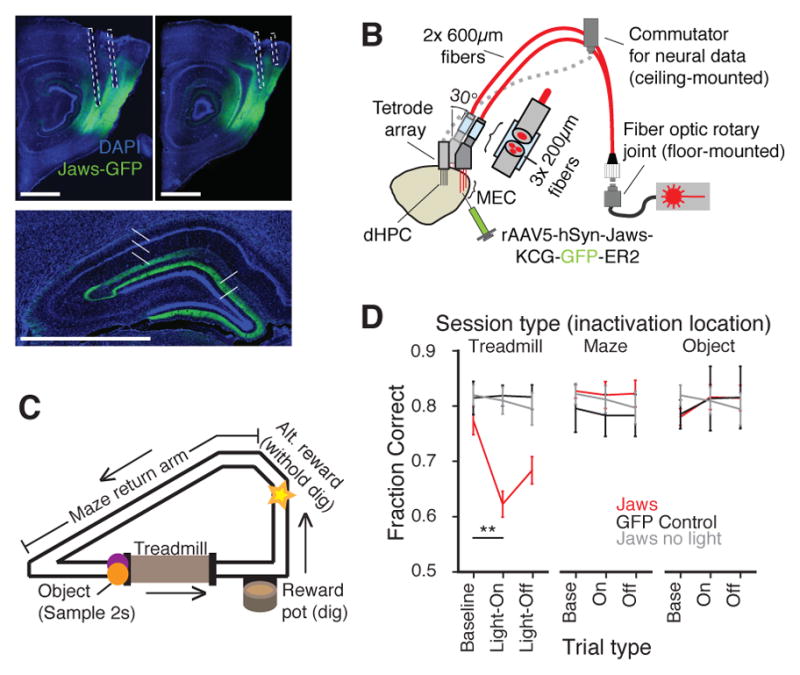
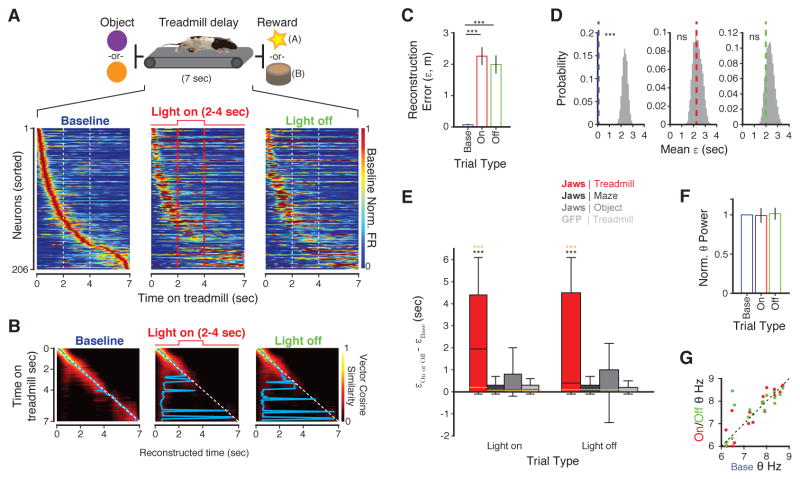
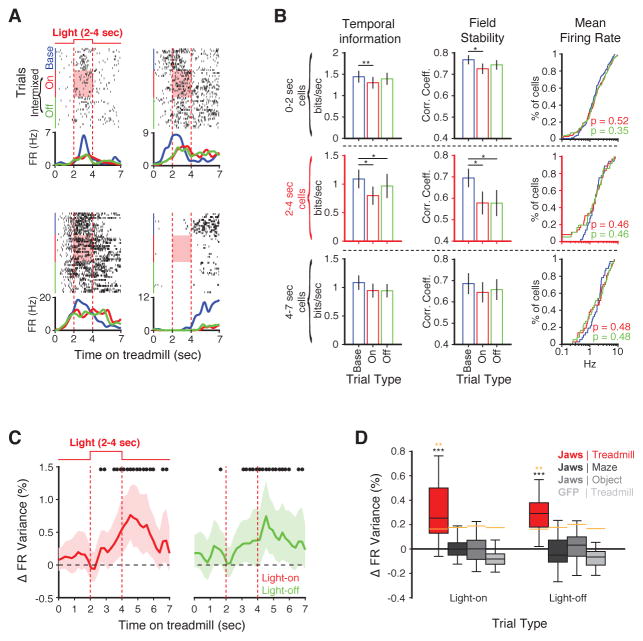
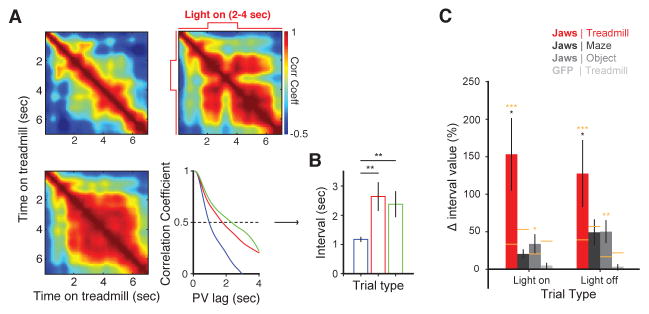
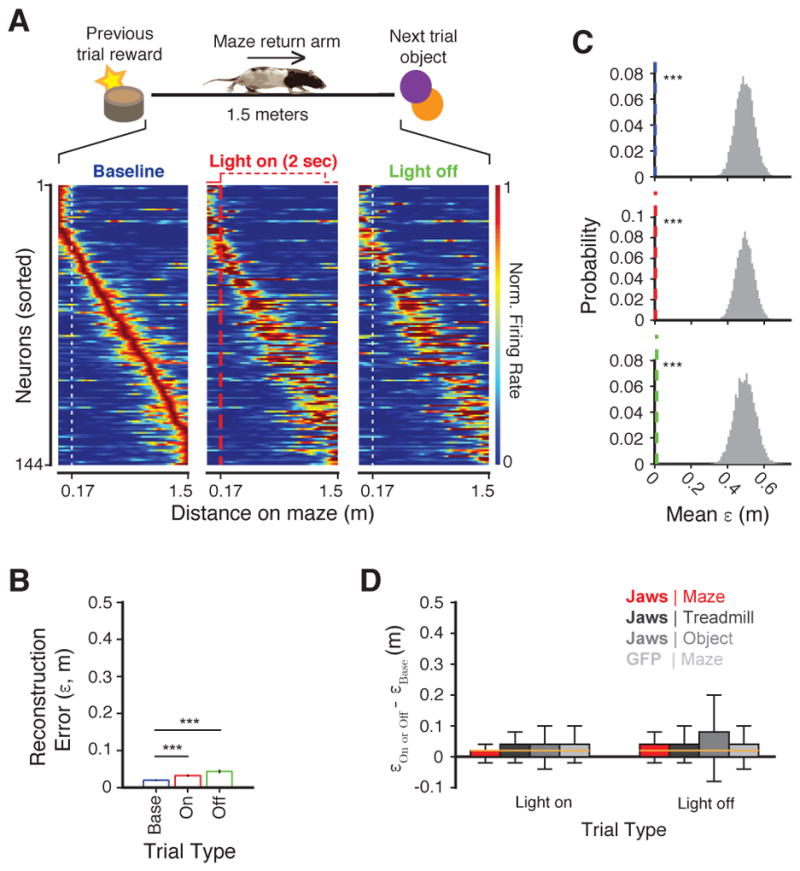
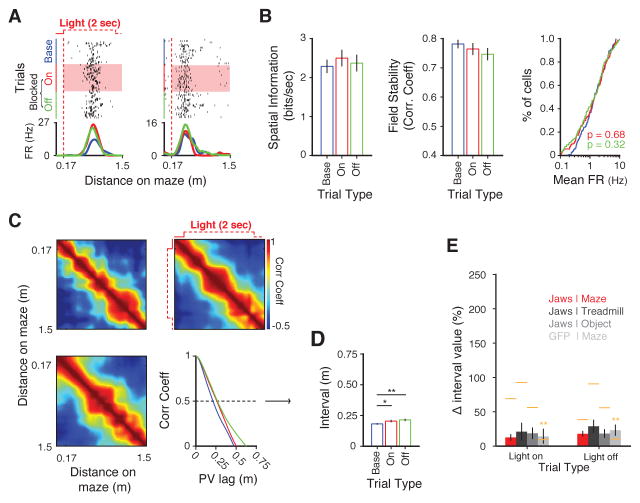
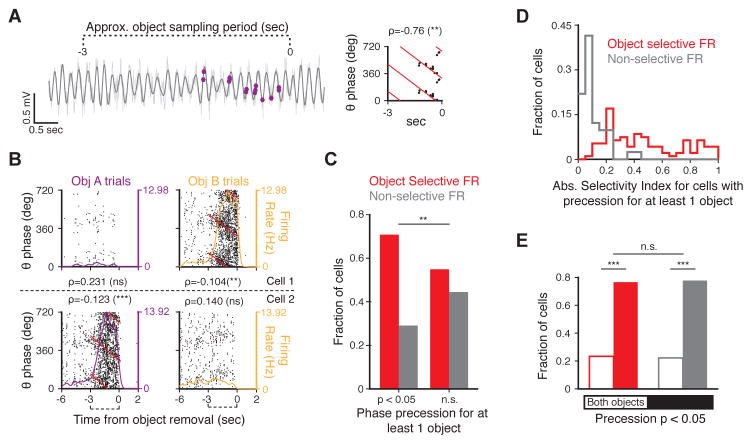
Recent studies have shown that hippocampal "time cells" code for sequential moments in temporally organized experiences. However, it is currently unknown whether these temporal firing patterns critically rely on upstream cortical input. Here we employ an optogenetic approach to explore the effect of large-scale inactivation of the medial entorhinal cortex on temporal, as well as spatial and object, coding by hippocampal CA1 neurons. Medial entorhinal inactivation produced a specific deficit in temporal coding in CA1 and resulted in significant impairment in memory across a temporal delay. In striking contrast, spatial and object coding remained intact. Further, we extended the scope of hippocampal phase precession to include object information relevant to memory and behavior. Overall, our work demonstrates that medial entorhinal activity plays an especially important role for CA1 in temporal coding and memory across time.

Keywords: CA1; hippocampus; medial entorhinal; memory; object selectivity; temporal coding; theta.


Figures

Figure 1
Figure 1. Transient optogenetic inactivation of MEC during a mnemonic delay selectively impairs memory performance
(A) Top: DAPI-counterstained sagittal sections through MEC. White lines: optic fiber tracks. Green fluorescence shows expression of GFP-conjugated Jaws in MEC. Bottom: coronal section through dorsal hippocampus in the same animal. GFP signal is detectable in stratum lacunosum moleculare of proximal CA1 and the middle molecular layer of the dentate gyrus, indicative of viral expression localized among hippocampal-projecting axonal fibers from MEC. SP: stratum pyramidale, SR: stratum radiatum, SLM: stratum lacunosum moleculare. mML: middle molecular layer, GCL: granule cell layer, DG: dentate gyrus. Scale bar is 2000μm. (B) Schematic for simultaneous hippocampal tetrode recordings and MEC optogenetic disruption. (C) Diagram of maze used for behavioral task. During separate sessions, the laser was triggered on the treadmill mnemonic delay (Treadmill Phase), during the return arm traversal (Maze Phase), and during object sampling (Object Phase) to assess effects of MEC inactivation at each epoch. (D) Behavioral performance during each inactivation paradigm. Performance is impaired only during sessions where the laser was triggered during the Treadmill phase (Kruskal-Wallis ANOVA (KW), asterisks indicate significant Tukey’s post hoc test). Data are represented mean ± SEM, * p< 0.05, ** p<0.01, *** p<0.001. See also Figure S1.
Figure 2
Figure 2. CA1 firing patterns during the delay are destabilized during and following MEC inactivation
(A) Top: diagram of behavioral epoch (Treadmill Phase). The animal runs for 7 seconds on a treadmill during the mnemonic delay. Bottom: sequence of firing fields during the treadmill delay on trials before (Baseline, blue), during (Light on, red), and after (Light off, green) the laser exposure. On Light on trials, the laser is triggered from 2–4 sec (red dashed lines). After the first Light on trial, Light on and Light off trials are pseudorandomly intermixed for the remainder of the session. Neurons are sorted according to the latency of their peak firing rate during Baseline trials. (B) Template matching population vector decoder (see methods). The mean spiking activity at successive windows across the delay is used to estimate a reconstructed time in each trial type based on the Baseline sequence template. Hotter colors indicate stronger matches. White-dashed line: idealized perfect decoding (perfect match between real and reconstructed time at each bin). Cyan line: observed decoding results, defined as the peak bin (x axis) in each decoding window (y axis). Deviation from the diagonal reflects the error in temporal reconstruction. (C) Mean±s.e.m decoding error in B (absolute difference between the white-dashed and cyan lines, signed rank test). (D) Comparison of mean error in C (colored vertical lines) to distribution of simulated mean errors (grey), where the template vectors were randomly shuffled to be temporally uninformative (see methods). Only Baseline is less erroneous than chance (p-value from 10,000 shuffles). (E) Summary of change in temporal reconstruction error from Baseline, for different inactivation paradigms. Legend specifies animal viral type (Jaws or GFP-only) and laser trigger location (Treadmill, Maze, or Object phase). Increased error compared to GFP-only controls is observed in Jaws-expressing animals only when the laser is triggered during the Treadmill phase (KW test, black asterisks indicate significant Tukey’s post hoc tests compared to the GFP-only control; gold asterisks indicate the median change in error from Baseline is significantly different from zero, p-value from 10,000 shuffles of trial type identities; gold bar indicates 95th percentile of the null distribution). (F) Baseline-normalized LFP theta power during the 2–4 sec inactivation window (signed-rank test). (G) Peak LFP theta frequency during the 2–4 sec inactivation window (signed-rank test). Data are represented mean ± SEM, box and whiskers are IQR and 1.5 × IQR respectively, * p< 0.05, ** p<0.01, *** p<0.001. See also Figure S2, S3,.
Figure 3
Figure 3. Time-locked perturbation of temporal firing fields
(A) Activity of four simultaneously recorded CA1 pyramidal cells on the treadmill during Baseline (blue), Light on (red), and Light off (green) trials. (B) Temporal information rate and field stability (signed rank test), and mean firing rate (Kolmogorov-Smirnov (KS) test) for cells in each time block of the delay (Before the laser window/0–2 sec, during the laser window/2–4 sec, and after the laser window/4–7 sec). (C) Percent change in firing rate variance across trials from Baseline as a function of time during the delay, for Light-on and Light-off trials (mean and 95% bootstrap confidence interval). Black asterisks indicate time periods where change in variance is significantly different than zero (p<0.05, bootstrap test). (D) Summary of firing rate variance changes from Baseline in different inactivation paradigms, for Light-on and Light-off trials. Only Jaws Treadmill phase inactivation sessions showed significant increases in firing rate variance compared to GFP controls (KW test, black asterisks indicate significant Tukey’s post hoc test compared to GFP-only controls; gold asterisks indicate the median change in variance is significantly different from zero, p-value from 10,000 shuffles of trial-type identities; gold bar indicates 95th percentile of the null distribution). Data are represented mean ± SEM, box and whiskers are IQR and 1.5 × IQR respectively, * p< 0.05, ** p<0.01, *** p<0.001. See also Figures S2, S3, S4, and S5.
Figure 4
Figure 4. Speed of population temporal decorrelation is diminished
(A) Population vector cross-correlation matrices (see methods) for each trial type, example session. The width of the diagonal band of heat reflects how quickly the neuronal population transitions through time. Lower right: mean correlation coefficient at each population vector lag for example session. Note where the curves cross the 0.5 correlation threshold. (B) Summary of the interval measuring the time it takes for the correlation curve in c to fall below 0.5 for each trial type, across sessions (signed rank test). (C) Summary of temporal correlation decay results for different inactivation paradigms, reported as the % change from the Baseline decay interval for Light on and Light off trials. Only Jaws Treadmill inactivation sessions showed significant decay interval expansion compared to GFP-only controls, although Object inactivation sessions show a slight expansion that is greater than expected by chance (KW test, black asterisks indicated significant Tukey’s post hoc tests compared to GFP-only controls; gold asterisks indicates the mean change in interval expansion is significantly different from zero, p-value from 10,000 shuffles of trial-type identities; gold bar indicates 95th percentile of the null distribution). Data are represented mean ± SEM, * p< 0.05, ** p<0.01, *** p<0.001.
Figure 5
Figure 5. Spatial firing patterns are resilient to transient MEC inactivation
(A) Top: diagram of behavioral epoch (Maze phase). The animal runs for 1.5 m along the return arm of the maze to begin the next trial. In separate sessions from the Treadmill phase inactivation, the laser is triggered on the maze. Bottom: sequence of spatial firing fields across the return arm on trials before (Baseline, blue), during (Light on, red), and after (Light off, green) the laser exposure. On Light on trials, the laser is triggered for 2 seconds at a fixed point in space on the return arm (red-dashed line). Light on and Light off trials are blocked. (B–D) Template matching population vector decoder, as in Figures 2C, 2D, and 2E but across the spatial extent of the return arm. (B) Summary of spatial decoding for each trial type. Error is minimal though increases marginally from Baseline in later trial types (signed rank test). (C) Comparison of mean error in B (colored vertical lines) to shuffled distributions (grey). The mean errors for all trial types are significantly lower than expected from spatially uninformative templates (p-value from 10,000 shuffled templates). (D) Summary of spatial reconstruction error for different inactivation paradigms. Error increases are minimal, and no groups exhibit significant differences from GFP-only controls (KW test; gold bars indicate 95th percentile of shuffle distribution where trial type identities were randomized and change in error recomputed 10,000 times). Data are represented mean ± SEM, box and whiskers are IQR and 1.5 × IQR respectively, * p<0.05, ** p<0.01, *** p<0.001. See also Figure S6..
Figure 6
Figure 6. Place fields remain intact
(A) Activity of two simultaneously recorded CA1 pyramidal cells on the maze during Baseline (blue), Light on (red), and Light off (green) trials. (B) Spatial information and field stability (signed rank test), and mean firing rate (KS test) of neurons with spatial firing fields during Jaws maze inactivation sessions. (C–E) Population vector cross-correlation and decay interval analysis, as in Figure 4 but across the spatial extent of the return arm. (C) Example session cross-correlation matrices and spatial correlation decay curve (lower right). (D) Mean spatial decay interval for Jaws Maze phase inactivation sessions (signed rank test). Light-on and Light-off trials show a small increase in mean decay interval compared to Baseline. (E) Summary of spatial correlation decay results for different inactivation paradigms. The % change in spatial decay interval does not differ between inactivation paradigms for Light on or Light off trials (KW test), suggesting the change in D is no more than expected from normal population drift across recording session (gold asterisks indicate mean change is significantly different from zero, p-value from 10,000 shuffles of trial type identities; gold bar indicates 95th percentile of the null distribution). Data are represented mean ± SEM, * p<0.05, ** p<0.01, *** p<0.001. See also Figure S6.
Figure 7
Figure 7. MEC inactivation does not affect CA1 object selectivity
(A) Selectivity responses for all cells active (>2 Hz mean firing rate) during the −3 to 0 second object sampling period, sorted by preferred object. Each row shows a neuron’s color-coded object selectivity profile (see methods) around the time of object sampling (purple indicates selectivity for object A, orange for object B. Substantial fractions of cells exhibit selective firing for one object or the other during the object sampling period. (B) Activity of two highly object-selective neurons during object sampling, displayed separately for object A (left) and object B (right) trials, and for Baseline (blue), Light on (red), and Light off (green) trials. (C) Left: cumulative distribution of p-values for object selectivity. The black dashed line indicates the threshold (p<0.05) for significance. Right: the percentage of cells with significant selectivity indices (SI) in each trial type (Pearson’s χ2 of independence). (D) SI values in each trial type for cells with significant baseline selectivity. These values do not change significantly (signed rank test). (E) Summary of absolute change in SI values during Light on and Light off trials for cells with significant baseline selectivity, shown for different inactivation paradigms. These values are not significantly different across inactivation paradigms (KW test). Data are represented mean ± SEM, box and whiskers are IQR and 1.5 × IQR respectively, * p<0.05, ** p<0.01, *** p<0.001. See also Figure S7.
Figure 8
Figure 8. Theta phase precession in CA1 object responses
(A) Left: unfiltered (light grey) and filtered (4–12 Hz) traces of LFP from a single trial object sampling period, with spike phase advancement (purple dots) from a highly object-selective neuron. Right: scatter plot of spike phases shown at left against their timestamp within the object sampling window (−3 to 0 sec), with circular-linear regression lines (red), correlation coefficient, and significance overlaid (see methods). (B) Two example highly-object selective cells, shown separately for object A (purple) and object B (orange) trials, with each spike plotted as a function of theta phase and time, and smoothed firing rate curve, regression line, correlation coefficient, and significance overlaid. Data is plotted across two theta cycles for clarity. (C) Fraction of cells that exhibit significant firing rate changes according to object identity (determined by SI p-value), calculated separately for the population of cells with significant phase precession for at least one object and those without significant precession (determined by circular-linear correlation coefficient p-value and regression slope sign for spiking during trials for the preferred object). Neurons with object-selective firing rates are comparatively overrepresented in the phase precessing group (Pearson’s χ2 test of independence). (D) Distribution of absolute object SI values for cells with significant phase precession for at least one object, shown separately for cells with significant firing rate changes according to object identity (red) and for cells that do not (grey). Precessing cells exhibit a wide distribution of firing rate differences between objects (1 would indicate all spikes were fired for only one object). (E) Fraction of cells that exhibit phase precession for both objects (open bars) or a single object (shaded bars), shown separately for cells that show significant firing rate selectivity for objects (red) and those that do not (grey). Most cells exhibit phase precession for only one object, and this fraction does change according to whether there is a significant firing rate change between objects (Pearson’s χ2 test of independence). See also Figure S7.

Similar articles

Cited by

References

    1. Basu J, Srinivas KV, Cheung SK, Taniguchi H, Haung ZJ, Siegelbaum SA. A cortico-hippocampal learning rule shapes inhibitory microcircuit activity to enhance hippocampal information flow. Neuron. 2014;79(6):1208–1221. - PMC - PubMed
    1. Bittner KC, Grienberger C, Vaidya SP, Milstein AD, Macklin JJ, Suh J, Tonegawa S, Magee JC. Conjunctive input processing drives feature selectivity in hippocampal CA1 neurons. Nature Neuroscience. 2015;18:1133–1142. - PMC - PubMed
    1. Brandon MP, Bogaard AR, Libby CP, Connerney MA, Gupta K, Hasselmo ME. Reduction of theta rhythm dissociates grid cell spatial periodicity from directional tuning. Science. 2011;332(6029):595–599. - PMC - PubMed
    1. Brandon MP, Koenig J, Leutgeb JK, Leutgeb S. New and distinct hippocampal place codes are generated in a new environment during septal inactivation. Neuron. 2014;82:789–796. - PMC - PubMed
    1. Chuong AS, Miri ML, Busskamp V, Matthews GA, Acker LC, Sorensen AT, Young A, Klapoetke NC, Henninger MA, Kodandaramaiah SB, Ogawa M, Ramanial SB, Bandler RC, Allen BD, Forest CR, Chow BY, Han X, Lin Y, Tye KM, Roska B, Cardin JA, Boyden ES. Noninvasive optical inhibition with a red-shifted microbial rhodopsin. Nature Neuroscience. 2014;17:1123–1129. - PMC - PubMed