Review
. 2017 Jul;92(1):47-66.
doi: 10.1016/j.kint.2016.12.037. Epub 2017 Apr 20.

Current and potential imaging applications of ferumoxytol for magnetic resonance imaging

Affiliations
Review

Current and potential imaging applications of ferumoxytol for magnetic resonance imaging

Gerda B Toth et al. Kidney Int. 2017 Jul.

Abstract

Contrast-enhanced magnetic resonance imaging is a commonly used diagnostic tool. Compared with standard gadolinium-based contrast agents, ferumoxytol (Feraheme, AMAG Pharmaceuticals, Waltham, MA), used as an alternative contrast medium, is feasible in patients with impaired renal function. Other attractive imaging features of i.v. ferumoxytol include a prolonged blood pool phase and delayed intracellular uptake. With its unique pharmacologic, metabolic, and imaging properties, ferumoxytol may play a crucial role in future magnetic resonance imaging of the central nervous system, various organs outside the central nervous system, and the cardiovascular system. Preclinical and clinical studies have demonstrated the overall safety and effectiveness of this novel contrast agent, with rarely occurring anaphylactoid reactions. The purpose of this review is to describe the general and organ-specific properties of ferumoxytol, as well as the advantages and potential pitfalls associated with its use in magnetic resonance imaging. To more fully demonstrate the applications of ferumoxytol throughout the body, an imaging atlas was created and is available online as supplementary material.

Keywords: chronic kidney disease; magnetic resonance imaging; nephrotoxicity.


Conflict of interest statement

Authors Conflicts of Interest:

The authors have no conflicts of interest to disclose.

Figures

Figure 1
Figure 1
Phases of GBCA (A) and ferumoxytol (B) enhancement. Unlike GBCA, ferumoxytol has a long intravascular half-life that results in a long blood pool phase prior to detectable contrast extravasation. GBCA (gadolinium based contrast agents). Images provided courtesy of Dr. Neuwelt.
Figure 2
Figure 2
Ferumoxytol traffics from systemic circulation to reactive lesions: immunocompetent rat xenograft model demonstrate sex travascular accumulation of ferumoxytol that correlated to the presence of activated macrophages. A) MRI signal enhancement occurred in xenografted but not saline-injected hemispheres. Blue arrows show marked hypointense signal on T1 MR that correlates with histologic findings of intense immunostaining for ferumoxytol in macrophages using dextran-1. Yellow arrows show typical hyperintense enhancement on T1 MRI that correlates with diffuse milder staining for ferumoxytol in brain parenchyma and activated astrocytes using dextran-1. White arrowhead shows no signal change after saline injection in contralateral control hemisphere. B) Immunostaining demonstrates that ferumoxytol traffics from the systemic circulation to reactive CNS lesions. Immunostains performed 48 h after H460 non-small cell lung carcinoma inoculation into caudate nucleus and 24 h after IV ferumoxytol administration. A representative inflammatory lesion was immunostained with dextran-1 (Dx1) for the ferumoxytol coating (red), CD163 for macrophages (brown), and GFAP for astrocytes (brown). All cell nuclei were counterstained with hematoxylin. T depicts live tumor cells. Arrowhead depicts reactive cells located outside of the main lesion. Scale bars, 100 μm. C) Electron microscopy of a ferumoxytol laden macrophage (left) and two astrocyte processes (right). Left image: Iron oxide nanoparticles appear as electron-dense particles measuring ~30 nm in diameter located cytoplasmically and clustering around lysosomes (L). Right image: Two astrocyte processes (AP) showing dispersed, electron-dense ferumoxytol nanoparticles. N depicts neurons. Insets in both photos show a 27–33 nm diameter particle. Magnification 6800X, scale bar, 1 μm. From McConnell et al, 2016 used with permission from Nanomedicine: Nanotechnology, Biology and Medicine.
Figure 2
Figure 2
Ferumoxytol traffics from systemic circulation to reactive lesions: immunocompetent rat xenograft model demonstrate sex travascular accumulation of ferumoxytol that correlated to the presence of activated macrophages. A) MRI signal enhancement occurred in xenografted but not saline-injected hemispheres. Blue arrows show marked hypointense signal on T1 MR that correlates with histologic findings of intense immunostaining for ferumoxytol in macrophages using dextran-1. Yellow arrows show typical hyperintense enhancement on T1 MRI that correlates with diffuse milder staining for ferumoxytol in brain parenchyma and activated astrocytes using dextran-1. White arrowhead shows no signal change after saline injection in contralateral control hemisphere. B) Immunostaining demonstrates that ferumoxytol traffics from the systemic circulation to reactive CNS lesions. Immunostains performed 48 h after H460 non-small cell lung carcinoma inoculation into caudate nucleus and 24 h after IV ferumoxytol administration. A representative inflammatory lesion was immunostained with dextran-1 (Dx1) for the ferumoxytol coating (red), CD163 for macrophages (brown), and GFAP for astrocytes (brown). All cell nuclei were counterstained with hematoxylin. T depicts live tumor cells. Arrowhead depicts reactive cells located outside of the main lesion. Scale bars, 100 μm. C) Electron microscopy of a ferumoxytol laden macrophage (left) and two astrocyte processes (right). Left image: Iron oxide nanoparticles appear as electron-dense particles measuring ~30 nm in diameter located cytoplasmically and clustering around lysosomes (L). Right image: Two astrocyte processes (AP) showing dispersed, electron-dense ferumoxytol nanoparticles. N depicts neurons. Insets in both photos show a 27–33 nm diameter particle. Magnification 6800X, scale bar, 1 μm. From McConnell et al, 2016 used with permission from Nanomedicine: Nanotechnology, Biology and Medicine.
Figure 3
Figure 3
Possible sequences with ferumoxytol in the CNS during the dynamic (A), blood pool (B, C), and delayed (D, E) phases after administration in a patient with newly diagnosed PCNSL. A: CBV map calculated from DSC perfusion with ferumoxytol shows mildly elevated rCBV within the neoplasm. B: Susceptibility weighted image shows curvilinear branching hypointensities compatible withs abnormal tumor vasculature. C: SS-CBV map with high resolution shows increased blood volume. D: Axial T1 MR demonstrates typical enhancement 24 hours after ferumoxytol injection. E: Axial T2 MR shows marked hypointensity within the tumor 24 hours after ferumoxytol administration. Images provided courtesy of Dr. Neuwelt.
Figure 4
Figure 4
Axial brain MRI of 19-year-old man who had undergone previous radiation and chemotherapy for glioblastoma multiforme, with clinical suspicion for pseudoprogression. A: Spin-echo (SE) T1 MR obtained 24 h after ferumoxytol administration shows moderately intense enhancement. B: SE T1 gadoteridol-enhanced MR shows concordant enhancement size and intensity. C: Magnetization-prepared rapid gradient-echo (MPRAGE) MR performed 24 h after ferumoxytol administration shows moderate (though less homogeneous) enhancement intensity compared with SE image. D: Gadoteridol-enhanced MPRAGE shows more homogeneous and greater enhancement intensity than the ferumoxytol-enhanced MPRAGE scan. Administered ferumoxytol dose was 510 mg (Hamilton et. al. 2011). From Hamilton et al. 2011, used with permission from AJR.
Figure 5
Figure 5
Axial T1-weighted post contrast MRI images in two different patients with similar appearing frontal midline lesions. The mass (yellow arrows) enhances similarly with both Gd and Fe in a patient with melanoma metastases (A, B). A meningioma (yellow arrowheads) only enhances with Gd (C), not Fe (D) Of note, the glioblastoma in the same images (black arrows) enhances avidly with both agents (C, D). Images provided courtesy of Dr. Neuwelt.
Figure 6
Figure 6
SS-CBV maps using ferumoxytol offer higher spatial resolution and allow better identification of hypervascular areas for surgical targeting in glioblastoma patients. Compare spatial resolution of cerebral blood volume (CBV) maps using DSC PWI with a standard dose of gadolinium (DSC-CBV) (left) and SS ferumoxytol CBV map using ferumoxytol (3 mg/kg). The scan on the right more clearly demonstrates a central hypervascular area in the right occipital hemisphere with the greatest vascularity, which is likely the most malignant portion of the tumor. Images provided courtesy of Dr. Neuwelt.
Figure 7
Figure 7
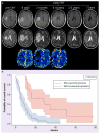
Pseudoprogression can be diagnosed using perfusion MRI with ferumoxytol and correlates with OS. A) Axial MR images of a 47-year-old woman with glioblastoma. Patient underwent T1-weighted sequences post Gd and T2-weighted postoperative images prior to CRT. Eight days after CRT completion patient scans showed radiographic worsening followed by further deterioration on follow-up MRI while the patient continued to receive adjuvant temozolomide chemotherapy. Though updated Response Assessment in Neuro-Oncology Working Group (RANO) criteria would indicate true tumor progression, the blood volume of the lesion was low on ferumoxytol DSC-CBV maps, which instead indicates pseudoprogression. The patient received only 3 courses of bevacizumab and continued adjuvant temozolomide. Substantial improvement is seen on 5-month follow-up MRI after completion of bevacizumab therapy. Seven years after completion of CRT, the image indicates that the patient is stable without evidence of recurrence/progression (the patient is still on adjuvant temozolomide chemotherapy). B) Kaplan-Meier estimates of overall survival by the presence or absence of pseudoprogression. CRT: Chemoradiotherapy. From Gharamanov et al. 2014, modified with permission from CNS Oncology.
Figure 8
Figure 8
42 year old male patient with glioblastoma. T1-weighted post gadoteridol scan shows no/minimal enhancement. In contrast, a highly vascular area (arrow) is seen on the high resolution steady-state CBV maps obtained with ferumoxytol. Residual tumor with high CBV shows reduction post chemoradiation therapy (post-surgery scan), and continued decrease on 1 month post chemoradiation scan, indicating treatment response. Images provided courtesy of Dr. Neuwelt.
Figure 9
Figure 9
A) Patient with the suspicion of pontine glioma was diagnosed with pontine demyelination using ferumoxytol. Precontrast T1-weighted imaging shows little abnormality. B) T1-weighted sagittal MRI 24-hours post-USPIO shows diffuse intense enhancement due to ferumoxytol uptake in the pons (arrow). C) Axial noncontrast T2-weighted MR shows patchy nonspecific increased T2 signal within the pons (arrow). D) Axial T2-weighted MR obtained 24 hours post-ferumoxytol shows patchy hypointensities in the pons (arrow) correlating with ferumoxytol uptake. E) Ferumoxytol-based DSC perfusion imaging shows low rCBV centrally within the pons (arrow) corresponding to the area of enhancing abnormality that is similar to normal-appearing white matter, a finding supportive of demyelination rather than high grade primary CNS neoplasm. DSC = dynamic susceptibility-weighted contrast-enhanced; GBCA = gadolinium-based contrast agent; rCBV = relative cerebral blood volume; USPIO = ultrasmall superparamagnetic iron oxide. From Farrell et al. 2013, used with permission from Neurology.
Figure 10
Figure 10
Ferumoxytol MR angiography improves visualization of cerebral microvasculature when compared to Gadolinium at 7T field strength. Gadolinium-enhanced 3D T1-weighted gradient echo volumetric interpolated brain examination (VIBE) MRA of the supraclinoid internal carotid arteries (left) shows faint visualization of lenticulostriate vessels (white arrows). Ferumoxytol-enhanced MRA (right) demonstrates markedly improved visualization of the lenticulostriate microvasculature (white arrows). Images provided courtesy of Dr. Barajas.
Figure 11
Figure 11
Increased pancreatic nanoparticle accumulation in patients with type 1 diabetes (T1D). Single-slice (upper row) and 3D volume sets (lower row) of a representative patient with recently diagnosed T1D (left) and a normal control subject. From Gaglia et al., 2015 used with permission of PNAS.
Figure 12
Figure 12
Benign (A and B) and malignant (C and D) nodal patterns. Axial T2* GRE pre (A) shows intranodal high signal (white arrow) compared to hypointensity on 24 hours post (B) ferumoxytol scan, indicative of normal lymph nodes. Axial T2* GRE shows normal high precontrast intranodal signal (circle, C) compared to internal intranodal speckling (circle, D) suggesting a pathologic lymph node (black arrows indicate vascular structures). Images provided courtesy of Dr. Hamilton.
Figure 13
Figure 13
Lymph nodes with an area of high signal intensity— encompassing the entire node or a large portion of it — are considered metastatic. A node with fatty hilum, complete signal void, and speckles of granularity without a definite focus of high signal intensity is considered non-metastatic. From Anzai et al., 2003 used with permission of Radiology.
Figure 14
Figure 14
Second metatarsal osteomyelitis in a 25-year-old patient with a history of a shotgun injury on the foot. T1-weighted noncontrast MR (A) shows hypointense signal involving the 2nd metatarsal (red arrow) and marked enhancement on gadolinium-enhanced T1-FS MR (B).. Noncontrast T2-weighted MR shows edema in the 2nd metatarsal (red arrow) and surrounding soft tissues (C. T2-weighted MR obtained 14 h after ferumoxytol administration (D) shows marked hypointensity compatible with ferumoxytol uptake, and consistent with the diagnosis of osteomyelitis. From A Neuwelt et al., 2016 used with permission of JMRI.
Figure 15
Figure 15
Comparison of ionizing-radiation-free WB-DW MRI scans and 18F-FDG PET/CT scans for the detection of malignant lymphoma. (A) Axial WB-DW MRI and (B) 18F-FDG PET/CT scan of a 15-year-old patient with stage IIIA Hodgkin’s lymphoma shows positive retroperitoneal lymph nodes (arrows). (C) Axial WB-DW MRI and (D) 18F-FDG PET/CT scan of a 14-year-old patient with class IIB Hodgkin’s lymphoma shows positive right inguinal lymph nodes (arrows). Integrated ferumoxytol-enhanced WB-DW MR images provided equal sensitivities and specificities for cancer staging compared to 18F-FDG-PET/ CT (28). More recent developments marry advantages of both imaging technologies towards 18F-FDG- PET/MR applications wherein ferumoxytol-enhanced anatomical T1-weighted MR images are merged with 18F-FDG-PET images (112). On 18F-FDG-PET/MR scans, ferumoxytol can help to differentiate malignant lymph nodes (18F-FDG positive, no iron uptake) from benign, inflammatory nodes (18F-FDG positive and iron uptake) as well as neoplastic bone marrow disease (18F-FDG positive, no iron uptake) from normal hypercellular hematopoietic marrow (18F-FDG positive and iron uptake) WB-DW=whole-body diffusion-weighted. 18F-FDG=18F-fluorodeoxyglucose. From Klenk et al., 2014 used with permission of The Lancet Oncology.
Figure 16
Figure 16
Kawasaki Disease. Multi-lobed Aneurysms (arrows) of the Right and Left Coronary Arteries in a 3 year-old patient. Single frame from a MUSIC acquisition (99). Systemic arteries are colored red. Images provided courtesy of Dr. Finn.
Figure 17
Figure 17
Volume rendered reconstruction of an inferior vena cava occlusion in a 58-year-old male with chronic renal failure. Steady-state, breath held, high resolution MRA with ferumoxytol at 3.0 T. Huge pelvic and abdominal wall collaterals are clearly visualized, as well as a dilated azygous vein. Blue: systemic veins; Purple: portal vessels purple; Red: systemic arteries. Images provided courtesy of Dr. Finn.

References

    1. Kanda T, Oba H, Toyoda K, Kitajima K, Furui S. Brain gadolinium deposition after administration of gadolinium-based contrast agents. Japanese journal of radiology. 2016;34(1):3–9. - PubMed
    1. Ramalho J, Semelka RC, AlObaidy M, Ramalho M, Nunes RH, Castillo M. Signal intensity change on unenhanced T1-weighted images in dentate nucleus following gadobenate dimeglumine in patients with and without previous multiple administrations of gadodiamide. European radiology. 2016 - PubMed
    1. Reeder SB, Gulani V. Gadolinium Deposition in the Brain: Do We Know Enough to Change Practice? Radiology. 2016;279(1):323–6. - PubMed
    1. Stojanov D, Aracki-Trenkic A, Benedeto-Stojanov D. Gadolinium deposition within the dentate nucleus and globus pallidus after repeated administrations of gadolinium-based contrast agents-current status. Neuroradiology. 2016;58(5):433–41. - PubMed
    1. Kowalczyk M, Banach M, Rysz J. Ferumoxytol: a new era of iron deficiency anemia treatment for patients with chronic kidney disease. Journal of nephrology. 2011;24(6):717–22. - PubMed

Publication types

MeSH terms