. 2017 May 8;31(5):635-652.e6.
doi: 10.1016/j.ccell.2017.03.011. Epub 2017 Apr 20.

Transcriptional Dependencies in Diffuse Intrinsic Pontine Glioma

Affiliations

Transcriptional Dependencies in Diffuse Intrinsic Pontine Glioma

Surya Nagaraja et al. Cancer Cell. .

Abstract

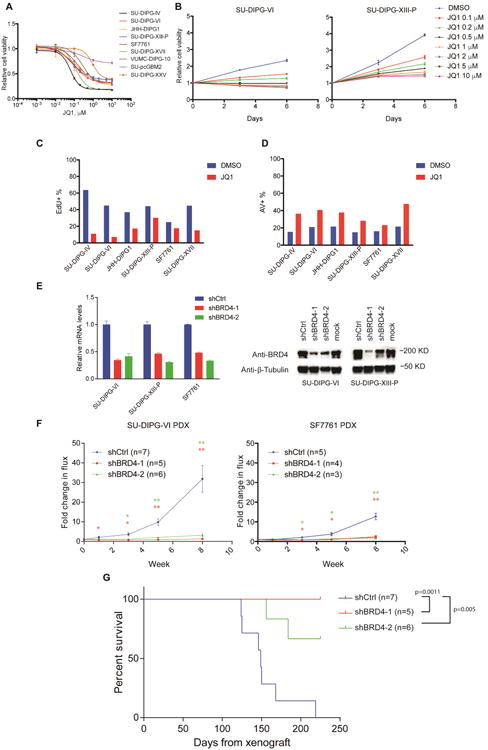
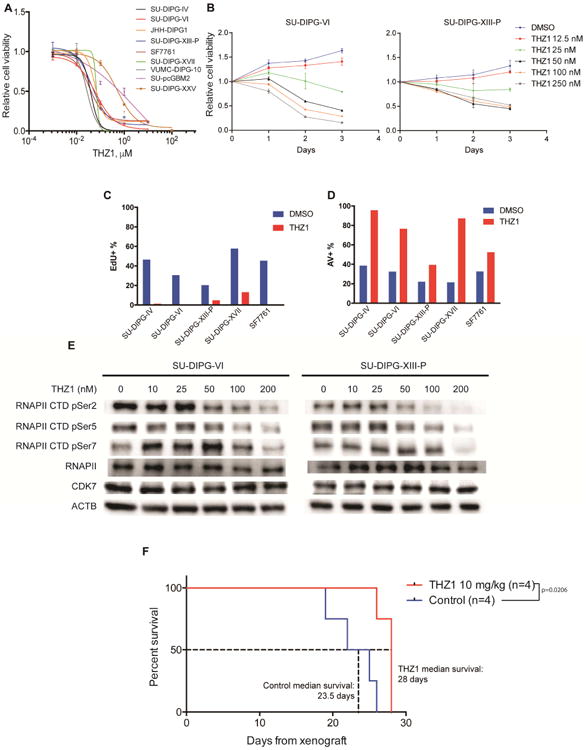
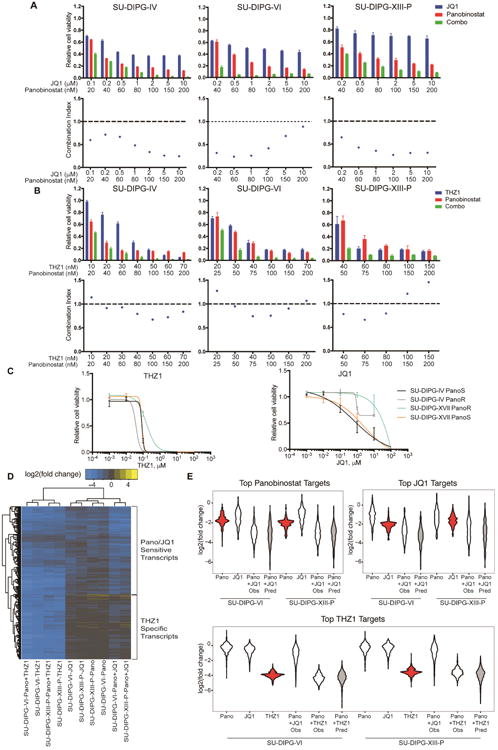
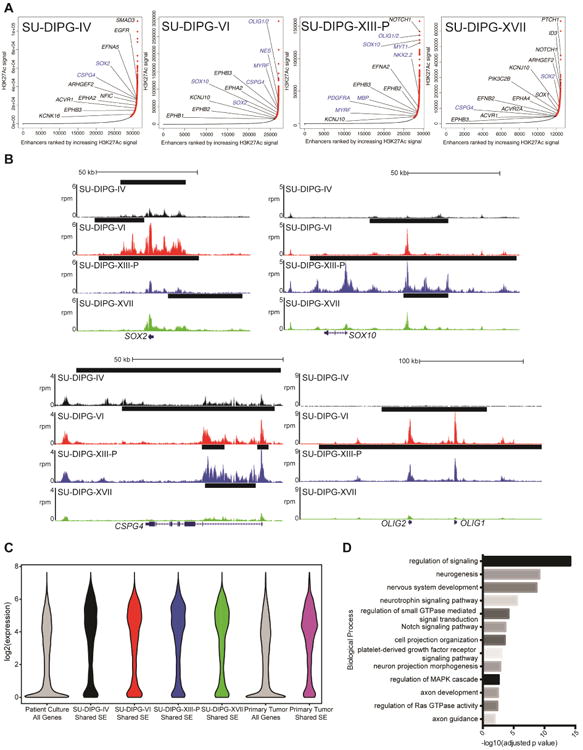
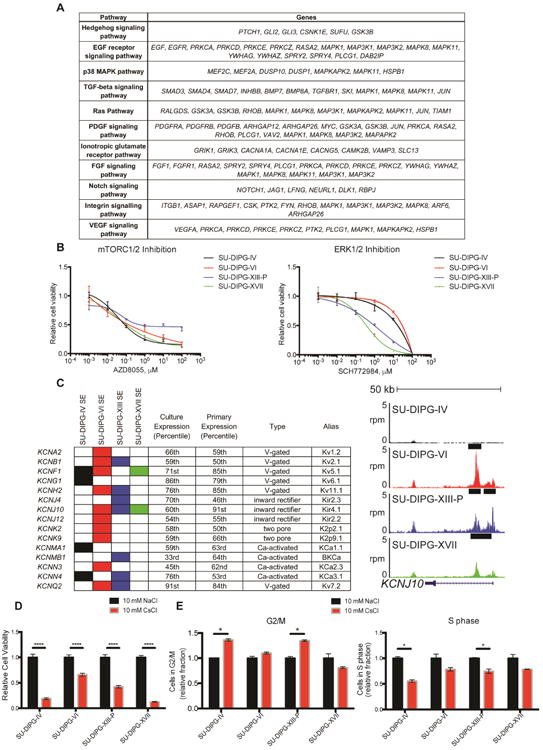
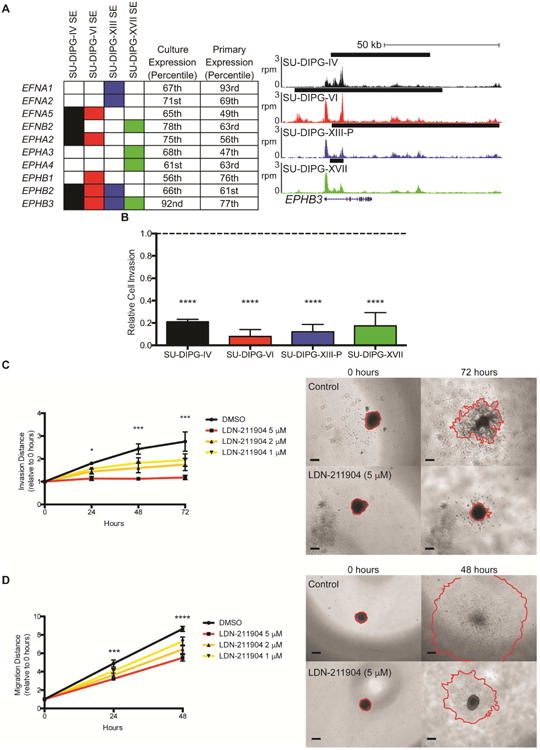
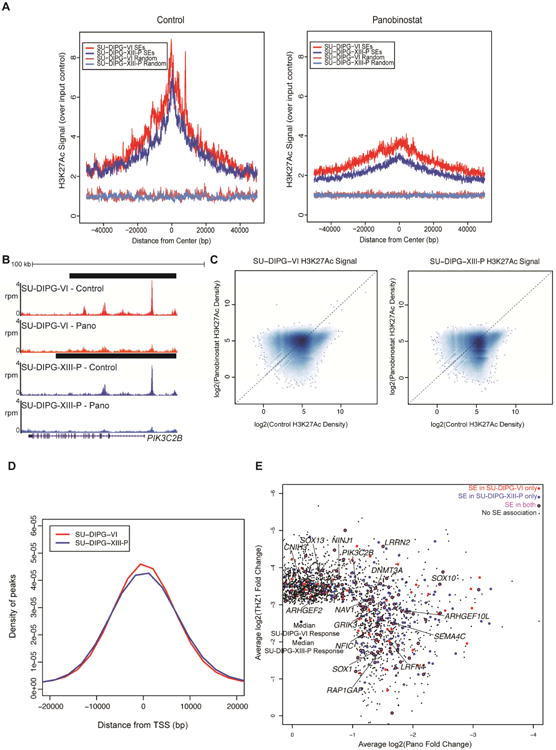
Diffuse intrinsic pontine glioma (DIPG) is a fatal pediatric cancer with limited therapeutic options. The majority of cases of DIPG exhibit a mutation in histone-3 (H3K27M) that results in oncogenic transcriptional aberrancies. We show here that DIPG is vulnerable to transcriptional disruption using bromodomain inhibition or CDK7 blockade. Targeting oncogenic transcription through either of these methods synergizes with HDAC inhibition, and DIPG cells resistant to HDAC inhibitor therapy retain sensitivity to CDK7 blockade. Identification of super-enhancers in DIPG provides insights toward the cell of origin, highlighting oligodendroglial lineage genes, and reveals unexpected mechanisms mediating tumor viability and invasion, including potassium channel function and EPH receptor signaling. The findings presented demonstrate transcriptional vulnerabilities and elucidate previously unknown mechanisms of DIPG pathobiology.

Keywords: BRD4; CDK7; DIPG; EPH; oligodendrocyte precursor cell; potassium channel; super-enhancer.


Figures

Figure 1
Figure 1. BRD4 inhibition inhibits DIPG growth in vitro and in vivo
A) Patient-derived DIPG cultures and pediatric GBM culture SU-pcGBM2 treated with JQ1 as indicated for 6 days. Cell viabilities normalized to 0.1% DMSO control values (n=3 wells per data point). B) DIPG cells treated with JQ1 at indicated concentrations or 0.1% DMSO control. Cell viabilities measured at 0, 3 and 6 days of treatment and normalized to day 0 values (n=3 wells per data point). C) EdU incorporation of DIPG cells treated with 0.1% DMSO or 1 μM JQ1 for 48 hours. D) Annexin V (AV)/DAPI staining of DIPG cells treated with 0.1% DMSO or 1 μM JQ1 for 72 hours. E) DIPG cells infected either of two clones of shBRD4 (shBD4-1 or shBRD4-2) or control construct (shCtrl) lentivirus. Knockdown efficiency by RT-qPCR (left, n=2) or Western Blot (right). F) SU-DIPG-VI cells (left) and SF7761 cells (right) infected with lentivirus expressing shBRD4-1, shBRD4-2 or shCtrl were implanted in the brainstem at P2 and allowed to engraft for 4 weeks. Tumor growth of DIPG xenografts were then monitored by IVIS imaging at week 0, 1, 3, 5 and 8. For SU-DIPG-VI: shCtrl n=7 mice, shBRD4-1 n=5 mice, shBRD4-2 n=6 mice. For SF7761: shCtrl n=5 mice, shBRD4-1 n=4 mice, shBRD4-2 n=3 mice. Data shown normalized to week 0 value for each group; error bars, s.e.m. *p < 0. 0.5; **p < 0.01 (Two-tailed Student's t-test). G) Survival curves of xenografted mice implanted with SU-DIPG-VI cells infected with lentivirus expressing shBRD4-1, shBRD4-2 or shCtrl construct. Log-rank analyses were performed to calculate the p value comparing shCtrl and shBRD4 groups (shCtrl n=7 mice. shBRD4-1 n=5 mice, shBRD4-2 n=6 mice). Data are shown as mean ± SD unless otherwise indicated. FACS analyses shown in bar plots (C, D) illustrate one representative experiment. See also Figure S1 and Tables S1-S3.
Figure 2
Figure 2. CDK7 inhibitor THZ1 disrupts DIPG growth
A) Patient-derived DIPG cultures (SU-DIPG-IV, SU-DIPG-VI, JHH-DIPG1, SU-DIPG-XIII-P, SF7761, SU-DIPG-XVII, VUMC-DIPG-10, SU-DIPG-XXV) and SU-pcGBM2 treated with THZ1 as indicated for 72 hours. Cell viabilities normalized to 0.1% DMSO control values (n=3 wells per data point). B) SU-DIPG-VI and SU-DIPG-XIII-P cells treated with THZ1 at indicated concentrations or 0.1% DMSO control. Cell viabilities measured at 0, 1, 2 and 3 days of treatment and normalized to day 0 values (n=3 wells per data point). C) EdU incorporation by DIPG cells treated with 0.1% DMSO or 0.1 μM THZ1 for 20 hours. D) Annexin V (AV)/DAPI staining of DIPG cells treated with 0.1% DMSO or 0.1 μM THZ1 for 48 hours. E) SU-DIPG-VI and SU-DIPG-XIII-P cells treated with THZ1 as indicated for 24 hours. Western blot analyses for phosphorylation levels at Ser2, Ser5 and Ser7 of RNA polymerase II C-terminal domain (RNAPII CTD). Total levels of RNAPII, CDK7 and beta-actin (ACTB) also measured as control. F) SU-DIPG-XIII-P* cells were xenografted to the pons at postnatal day 43 (P43) and allowed to engraft for 10 days prior to treatment. SU-DIPG-XIII-P* represents a particularly aggressive subclone of the SU-DIPG-XIII-P culture. Mice were treated with THZ1 at 10 mg/kg i.p. twice daily. Log-rank analyses were performed to calculate the p value, comparing vehicle treated and THZ1 treated groups (vehicle n=4 mice, THZ1 n=4 mice). Data are shown as mean ± SD unless otherwise indicated. FACS analysis shown in bar plots (C, D) for one representative experiment. See also Figure S2 and Table S3.
Figure 3
Figure 3. JQ1 and THZ1 synergize with HDACi against DIPG
A, B) Viability and synergy in combinatorial drug treatments. DIPG cultures treated with JQ1 (A) or THZ1 (B) and panobinostat individually or in combination at indicated concentrations for 72 hours. (top) Cell viabilities were measured and normalized to 0.1% DMSO control values (n=3 wells per data point). (bottom) Combination index value (CI) of each drug combination condition was calculated by using CalcuSyn software. CI less than 1 indicated synergy between two drugs. C) Panobinostat-resistant cells (PanoR) were generated by chronic treatment at IC50 concentration for 21 days. Cells were treated as indicated for 3 days and normalized to DMSO control (n=3 wells per data point). D) Log2(fold change) over DMSO control of the top 10% of panobinostat and JQ1 downregulated genes and top 5% of THZ1 downregulated genes active in both cultures. Cells were treated with panobinostat (100 nM), JQ1 (1 μM), and THZ1 (100 nM) for 24 hours. E) Violin plots showing log2(fold change) of the top 10% downregulated panobinostat and JQ1 targets and top 5% downregulated THZ1 targets. Gray plots indicate the predicted log2(fold change) assuming an additive interaction of single treatments. Red plots highlight the response of the top target genes of each category in single treatment. Data are shown as mean ± SD unless otherwise indicated. See also Figure S3.
Figure 4
Figure 4. Identification of super-enhancers in DIPG
A) Enhancers ranked by H3K27Ac signal over input. SEs are marked in red and regular enhancers are indicated in black. Genes in blue represent genes informative toward cell identity. B) ChIP-seq profiles for SE-associated genes. The x-axis represents genomic position and y-axis represents normalized reads per million (rpm). Black bars represent SE calls. C) Expression of shared SE-associated genes. Log2 transformed expression values for each cell-culture were plotted for all genes or the nearest RefSeq gene to each shared SE. Primary tumor values is analysis of previously published data (Grasso et al. 2015). D) Gene Ontology Biological Processes associated with shared SE-associated genes. Identified by GREAT analysis with binomial FDR adjusted p values reported. See also Table S4.
Figure 5
Figure 5. Super-enhancers reveal families essential to DIPG cell viability
A) Table of select pathways enriched in SE-associated genes. Enriched pathways identified by PANTHER pathway analysis of genes in the “signal transduction” term from Figure 4D. B) Cultures were treated with AZD8055 or SCH772984 as indicated for 72 hours. Cell viabilities were normalized to 1% DMSO control values. Data are shown as mean ± SD (n=3 or 4 wells per data point). C) Filled in rectangles represent association with a SE in the indicated cell culture. Expression percentiles shown for mean expression value either in four cell cultures indicated or SU-DIPG primary tumor samples published in Grasso et al. 2015. For genome tracks shown, the x-axis represents genomic position and y-axis shows normalized reads per million (rpm). Black bars represent SE calls. D) Patient-derived DIPG cultures were treated with 10 mM cesium chloride or sodium chloride for 3 days. Cell viabilities were normalized to NaCl controls, p value < 0.001 for all data shown. E) FACS cell cycle analysis of DIPG cultures treated with 10 mM NaCl or CsCl for 10 hours before addition of EdU for 1 hour. Data is shown as proportion of cells in G2/M normalized to NaCl control. Data are shown in (D, E) as mean ± s.e.m (n=3). Student's t-test was performed with Holm-Sidak correction, * indicates adjusted p value less than 0.05. See also Figure S4.
Figure 6
Figure 6. EPH signaling is important to DIPG invasion
A) EPH receptors and ephrins associated with a SE in DIPG. Filled in rectangles represent association with a SE in the indicated cell culture. Expression percentiles shown for mean expression value either in the four cell cultures indicated or SU-DIPG primary tumor samples published in Grasso et al. 2015. For genome tracks shown, the x-axis represents genomic position and y-axis shows normalized reads per million (rpm). Black bars represent SE calls. B) Transwell matrigel invasion following treatment with LDN-211904 (5 μM). Invading cell quantification was normalized to mean DMSO invasion. p value vs DMSO: SU-DIPG-IV 0.0006, SU-DIPG-VI 0.0003, SU-DIPG-XIII-P 0.0004, SU-DIPG-XVII 0.0004. C) (left) Quantification of invasion distance of SU-DIPG-XVII cells treated with LDN-211904 at the concentrations indicated or DMSO control. Invasion distance normalized to Day 0 distance for each sphere. p values of DMSO vs 5 mM LDN-211904: 24 hours = 0.0311, 48 hours = 0.0005, 72 hours = 0.0001. (right) Representative images of spheroid invasion at 0 and 72 hours, with leading edge outlined in red. Scale bars = 200 μm. D) (left) Quantification of migration distance of SU-DIPG-IV cells treated with LDN-211904 at the concentrations indicated or DMSO control. Migration distance normalized to Day 0 distance for each sphere. Student's two-tailed t-test (FDR = 0.05) between DMSO and 5 μM LDN-211904, * indicates FDR-adjusted p value < 0.05. (right) Representative images of spheroid migration at 0 and 48 hours, with leading edge outlined in red. Scale bars = 200 μm. Data shown as mean ± s.e.m. (n=3); Student's t-test with Holm-Sidak adjustment unless otherwise indicated. See also Figure S5.
Figure 7
Figure 7. Disruption of super-enhancers with panobinostat and THZ1
A) SU-DIPG-VI or SU-DIPG-XIII-P cultures treated with panobinostat for 24 hours. H3K27Ac ChIP-seq enrichment over input was plotted for all SEs or an equivalent number of randomly generated regions of median length. B) Representative example of H3K27Ac at an SE before and after panobinostat administration; x-axis represents genomic position and y-axis shows normalized reads per million (rpm). Black bars represent SE calls. C) Log2 transformed H3K27Ac signal density plotted for all peaks identified. Dashed line marks equivalent signal in both DMSO control and panobinostat treated samples. Higher density of points indicated by darker shading. D) Distance was calculated between differential H3K27Ac peaks with the strongest levels of H3K27Ac density in control treated cells and the nearest TSS. The x-axis represents distance from the closest TSS in bp and y-axis represents probability density. E) Top targets in DIPG. Scatter of active transcripts showing greater than two-fold reduction with panobinostat and greater than eight-fold reduction with THZ1 treatment in both cultures. Plotted values are the mean log2(fold change) between SU-DIPG-VI and SU-DIPG-XIII-P. Transcripts shown in magenta are associated with an SE in both cell cultures, shown in red are associated with an SE in SU-DIPG-VI only, and shown in blue are associated with an SE in SU-DIPG-XIII-P only. Black points are transcripts with no SE association. See also Figures S6 and Table S5.

Comment in

Similar articles

Cited by

References

    1. Araki T, et al. Mechanism of Homophilic Binding Mediated by Ninjurin, a Novel Widely Expressed Adhesion Molecule. Journal of Biological Chemistry. 1997;272(34):21373–21380. - PubMed
    1. Araki T, Milbrandt J. Ninjurin, a Novel Adhesion Molecule, Is Induced by Nerve Injury and Promotes Axonal Growth. Neuron. 1996;17(2):353–361. - PubMed
    1. Ashburner M, et al. Gene Ontology: tool for the unification of biology. Nature Genetics. 2000;25(1):25–29. - PMC - PubMed
    1. Bender S, et al. Reduced H3K27me3 and DNA hypomethylation are major drivers of gene expression in K27M mutant pediatric high-grade gliomas. Cancer cell. 2013;24(5):660–72. - PubMed
    1. Bhatia S, et al. Effects of altered ephrin-A5 and EphA4/EphA7 expression on tumor growth in a medulloblastoma mouse model. Journal of hematology & oncology. 2015;8:105. - PMC - PubMed

MeSH terms