. 2017 Apr:18:327-350.
doi: 10.1016/j.ebiom.2017.03.044. Epub 2017 Apr 4.

Epigenetic Pathways in Human Disease: The Impact of DNA Methylation on Stress-Related Pathogenesis and Current Challenges in Biomarker Development

Affiliations

Epigenetic Pathways in Human Disease: The Impact of DNA Methylation on Stress-Related Pathogenesis and Current Challenges in Biomarker Development

M Austin Argentieri et al. EBioMedicine. 2017 Apr.

Abstract

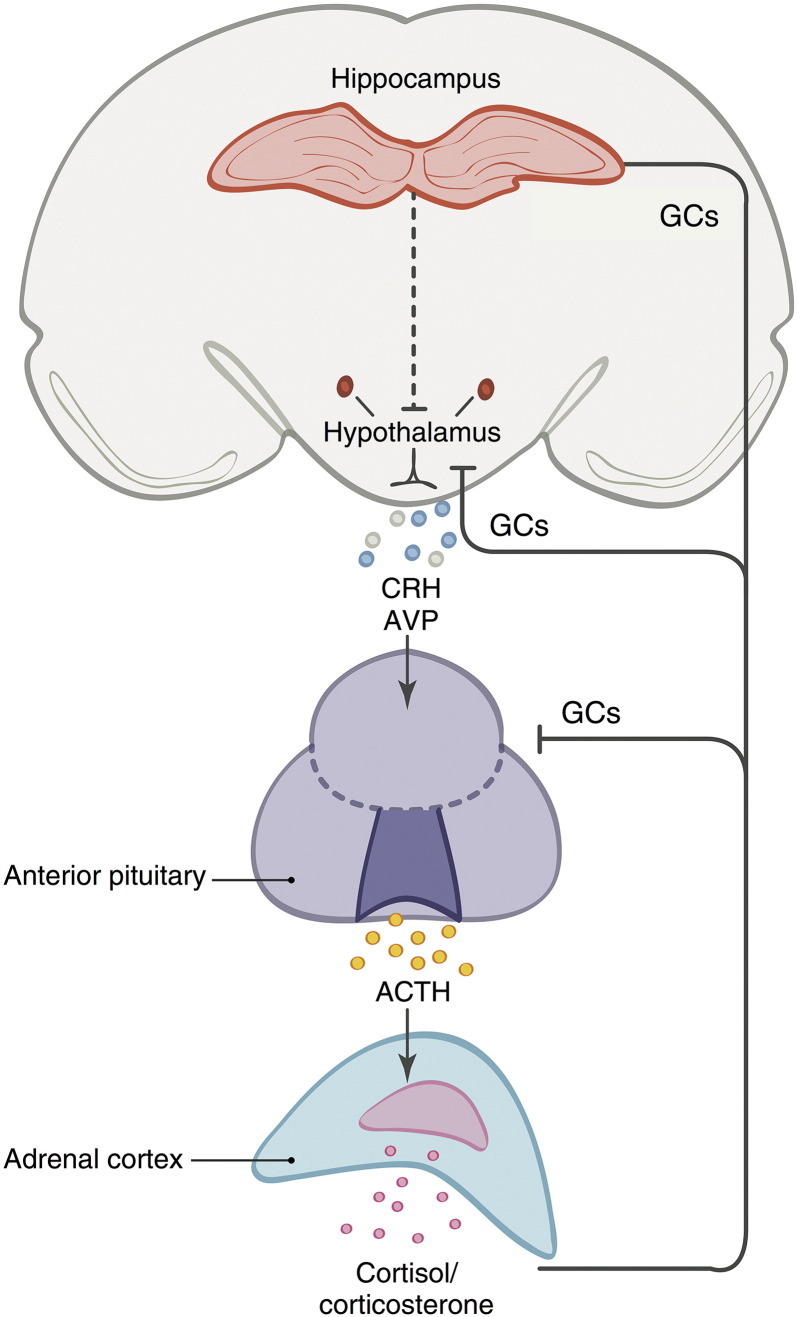
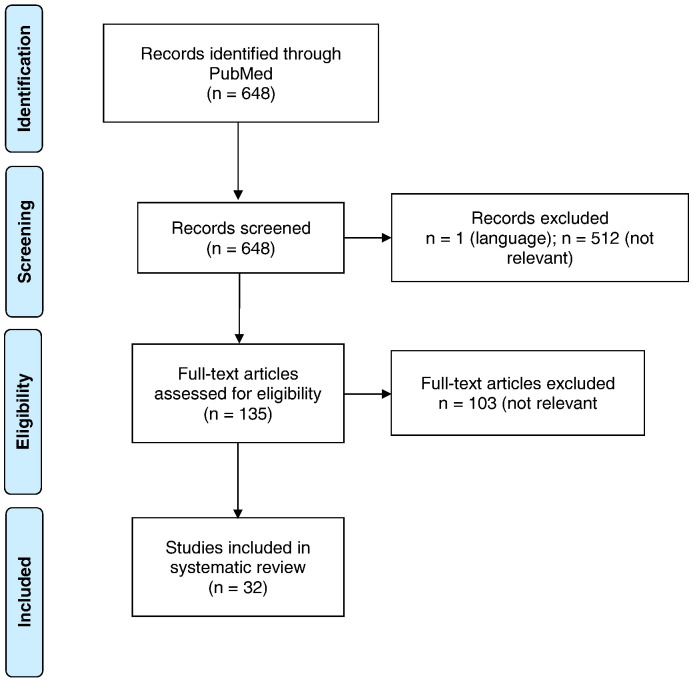
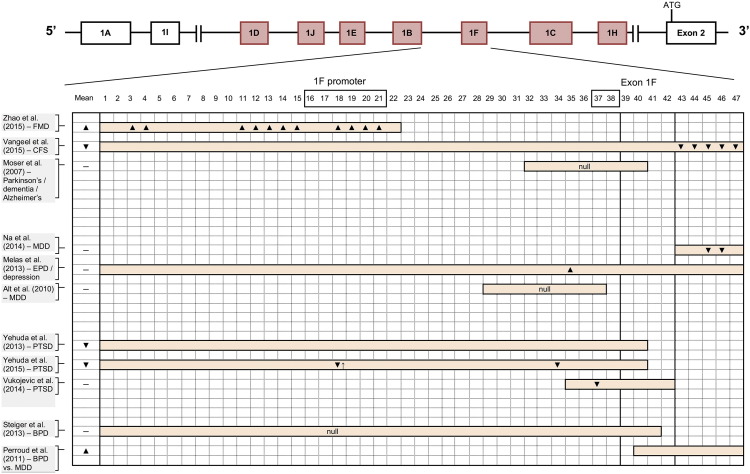
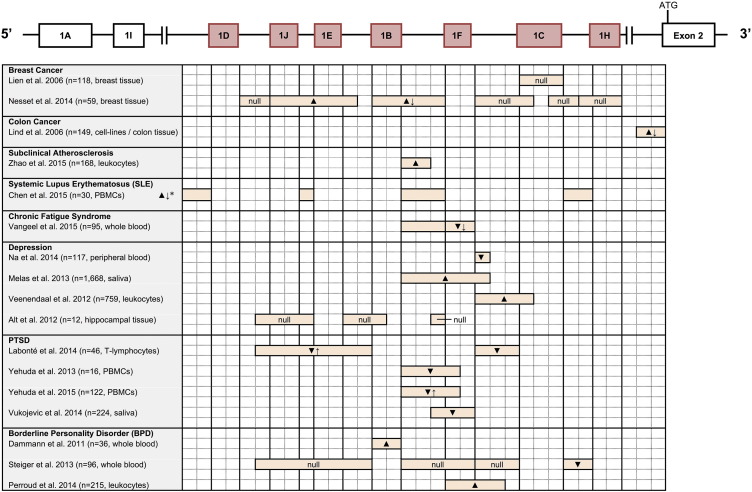
HPA axis genes implicated in glucocorticoid regulation play an important role in regulating the physiological impact of social and environmental stress, and have become a focal point for investigating the role of glucocorticoid regulation in the etiology of disease. We conducted a systematic review to critically assess the full range of clinical associations that have been reported in relation to DNA methylation of CRH, CRH-R1/2, CRH-BP, AVP, POMC, ACTH, ACTH-R, NR3C1, FKBP5, and HSD11β1/2 genes in adults. A total of 32 studies were identified. There is prospective evidence for an association between HSD11β2 methylation and hypertension, and functional evidence of an association between NR3C1 methylation and both small cell lung cancer (SCLC) and breast cancer. Strong associations have been reported between FKBP5 and NR3C1 methylation and PTSD, and biologically-plausible associations have been reported between FKBP5 methylation and Alzheimer's Disease. Mixed associations between NR3C1 methylation and mental health outcomes have been reported according to different social and environmental exposures, and according to varying gene regions investigated. We conclude by highlighting key challenges and future research directions that will need to be addressed in order to develop both clinically meaningful prognostic biomarkers and an evidence base that can inform public policy practice.

Keywords: Adverse childhood experiences (ACE); Alzheimer's; Cancer; Depression; FKBP5; Glucocorticoids; HPA axis; HSD11β2; Hypertension; Methylation; NR3C1; PTSD; Stress.


Figures

Fig. 1
Fig. 1
Overview of the hypothalamus-pituitary-adrenal (HPA) axis. Activation of the HPA axis leads to the production of corticotrophin-releasing hormone (CRH) and arginine vasopressin (AVP) in the hypothalamus. CRH is transported via the hypophyseal portal system of blood vessels to the anterior pituitary gland, which causes the pituitary gland to secrete adrenocorticotropic hormone (ACTH) into the bloodstream. ACTH then stimulates the production of glucocorticoids (e.g., cortisol) by the adrenal cortex. Glucocorticoids (GCs) produced by the adrenal cortex bind to glucocorticoid receptors in the anterior pituitary, hypothalamus, and the hippocampus to regulate production of CRH and ACTH, creating a negative feedback loop that stabilizes circulating levels of stress hormones within an appropriate physiological range.
Fig. 2
Fig. 2
Genomic actions of glucocorticoids (GCs). When bound to GCs, the glucocorticoid receptor (GR) complex translocates to the cell nucleus and modifies the synthesis of a number of immune, inflammatory, and metabolic proteins. This is done through directly binding to glucocorticoid response elements (GREs) in the DNA of genes that code for these proteins (transactivation), and through influencing the activity of transcription factors without contacting the DNA itself (transrepression). Transactivation leads to up-regulated synthesis of immune- and metabolic-related proteins, while transrepression leads to down-regulated synthesis of immunosuppressive and pro-inflammatory proteins.
Fig. 3
Fig. 3
Flow diagram of study selection.
Fig. 4
Fig. 4
Mean and CpG site-specific methylation results reported for exon 1F and its promoter in NR3C1. First exon variants in red represent the proximal promoter region. ▼ or ▲ denote hypomethylation or hypermethylation, respectively. ↓ or ↑ arrows denote a correlation between observed methylation at a specific CpG site and decreased or increased NR3C1 expression levels, respectively. “Null” denotes no methylation found, or no difference found in methylation between healthy controls and those with the disease under investigation. Boxes around CpG site numbers represent NGFI-A transcription factor binding sites according to McGowan et al. (2009). CpG numbering taken from Palma-Gudiel et al. (2015). Figure is not to scale.
Fig. 5
Fig. 5
Significant methylation results reported across the entire NR3C1 proximal promoter. Methylation results reported only for clinical outcomes that have been significantly associated with methylation status in at least one study. Diseases for which there have only been non-significant findings or for which the authors concluded that NR3C1 was not a likely biomarker are not included. First exon variants in red represent the proximal promoter region. ▼ or ▲ denote hypomethylation or hypermethylation, respectively. ↓ or ↑ arrows denote a correlation between observed methylation and decreased or increased NR3C1 expression levels, respectively. Methylation shown here represents either mean or CpG site-specific methylation, depending on the study method used, and arrows shown here are not meant to indicate methylation at specific CpG loci. Figure is not to scale. *Mean methylation levels only reported across all 4 first exon promoters, and not within each promoter.
Fig. 6
Fig. 6
Human tissue-specific gene expression of non-coding first exons within the NR3C1 proximal promoter, as reported by Turner and Muller (2005) and Presul et al. (2007). Dark blue to light blue gradients represent strong to weak expression, respectively. Note: exon 1J was discovered by Presul et al., and thus was not measured in Turner and Muller. Presul et al. did not measure exons 1E and 1H.
Fig. 7
Fig. 7
Model of (A) epigenetic and (B) subsequent systems-level PTSD pathogenesis proposed by Klengel et al. (2013). Note: Klengel et al. observed that FKBP5 methylation only leads to higher levels of FKBP5 expression in the presence of GR complex activation.

References

    1. Adalsteinsson B.T., Gudnason H., Aspelund T. Heterogeneity in white blood cells has potential to confound DNA methylation measurements. PLoS One. 2012;7(10):e46705. - PMC - PubMed
    1. Ahlquist T., Lind G.E., Costa V.L. Gene methylation profiles of normal mucosa, and benign and malignant colorectal tumors identify early onset markers. Mol. Cancer. 2008;7:94. - PMC - PubMed
    1. Alikhani-Koopaei R., Fouladkou F., Frey F.J., Frey B.M. Epigenetic regulation of 11 beta-hydroxysteroid dehydrogenase type 2 expression. J. Clin. Invest. 2004;114(8):1146–1157. - PMC - PubMed
    1. Alt S.R., Turner J.D., Klok M.D. Differential expression of glucocorticoid receptor transcripts in major depressive disorder is not epigenetically programmed. Psychoneuroendocrinology. 2010;35(4):544–556. - PubMed
    1. Baylin S.B., Esteller M., Rountree M.R., Bachman K.E., Schuebel K., Herman J.G. Aberrant patterns of DNA methylation, chromatin formation and gene expression in cancer. Hum. Mol. Genet. 2001;10(7):687–692. - PubMed

Publication types