Review
. 2018 Mar:168:222-241.
doi: 10.1016/j.neuroimage.2017.04.045. Epub 2017 Apr 21.

Magnetization Transfer Contrast and Chemical Exchange Saturation Transfer MRI. Features and analysis of the field-dependent saturation spectrum

Affiliations
Review

Magnetization Transfer Contrast and Chemical Exchange Saturation Transfer MRI. Features and analysis of the field-dependent saturation spectrum

Peter C M van Zijl et al. Neuroimage. 2018 Mar.

Abstract

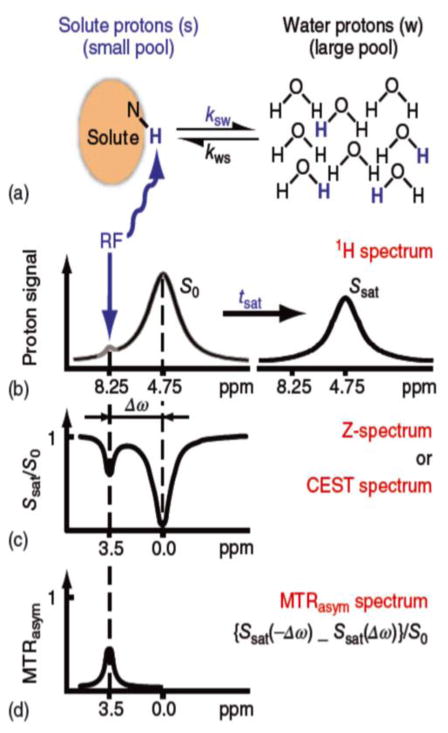
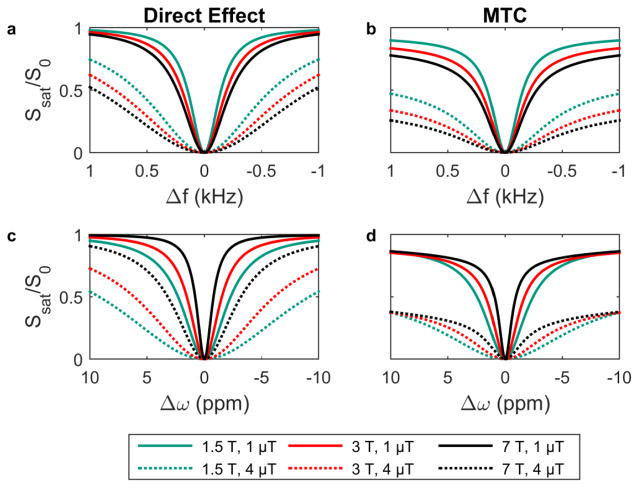
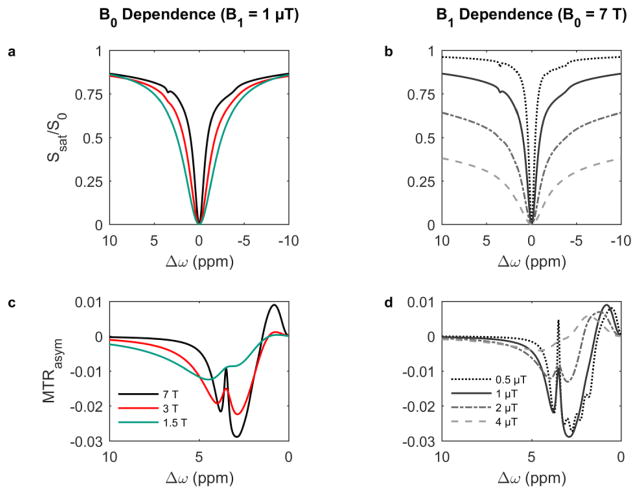
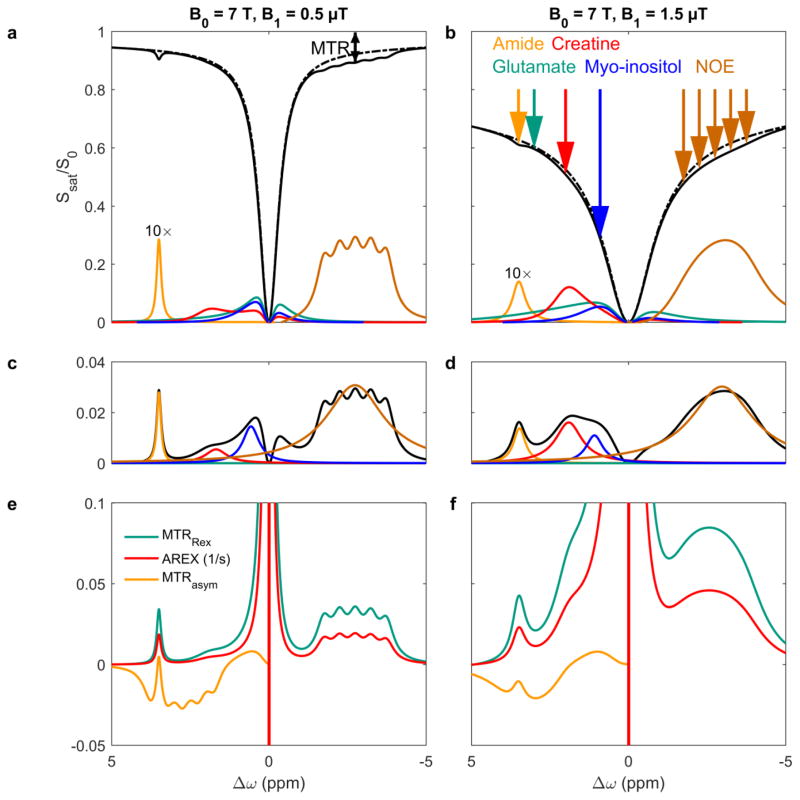
Magnetization Transfer Contrast (MTC) and Chemical Exchange Saturation Transfer (CEST) experiments measure the transfer of magnetization from molecular protons to the solvent water protons, an effect that becomes apparent as an MRI signal loss ("saturation"). This allows molecular information to be accessed with the enhanced sensitivity of MRI. In analogy to Magnetic Resonance Spectroscopy (MRS), these saturation data are presented as a function of the chemical shift of participating proton groups, e.g. OH, NH, NH2, which is called a Z-spectrum. In tissue, these Z-spectra contain the convolution of multiple saturation transfer effects, including nuclear Overhauser enhancements (NOEs) and chemical exchange contributions from protons in semi-solid and mobile macromolecules or tissue metabolites. As a consequence, their appearance depends on the magnetic field strength (B0) and pulse sequence parameters such as B1 strength, pulse shape and length, and interpulse delay, which presents a major problem for quantification and reproducibility of MTC and CEST effects. The use of higher B0 can bring several advantages. In addition to higher detection sensitivity (signal-to-noise ratio, SNR), both MTC and CEST studies benefit from longer water T1 allowing the saturation transferred to water to be retained longer. While MTC studies are non-specific at any field strength, CEST specificity is expected to increase at higher field because of a larger chemical shift dispersion of the resonances of interest (similar to MRS). In addition, shifting to a slower exchange regime at higher B0 facilitates improved detection of the guanidinium protons of creatine and the inherently broad resonances of the amine protons in glutamate and the hydroxyl protons in myoinositol, glycogen, and glucosaminoglycans. Finally, due to the higher mobility of the contributing protons in CEST versus MTC, many new pulse sequences can be designed to more specifically edit for CEST signals and to remove MTC contributions.

Keywords: CEST; MTC; Magnetization transfer; NOE; Nuclear Overhauser enhancement.


Figures

Figure 1
Figure 1. Schematic overview of the effect of (a) excitation, (b) saturation and (c) cross-relaxation (NOE) on the proton spin pool populating the proton energy levels
The difference in spin population (P) between energy levels is ~ 1–10 per million, leading to a resultant polarization (a) that can be detected (signal S) after excitation. Saturation minimizes the resultant polarization (b). When two protons (A and B) are coupled, their populations can cross-relax and saturation of one spin can the transferred to the other (c). The effect shown here is for slow-moving molecules, leading to reduction in polarization in the neighboring spin or a negative NOE.
Figure 2
Figure 2. Nomenclature and terminology for polarization (magnetization) transfer
The blue star indicates where the protons are labeled using either excitation or saturation; the red star indicates after dipolar transfer; the green star after chemical exchange. a) Dipolar transfer between protons that have dipole-dipole coupling D~HAHB/rAB3 and can undergo cross-relaxation (orange arrow), which is proportional to D2 and the motional correlation time, causing NOE in a neighboring proton. b) Chemical exchange with rate equilibrium dependent on pool sizes: MAkAB = MBkBA; c) relayed dipolar transfer (relayed NOE or spin diffusion); d) exchange-relayed NOE; e) NOE-relayed (rNOE) exchange, such as occurs in the upfield (lower frequency region of CEST spectra); f) intramolecular NOE-relayed transfer followed by intermolecular NOE to bound water, followed by either molecular (water) exchange or proton exchange to free water.
Figure 3
Figure 3. Chemical Exchange Saturation Transfer (CEST)
(a,b) Solute protons (blue) are saturated at their specific resonance frequency in the proton spectrum (here 8.25 ppm for amide protons). This saturation is transferred to water (4.75 ppm) with exchange rate ksw and non-saturated protons (black) return. After a saturation period (tsat), this effect becomes visible on the water signal (b, right). (c) The Z-spectrum, showing normalized water saturation (Ssat/S0) as a function of irradiation frequency. When irradiating the water protons at 4.75 ppm, the signal disappears due to direct (water) saturation. This frequency is assigned to 0 ppm in Z-spectra. At short saturation times, only this direct saturation is apparent. At longer tsat the CEST effect becomes visible at the frequency of the low-concentration exchangeable solute protons, now visible at 8.25 – 4.75 = 3.5 ppm in the Z-spectrum. (d) Result of Magnetization Transfer Ratio asymmetry (MTRasym) analysis of the Z-spectrum with respect to the water frequency to remove the effect of DS. Reproduced, with permission from van Zijl & Yadav, Magn. Reson. Med. 65, 927 (2011).
Figure 4
Figure 4. Simulated direct effect (a,c) and symmetric MTC (b,d) using frequency scale (kHz) convention (a,b) from MTC and the NMR (CEST) convention in ppm (c,d)
These spectra assume a hypothetical case of gray matter at different field strengths B0 and for different saturation pulse amplitudes B1. Note that, due to the use of symmetric MTC, the different spectral appearances as a function of B0 in a and c are due mainly to T1w and T2w. The same is true for c and d, but due to the increase with field in frequency/ppm is larger than the increase in the square root of T1w/T2w, the saturation lines narrow with field. Parameters used: T1w = 0.8, 1.2, 1.6 s, T2w = 72, 69, 62 ms (at 1.5, 3, 7 T, respectively); MTC: fraction 5%, rate 40 Hz, T1 = 1 s, T2 = 9 μs, steady state continuous saturation.
Figure 5
Figure 5. Simulated Z-spectra of gray matter including CEST contributions as a function of B0 (a,c ) and B1 (b,d)
The B0 fields for (a,c) are indicated in (c) and the B1 fields for (b,d) in (d). These spectra include the direct effect and symmetric MTC contributions described in Figure 4. As per NMR (and MRS, CEST) convention the frequency offsets are in ppm. CEST components: amide (3.5 ppm, 72 mM, ksw = 30 Hz, T2 = 100 ms), glutamate (3 ppm, 20 mM protons, ksw = 5500 Hz, T2 = 200 ms), creatine (2 ppm, 20 mM protons, ksw = 1100 Hz, T2 = 170 ms), myo-inositol (0.9 ppm, 45 mM protons, ksw = 2000 Hz, T2 = 55 ms), and five NOE components −1.75, −2.25, −2.75, −3.25, and −3.75 ppm; each 100 mM protons, ksw = 16 Hz, T2 = 5 ms).
Figure 6
Figure 6. Z-spectra and MTRasym data for normocapnic (green), postmortem (cardiac arrest, red) and hypercapnic (blue) rat brain at 4.7T
Five regions of interest covering the whole brain (fronto-parietal cortex, inferior colliculus, cerebellum) were chosen and averaged. In Z-spectra (a,b,g), signal attenuation is due mainly to the DE close to the water frequency and the MTC effect over the whole spectral range. MTRasym data for brain (c,d) show a clear asymmetry in the proton spectral range (c) with the magnitude of the effects differing between postmortem and in vivo, explained in terms of a reduced pH postmortem reducing the CEST effects. The Z-spectrum asymmetry clearly extends well beyond the proton spectral range (d), indicating that it has to be due to asymmetry in the MTC. When choosing small areas with predominantly CSF (g,h) this asymmetry disappears due to the presence of just the DE. (e,f) When subtracting the MTRasym spectra of normocapnia from those of postmortem and hypercapnia to get the difference in proton transfer ratio (PTR), the asymmetry at higher frequencies disappears and no effect remains for hypercapnia while the pH effect from cardiac arrest is visible only in the proton spectral range, with a maximum at 3.5 ppm. Saturation parameters: 400 Gaussian pulses (6.6 ms, delay 3.4 ms; total 4 s, average power 1.2 μT). Reproduced, with permission from Zhou et al. Nature Med. 9(8), 1085–1090 (2003).
Figure 7
Figure 7. Experimental (a) Z-spectra and (b) MTRasym spectra for gray matter for mouse hippocampus at 7T, using different B1 values
Average of brain data for 10 mice. Unpublished results.
Figure 8
Figure 8. Different types of spectral display at two saturation RF amplitudes B1 based on simulations of gray matter for B0 = 7 T in Fig. 5
(a,b) Dashed black lines include DE and MTC. Solid black lines include DE, MTC, and CEST. Solid colored lines are spectra from DE, MTC, and single CEST pools subtracted from a spectrum with only DE and MTC in order to show contributions from individual pools. Note that the glutamate and myo-inositol proton contributions have their peak maxima shifted to 0 ppm because their high exchange rate merges their apparent peak positions and heights with those of water in a population-based averaging. The original offsets of the CEST components are indicated by arrows in (b). The double-sided arrow in (a) shows the magnetization transfer ratio (MTR) measure. (c,d) Lorentzian fits to the difference between the dashed and solid lines in a and b (black lines in c and d), respectively (colors as in b). (e,f) CEST metrics MTRRex, AREX, and MTRasym.
Figure 9
Figure 9. Experimental human data at 7 Tesla
(a) Axial unsaturated image and white matter ROI, (b) Z-spectrum and Lorentzian fit (green line) of the direct water saturation contribution based on fitting the frequency offsets shown as red stars for the ROI. (c) Lorentzian difference (LD) spectrum (40 to −40 ppm) for the ROI, defined as the difference between the Lorentzian fit and the acquired Z-spectrum. (d) LD spectrum zoomed in to 10 to −10 ppm. Data acquired using pulsed steady state acquisition (25 ms Sinc-Gauss pulse, B1 = 1 μT, gradient echo detection TE/flip angle = 1.72 ms/12°; whole brain acquisition 10.9 s per frequency). Notice the substantial MTC contribution and its asymmetry at 10 ppm as well as the fine structure due to multiple rNOE components for mobile macromolecules. Reproduced with permission from Jones et al. NeuroImage. 77:114–24 (2013).
Figure 10
Figure 10. Variable delay multi pulse (VDMP) CEST editing and relaxation compensated CEST imaging in human brain at 7T
(a) Multi-echo MRI pulse sequence with VDMP saturation preparation train of Gaussian 180 pulses (width tp, inter pulse delay tmix, crushers to suppress residual transverse magnetization). Every set of 4 pulses is cycled using the “CYCLically Ordered Phase Sequence” (CYCLOPS) approach, i.e. 90 steps (x, y, -x, -y) to complete a cycle. (b) Simulation of saturation buildup as a function of tmix for four typical spin pool transfer rates: rNOE (16 Hz), APT (29 Hz), MTC (60 Hz), and fast exchange (1000 Hz). All intensities normalized to the first data point (tmix = 0 ms) to make curves independent of the concentration of exchanging protons. (c) In vivo Z-spectra of human brain at tmix = 0 ms and at tmix = 100 ms (optimized for compensating for MTC). (d–f) VDMP difference maps for MTC at 8ppm (d), APT (e) and rNOE (f). (g–h) MTRRex images in another volunteer acquired at the APT and rNOE frequencies. Reproduced, with permission from: (a) Xu J. et al. MRM 71:1798–1812 (2014); (b–f) Xu J. et al. 75:88–96 (2016) MRM; (g,h) Windschuh et al. NMR Biomed. 2015; 28: 529–537.
Figure 11
Figure 11. Simulations of the B0 dependence of Z-spectra of gray matter using continuous saturation at different B1 levels
Parameters used are listed in Table 1 and Figures 4 and 5. Notice the coalescence of the fast exchanging glutamate amine and myo-inositol hydroxyl resonances with the water resonance and the improving appearance of the creatine guanidinium protons at higher field due to moving towards the slow exchange regime.

Similar articles

Cited by

References

    1. Aime S, Castelli DD, Crich SG, Gianolio E, Terreno E. Pushing the sensitivity envelope of lanthanide-based magnetic resonance imaging (MRI) contrast agents for molecular imaging applications. Acc Chem Res. 2009;42:822–831. - PubMed
    1. Bagga P, Crescenzi R, Krishnamoorthy G, Verma G, Nanga RP, Reddy D, Greenberg J, Detre JA, Hariharan H, Reddy R. Mapping the alterations in glutamate with GluCEST MRI in a mouse model of dopamine deficiency. J Neurochem. 2016;139:432–439. - PMC - PubMed
    1. Balaban RS, Ceckler TL. Magnetization transfer contrast in magnetic resonance imaging. Magn Reson Q. 1992;8:116–137. - PubMed
    1. Behar KL, Rothman DL, Spencer DD, Petroff OA. Analysis of macromolecule resonances in 1H NMR spectra of human brain. Magn Reson Med. 1994;32:294–302. - PubMed
    1. Bottomley PA. MRS Studies of Creatine Kinase Metabolism in Human Heart. eMagRes. 2016;5:1183–1202. doi:1110.1002/9780470034590.emrstm9780470031488.

Publication types