

Daphnia magna and Xenopus laevis as in vivo models to probe toxicity and uptake of quantum dots functionalized with gH625
- PMID: 28435254
- PMCID: PMC5388222
- DOI: 10.2147/IJN.S127226
Daphnia magna and Xenopus laevis as in vivo models to probe toxicity and uptake of quantum dots functionalized with gH625
Abstract
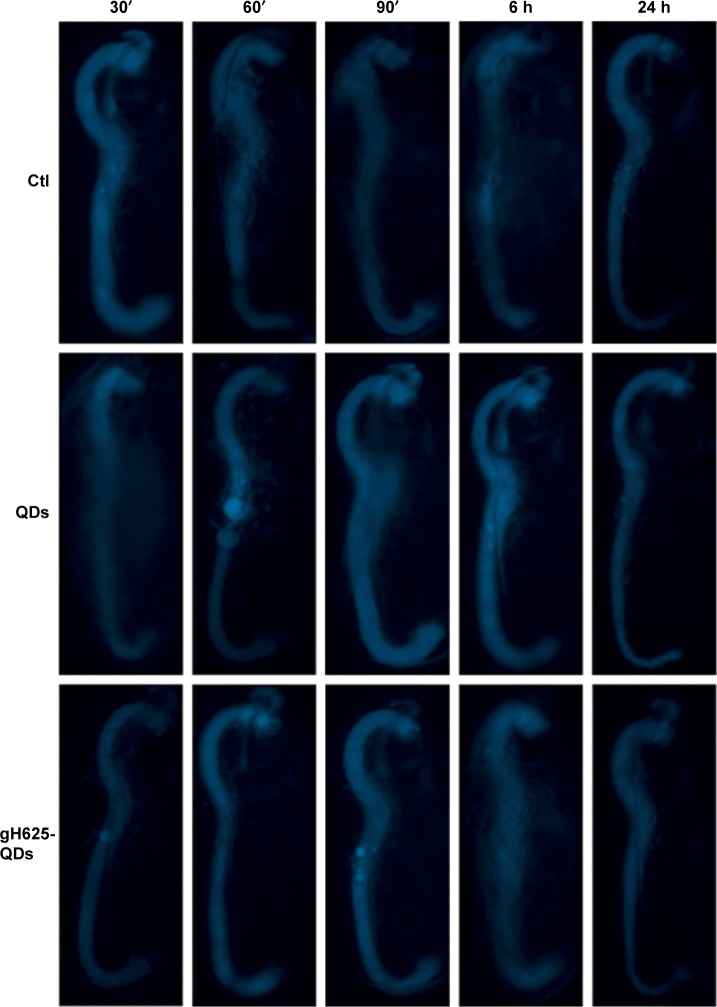
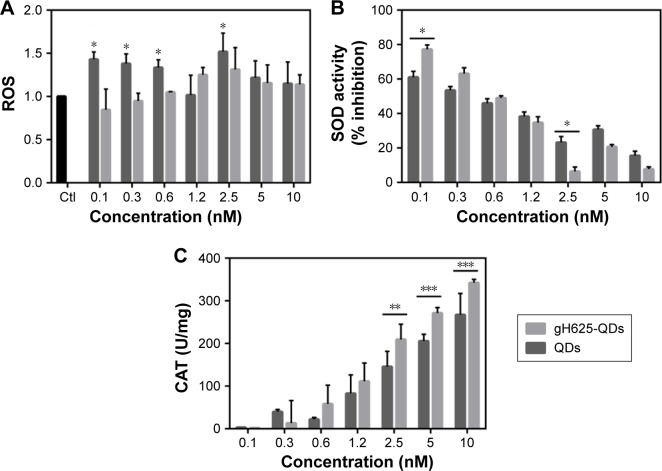
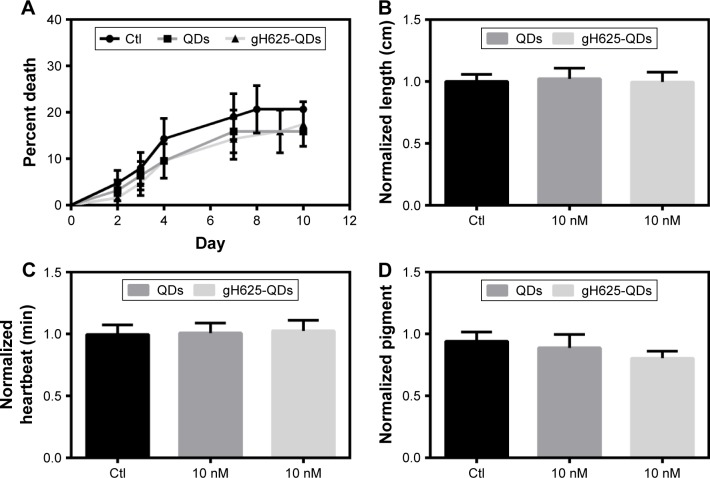
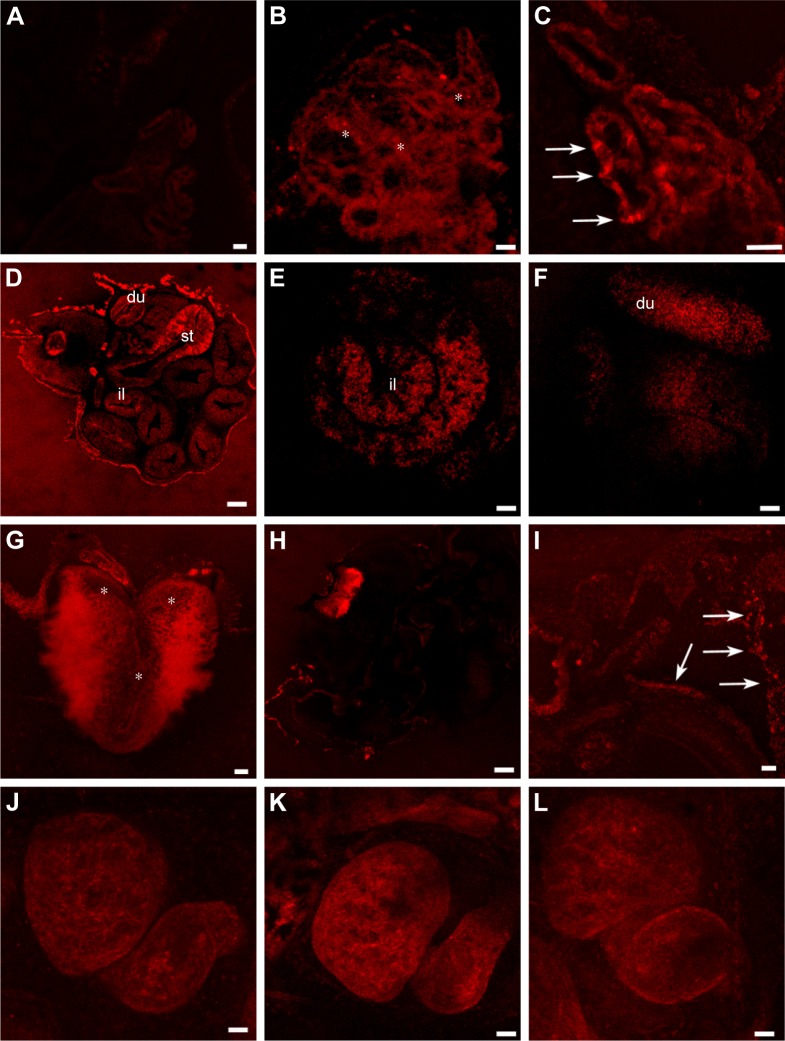
The use of quantum dots (QDs) for nanomedicine is hampered by their potential toxicologic effects and difficulties with delivery into the cell interior. We accomplished an in vivo study exploiting Daphnia magna and Xenopus laevis to evaluate both toxicity and uptake of QDs coated with the membranotropic peptide gH625 derived from the glycoprotein H of herpes simplex virus and widely used for drug delivery studies. We evaluated and compared the effects of QDs and gH625-QDs on the survival, uptake, induction of several responsive pathways and genotoxicity in D. magna, and we found that QDs coating plays a key role. Moreover, studies on X. laevis embryos allowed to better understand their cell/tissue localization and delivery efficacy. X. laevis embryos raised in Frog Embryo Teratogenesis Assay-Xenopus containing QDs or gH625-QDs showed that both nanoparticles localized in the gills, lung and intestine, but they showed different distributions, indicating that the uptake of gH625-QDs was enhanced; the functionalized QDs had a significantly lower toxic effect on embryos' survival and phenotypes. We observed that D. magna and X. laevis are useful in vivo models for toxicity and drug delivery studies.
Keywords: blood–brain barrier; delivery; genotoxicity; membranotropic peptide; nanoparticles.
Conflict of interest statement
Disclosure The authors report no conflicts of interest in this work.
Figures
Similar articles
-
Toxicity Effects of Functionalized Quantum Dots, Gold and Polystyrene Nanoparticles on Target Aquatic Biological Models: A Review.Molecules. 2017 Aug 31;22(9):1439. doi: 10.3390/molecules22091439. Molecules. 2017. PMID: 28858240 Free PMC article. Review.
-
Quantum dots functionalized with gH625 attenuate QDs oxidative stress and lethality in Caenorhabditis elegans: a model system.Ecotoxicology. 2020 Mar;29(2):156-162. doi: 10.1007/s10646-019-02158-3. Epub 2020 Jan 11. Ecotoxicology. 2020. PMID: 31927676
-
Surface decoration with gH625-membranotropic peptides as a method to escape the endo-lysosomal compartment and reduce nanoparticle toxicity.Nanotechnology. 2015 Oct 16;26(41):415101. doi: 10.1088/0957-4484/26/41/415101. Epub 2015 Sep 25. Nanotechnology. 2015. PMID: 26403519
-
Bioaccumulation and in-vivo dissolution of CdSe/ZnS with three different surface coatings by Daphnia magna.Chemosphere. 2016 Jan;143:115-22. doi: 10.1016/j.chemosphere.2015.06.049. Epub 2015 Jul 7. Chemosphere. 2016. PMID: 26163157
-
Cadmium-containing Quantum Dots: Current Perspectives on Their Application as Nanomedicine and Toxicity Concerns.Mini Rev Med Chem. 2016;16(11):905-16. doi: 10.2174/1389557516666160211121247. Mini Rev Med Chem. 2016. PMID: 26864550 Review.
Cited by
-
A Review of in vivo Toxicity of Quantum Dots in Animal Models.Int J Nanomedicine. 2023 Dec 29;18:8143-8168. doi: 10.2147/IJN.S434842. eCollection 2023. Int J Nanomedicine. 2023. PMID: 38170122 Free PMC article. Review.
-
Understanding fungal potential in the mitigation of contaminated areas in the Czech Republic: tolerance, biotransformation of hexachlorocyclohexane (HCH) and oxidative stress analysis.Environ Sci Pollut Res Int. 2019 Aug;26(24):24445-24461. doi: 10.1007/s11356-019-05679-w. Epub 2019 Jun 22. Environ Sci Pollut Res Int. 2019. PMID: 31228071
-
Efficiency of gold nanoparticles coated with the antimicrobial peptide indolicidin against biofilm formation and development of Candida spp. clinical isolates.Infect Drug Resist. 2018 Jul 3;11:915-925. doi: 10.2147/IDR.S164262. eCollection 2018. Infect Drug Resist. 2018. PMID: 30013374 Free PMC article.
-
Effects of Two Antiretroviral Drugs on the Crustacean Daphnia magna in River Water.Toxics. 2022 Jul 28;10(8):423. doi: 10.3390/toxics10080423. Toxics. 2022. PMID: 36006102 Free PMC article.
-
Toxicity Effects of Functionalized Quantum Dots, Gold and Polystyrene Nanoparticles on Target Aquatic Biological Models: A Review.Molecules. 2017 Aug 31;22(9):1439. doi: 10.3390/molecules22091439. Molecules. 2017. PMID: 28858240 Free PMC article. Review.
References
-
- Grever MR. Accelerating safe drug development: an ideal approach to approval. Hematology Am Soc Hematol Educ Program. 2013;2013:24–29. - PubMed
-
- Pietro PD, Strano G, Zuccarello L, Satriano C. Gold and silver nanoparticles for applications in theranostics. Curr Top Med Chem. 2016;16(27):3069–3102. - PubMed
-
- Biffi S, Andolfi L, Caltagirone C, et al. Cubosomes for in vivo fluorescence lifetime imaging. Nanotechnology. 2017;28(5):055102. - PubMed
MeSH terms
Substances
LinkOut - more resources
Full Text Sources
Other Literature Sources
