. 2017 Mar 6;7(5):1225-1244.
doi: 10.7150/thno.18181. eCollection 2017.

Recipient Glycemic Micro-environments Govern Therapeutic Effects of Mesenchymal Stem Cell Infusion on Osteopenia

Affiliations

Recipient Glycemic Micro-environments Govern Therapeutic Effects of Mesenchymal Stem Cell Infusion on Osteopenia

Bing-Dong Sui et al. Theranostics. .

Abstract

Therapeutic effects of mesenchymal stem cell (MSC) infusion have been revealed in various human disorders, but impacts of diseased micro-environments are only beginning to be noticed. Donor diabetic hyperglycemia is reported to impair therapeutic efficacy of stem cells. However, whether recipient diabetic condition also affects MSC-mediated therapy is unknown. We and others have previously shown that MSC infusion could cure osteopenia, particularly in ovariectomized (OVX) mice. Here, we discovered impaired MSC therapeutic effects on osteopenia in recipient type 1 diabetes (T1D). Through intensive glycemic control by daily insulin treatments, therapeutic effects of MSCs on osteopenia were maintained. Interestingly, by only transiently restoration of recipient euglycemia using single insulin injection, MSC infusion could also rescue T1D-induced osteopenia. Conversely, under recipient hyperglycemia induced by glucose injection in OVX mice, MSC-mediated therapeutic effects on osteopenia were diminished. Mechanistically, recipient hyperglycemic micro-environments reduce anti-inflammatory capacity of MSCs in osteoporotic therapy through suppressing MSC interaction with T cells via the Adenosine monophosphate-activated protein kinase (AMPK) pathway. We further revealed in diabetic micro-environments, double infusion of MSCs ameliorated osteopenia by anti-inflammation, attributed to the first transplanted MSCs which normalized the recipient glucose homeostasis. Collectively, our findings uncover a previously unrecognized role of recipient glycemic conditions controlling MSC-mediated therapy, and unravel that fulfillment of potent therapeutic effects of MSCs requires tight control of recipient micro-environments.

Keywords: Mesenchymal stem cells; anti-inflammation.; cell therapy; glycemic micro-environment; osteopenia; recipient.


Conflict of interest statement

Competing Interests: The authors have declared that no competing interest exists.

Figures

Figure 1
Figure 1
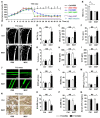
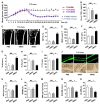
Recipient diabetes mellitus impairs therapeutic effects of MSC infusion on osteopenia. (A-G) Representative micro-CT images (A) and quantitative analysis of trabecular (B-F) and cortical (G) bone microarchitecture in the distal metaphyses of femora, from OVX and T1D mice accepting PBS or MSC infusion. Bars: 500 μm. (H-K) Representative images of calcein double labeling (H) with quantification (I-K) of bone formation rates in distal femora. Bars: 50 μm. (L-N) Representative images of TRAP staining (red) (L) with parameters (M, N) of bone resorption rates in distal femora. Bars: 25 μm. (O) ELISA analysis of bone resorption marker in serum. n = 6 per group. Data represents mean ± SD. *P < 0.05; NS, not significant (P > 0.05). Data were analyzed using ANOVA followed by Newman-Keuls post-hoc tests.
Figure 2
Figure 2
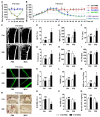
Glycemic control in recipient diabetes maintains therapeutic effects of MSC transplantation on osteopenia. (A) Non-fasting blood glucose levels of T1D mice with buffer (Ctrl) or INST treatments and PBS or MSC infusion. INS was applied daily at 20 U/kg from D25 to D54. MSCs were infused at D25. Grey dashed line indicates diabetic criterion of 250 mg/dL. (B) ELISA analysis of HbA1c percentages after sacrifice at D54. (C-I) Representative micro-CT images (C) and quantification of trabecular (D-H) and cortical (I) bone mass in distal femora, from T1D mice accepting PBS or MSC infusion in Ctrl and during INST. Bars: 500 μm. (J-M) Representative images of calcein double labeling (J) with quantification (K-M) of bone formation rates in distal femora. Bars: 50 μm. (N-P) Representative images of TRAP staining (red) (N) with parameters (O, P) of bone resorption rates in distal femora. Bars: 25 μm. (Q) ELISA analysis of bone resorption marker CTX-1 in serum. n = 6 per group. Data represents mean ± SD. *P < 0.05; NS, not significant (P > 0.05) (ANOVA followed by Newman-Keuls post-hoc tests).
Figure 3
Figure 3
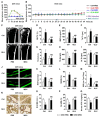
Infusion of MSCs under recipient transient euglycemia rescues diabetes-induced bone loss. (A, B) Non-fasting blood glucose levels of T1D mice which accepted single buffer (Ctrl) or INS injection at 0.2 U/kg at D25 followed by PBS or MSC infusion. MSCs were infused under euglycemia at 30 min after INS injection at D25. Grey line indicates diabetic criterion of 250 mg/dL. (C-I) Representative micro-CT images (C) and quantification of trabecular (D-H) and cortical (I) bone mass in distal femora, from T1D mice accepting PBS or MSC infusion in Ctrl and after INS injection. Bars: 500 μm. (J-M) Representative images of calcein double labeling (J) with quantification (K-M) of bone formation rates in distal femora. Bars: 50 μm. (N-P) Representative images of TRAP staining (red) (N) with parameters (O, P) of bone resorption rates in distal femora. Bars: 25 μm. (Q) ELISA analysis of bone resorption marker CTX-1 in serum. n = 6 per group. Data represents mean ± SD. *P < 0.05; NS, not significant (P > 0.05) (ANOVA followed by Newman-Keuls post-hoc tests).
Figure 4
Figure 4
Recipient hyperglycemia diminishes therapeutic effects of MSC infusion on osteopenia. (A, B) Non-fasting blood glucose levels of OVX mice which accepted single distilled water (Ctrl) or 2.0-g/kg GLU injection at D25 followed by PBS or MSC infusion. MSCs were infused under hyperglycemia at 15 min after GLU injection at D25. Grey line indicates diabetic criterion of 250 mg/dL. (C-I) Representative micro-CT images (C) and quantification of trabecular (D-H) and cortical (I) bone mass in distal femora, from OVX mice accepting PBS or MSC infusion in Ctrl and after GLU injection. Bars: 500 μm. (J-M) Representative images of calcein double labeling (J) with quantification (K-M) of bone formation rates in distal femora. Bars: 50 μm. (N-P) Representative images of TRAP staining (red) (N) with parameters (O, P) of bone resorption rates in distal femora. Bars: 25 μm. (Q) ELISA analysis of bone resorption marker CTX-1 in serum. n = 6 per group. Data represents mean ± SD. *P < 0.05; NS, not significant (P > 0.05) (ANOVA followed by Newman-Keuls post-hoc tests).
Figure 5
Figure 5
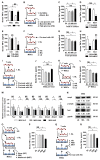
HG micro-environments reduce anti-inflammatory capacity of MSCs via the AMPK pathway. (A, D, E, H) ELISA analysis of inflammatory cytokine TNF-α in serum, respectively from mice analyzed in Figures 1-4. n = 6 per group. (B, F, I, K) Experimental designs to mimick in vivo phenomena in vitro and to clarify HG effects on anti-inflammatory capacity of MSCs or response of T cells. MA was used as the osmotic control. For LG treatment, 5-mM GLU was added. For HG treatment, 25-mM GLU was added. For MA treatment, 20-mM MA was added together with 5-mM GLU. (C, G, J, L) ELISA analysis of TNF-α in media from the respective experiments of B, F, I, K. n = 4 per group. (M) qRT-PCR analysis of mRNA expression profiles of immunomodulatory factors of MSCs after treatments by LG, MA and HG. n = 3 per group. (N) Western blot detection of protein expression levels in MSCs after treatments by LG, MA and HG. Numbers below bands indicate fold changes normalized to gapdh. (O, Q) Experimental designs to rescue HG-induced anti-inflammatory/immunomodulatory impairments of MSCs using the AMPK activator MET after (O) and before (Q) co-culture with T cells. MET was dissolved in PBS and was applied at 2 mM. (P, R) ELISA analysis of TNF-α in media from the respective experiments of O and Q. n = 4 per group. Data represents mean ± SD. *P < 0.05; NS, not significant (P > 0.05) (ANOVA followed by Newman-Keuls post-hoc tests).
Figure 6
Figure 6
A second infusion of MSCs in recipient glucose homeostasis ameliorates diabetic osteopenia by anti-inflammation. (A) Non-fasting blood glucose levels of T1D mice after PBS, sMSC or dMSC injection. The 1st MSCs were infused at D25. The 2nd MSCs were infused 14 d later at D39. Grey dashed line indicates diabetic criterion of 250 mg/dL. (B) ELISA analysis of inflammatory cytokine TNF-α in serum, from T1D mice accepting PBS, sMSC or dMSC infusion. (C-I) Representative micro-CT images (C) and quantitative analysis of trabecular (D-H) and cortical (I) bone microarchitecture in the distal metaphyses of femora. Bars: 500 μm. (J-O) Representative images of calcein double labeling and TRAP staining (J) with quantification of bone formation rates (K-M) and bone resorption rates (N, O) in distal femora. Bars: 50 μm (up) and 25 μm (bottom). n = 6 per group. Data represents mean ± SD. *P < 0.05; NS, not significant (P > 0.05) (ANOVA followed by Newman-Keuls post-hoc tests).

Similar articles

Cited by

References

    1. Hare JM, Traverse JH, Henry TD, Dib N, Strumpf RK, Schulman SP. et al. A randomized, double-blind, placebo-controlled, dose-escalation study of intravenous adult human mesenchymal stem cells (prochymal) after acute myocardial infarction. J Am Coll Cardiol. 2009;54:2277–86. - PMC - PubMed
    1. Kharaziha P, Hellstrom PM, Noorinayer B, Farzaneh F, Aghajani K, Jafari F. et al. Improvement of liver function in liver cirrhosis patients after autologous mesenchymal stem cell injection: a phase I-II clinical trial. Eur J Gastroenterol Hepatol. 2009;21:1199–205. - PubMed
    1. Horwitz EM, Gordon PL, Koo WK, Marx JC, Neel MD, McNall RY. et al. Isolated allogeneic bone marrow-derived mesenchymal cells engraft and stimulate growth in children with osteogenesis imperfecta: Implications for cell therapy of bone. Proc Natl Acad Sci U S A. 2002;99:8932–7. - PMC - PubMed
    1. Duijvestein M, Vos AC, Roelofs H, Wildenberg ME, Wendrich BB, Verspaget HW. et al. Autologous bone marrow-derived mesenchymal stromal cell treatment for refractory luminal Crohn's disease: results of a phase I study. Gut. 2010;59:1662–9. - PubMed
    1. Sun L, Akiyama K, Zhang H, Yamaza T, Hou Y, Zhao S. et al. Mesenchymal stem cell transplantation reverses multiorgan dysfunction in systemic lupus erythematosus mice and humans. Stem Cells. 2009;27:1421–32. - PMC - PubMed

Publication types

Substances