Review
. 2017 Mar 7;7(5):1303-1329.
doi: 10.7150/thno.18650. eCollection 2017.

Ultrasound Elastography: Review of Techniques and Clinical Applications

Affiliations
Review

Ultrasound Elastography: Review of Techniques and Clinical Applications

Rosa M S Sigrist et al. Theranostics. .

Abstract

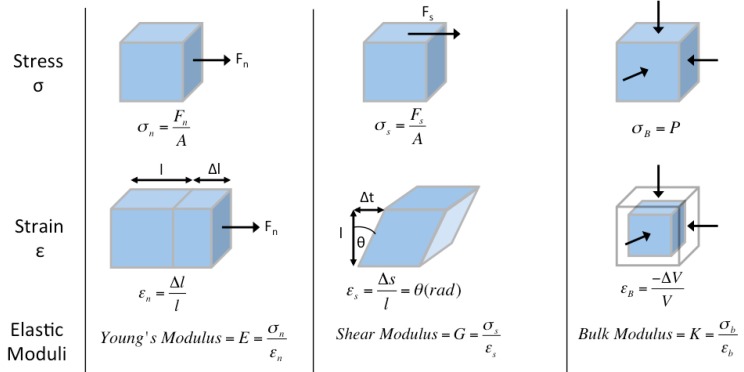
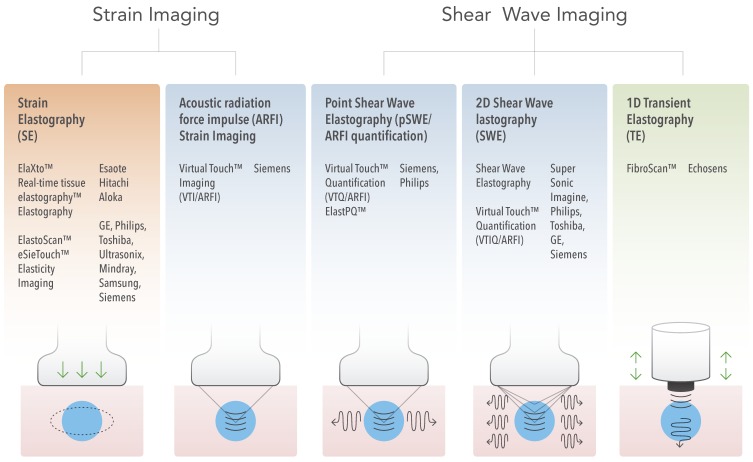
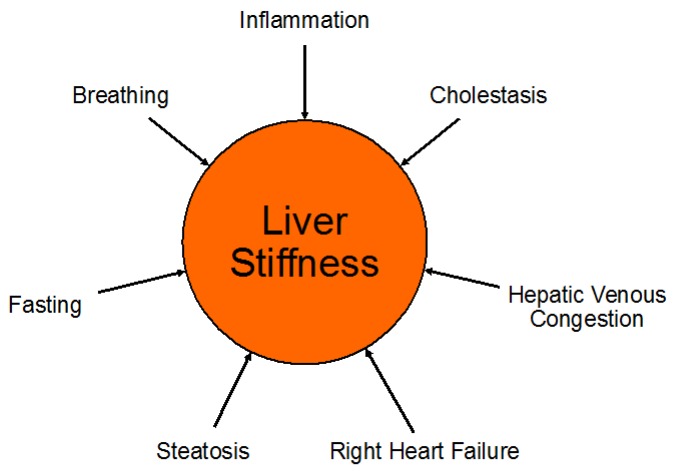
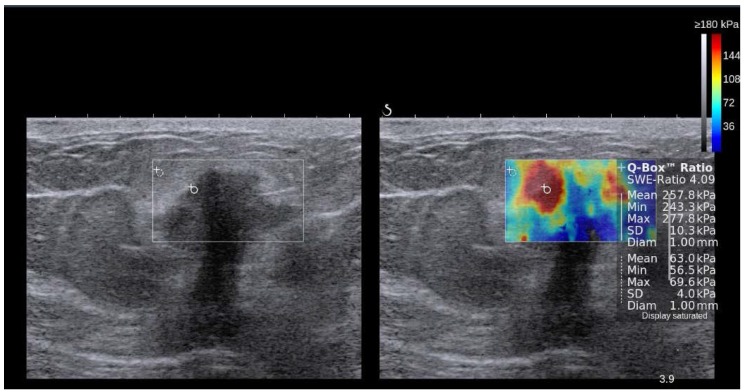
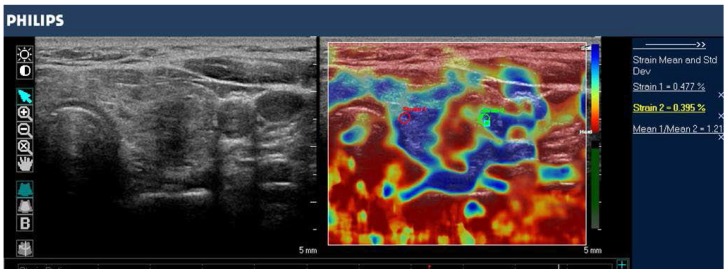
Elastography-based imaging techniques have received substantial attention in recent years for non-invasive assessment of tissue mechanical properties. These techniques take advantage of changed soft tissue elasticity in various pathologies to yield qualitative and quantitative information that can be used for diagnostic purposes. Measurements are acquired in specialized imaging modes that can detect tissue stiffness in response to an applied mechanical force (compression or shear wave). Ultrasound-based methods are of particular interest due to its many inherent advantages, such as wide availability including at the bedside and relatively low cost. Several ultrasound elastography techniques using different excitation methods have been developed. In general, these can be classified into strain imaging methods that use internal or external compression stimuli, and shear wave imaging that use ultrasound-generated traveling shear wave stimuli. While ultrasound elastography has shown promising results for non-invasive assessment of liver fibrosis, new applications in breast, thyroid, prostate, kidney and lymph node imaging are emerging. Here, we review the basic principles, foundation physics, and limitations of ultrasound elastography and summarize its current clinical use and ongoing developments in various clinical applications.

Keywords: Breast; Elastography; Kidney; Liver; Lymph nodes.; Prostate; Shear Wave Imaging; Strain Imaging; Thyroid; Ultrasound.


Conflict of interest statement

Competing Interests: The authors have declared that no competing interest exists.

Figures

Figure 1
Figure 1
Ultrasound elastography physics, deformation models. Static deformations of entirely elastic materials can be described by stress σ (force per unit area, top row), strain ε (expansion per unit length, middle row), and elastic modulus Γ (stress divided by strain, bottom row). This is applied to normal (perpendicular to surface, first column), shear (tangential to surface, second column), and bulk (normal inward or pressure, third column) forces used in ultrasound elastography.
Figure 2
Figure 2
Ultrasound elastography physics, measurement methods. In strain imaging (a), tissue displacement is measured by correlation of RF echo signals between search windows (boxes) in the states before and after compression. In shear wave imaging (b), particle motion is perpendicular to the direction of wave propagation, with shear wave speed cS related to shear modulus G. In B-mode ultrasound (c), particle motion is parallel to the direction of wave propagation, with longitudinal wave speed cL related to bulk modulus K.
Figure 3
Figure 3
Ultrasound Elastography Techniques. Currently available USE techniques can be categorized by the measured physical quantity: 1) strain imaging (left), and 2) shear wave imaging (right). Excitations methods include quasi-static mechanically-induced displacement via active external compression or passively-induced physiologic motion (orange), dynamic mechanically-induced compression via a “thumping” transducer at the tissue surface to produce shear waves (green), and dynamic ultrasound-induced tissue displacement and shear waves by acoustic radiation force impulse excitation (blue).
Figure 4
Figure 4
Summary of Shear Wave Imaging methods.
Figure 5
Figure 5
Pathologic and normal physiologic processes which can be confounders of liver stiffness measurements. Among other causes, right heart failure can lead to hepatic venous congestion with consecutive elevation of liver stiffness due to the increased venous pressure. Increased levels of inspiration and expiration (Valsalva maneuver) can also increase liver stiffness and, therefore, patients need to be coached regarding breathing instructions when obtaining liver stiffness measurements.
Figure 6
Figure 6
Graphical demonstration of the Tsukuba score. The lesion is shown as an oval, with colors indicating lesion stiffness (blue=increased, red=decreased) compared to the surrounding tissue. With increasing Tsukuba score (1-5), lesions have a higher probability of malignancy. The tri-laminar appearance of blue, green and red (BGR) bands (far right image) is diagnostic of a cyst when visualized using several ultrasound vendors (e.g. Hitachi, Toshiba) (figure adapted from Itoh et al, 2006 9).
Figure 7
Figure 7
Side-by-side display of anatomical B-mode US image (left) and overlaid color map of simultaneous shear wave measurements (right) of a breast lesion obtained with 2D-SWE on a SuperSonic Imagine (SSI) AixplorerTM. In this system, red color represents stiff tissue and blue color reflects soft tissue. The suspicious hypoechoic lesion (shown within rectangle on B-mode image) has an irregular border, angular margins, is slightly wider than tall and shows posterior acoustic shadowing. The elastogram suggested malignant etiology due to increased stiffness (red/yellow/green) and ductal adenocarcinoma was confirmed on subsequent biopsy. Image courtesy by Dr. Osmar Saito.
Figure 8
Figure 8
B-mode image (left) and color-coded elastogram (right) of a thyroid nodule in the left thyroid gland, imaged with SE on a Philips iU22 system. The nodule appears hypoechoic with ill-defined borders on anatomical B-mode image. The elastogram shows normal thyroid tissue encoded with blue color (soft tissue) and the nodule with red color (stiff tissue), suggesting a malignant nodule. This was confirmed by histology which showed papillary thyroid carcinoma.
Figure 9
Figure 9
Transverse B-mode image (left) shows small heterogeneous thyroid nodule (lesion within region of interest) with ill-defined margins and microcalcifications in the right thyroid lobe, suggesting malignant etiology. Corresponding color elastogram obtained with 2D-SWE on a Toshiba Aplio 500 (right) shows increased stiffness in the nodule (pink ROI; 32.7 kPa) compared to surrounding normal parenchyma (white ROI; 7.4 kPa), suggesting that the nodule is malignant. Subsequent biopsy confirmed papillary carcinoma.
Figure 10
Figure 10
B-mode image (left) of a cervical lymph node shows a hypoechoic rounded lymph node. Elastogram (right) demonstrated that the lymph node is stiffer compared to surrounding tissue (homogeneous blue color elasticity signal on SE imaging with a Philips iU22 system), suggesting an abnormal lymph node that warrants biopsy. Subsequent biopsy resulted in the diagnosis of tuberculous lymphadenitis.

Similar articles

Cited by

References

    1. Gennisson JL, Deffieux T, Fink M, Tanter M. Ultrasound elastography: principles and techniques. Diagnostic and interventional imaging. 2013;94:487–95. - PubMed
    1. Shiina T, Nightingale KR, Palmeri ML, Hall TJ, Bamber JC, Barr RG. et al. WFUMB guidelines and recommendations for clinical use of ultrasound elastography: Part 1: basic principles and terminology. Ultrasound in medicine & biology. 2015;41:1126–47. - PubMed
    1. Kamaya A, Machtaler S, Safari Sanjani S, Nikoozadeh A, Graham Sommer F, Pierre Khuri-Yakub BT. et al. New technologies in clinical ultrasound. Seminars in roentgenology. 2013;48:214–23. - PubMed
    1. Bamber J, Cosgrove D, Dietrich CF, Fromageau J, Bojunga J, Calliada F. et al. EFSUMB guidelines and recommendations on the clinical use of ultrasound elastography. Part 1: Basic principles and technology. Ultraschall in der Medizin. 2013;34:169–84. - PubMed
    1. Tang A, Cloutier G, Szeverenyi NM, Sirlin CB. Ultrasound Elastography and MR Elastography for Assessing Liver Fibrosis: Part 1, Principles and Techniques. American journal of roentgenology. 2015;205:22–32. - PMC - PubMed

MeSH terms