Review
. 2017;5(5):19.
doi: 10.1007/s40134-017-0213-0. Epub 2017 Mar 29.

Dual-Energy CT in Head and Neck Imaging

Affiliations
Review

Dual-Energy CT in Head and Neck Imaging

Elise D Roele et al. Curr Radiol Rep. 2017.

Abstract

Purpose of review: To explain the technique of Dual-energy CT (DECT) and highlight its applications and advantages in head and neck radiology.

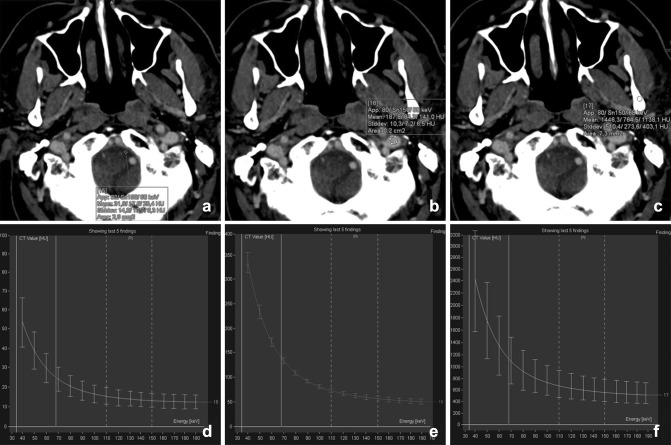
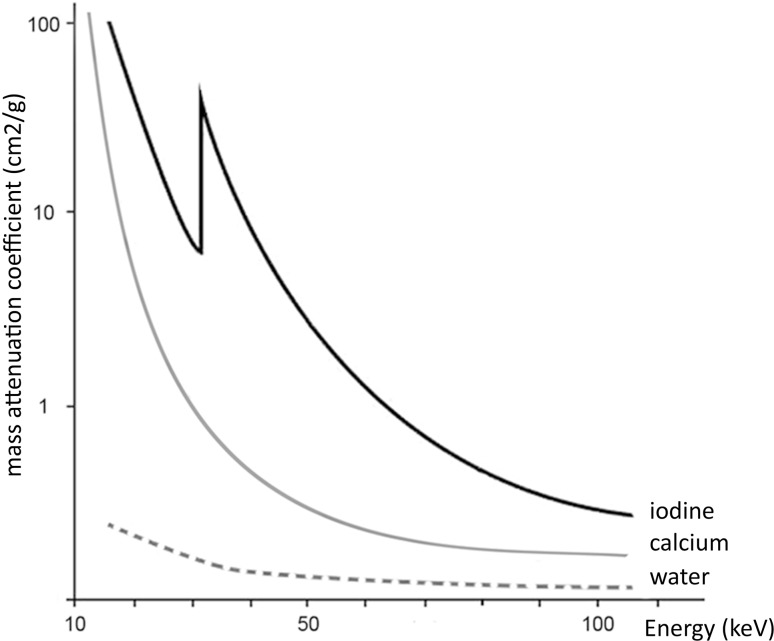
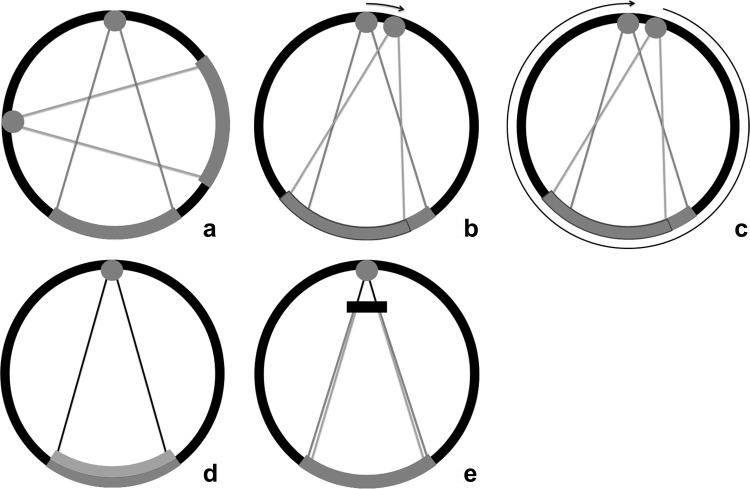
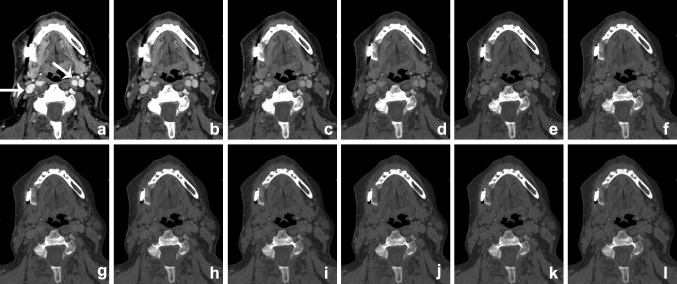
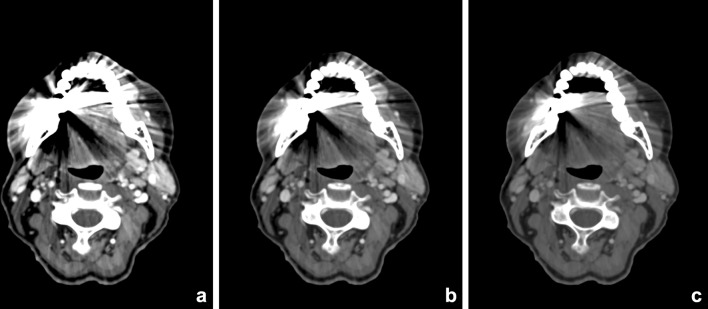
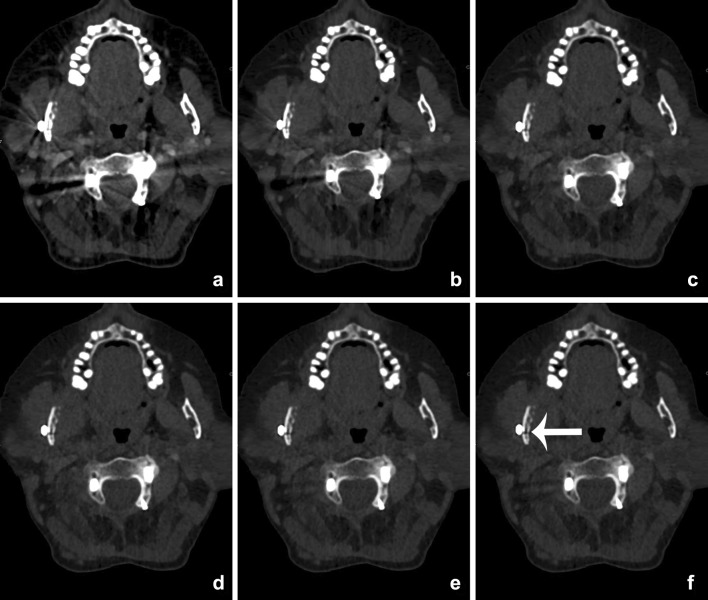
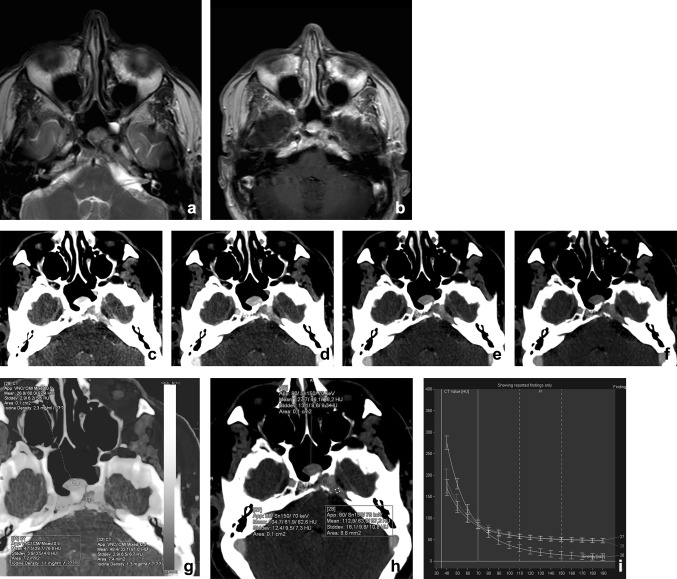
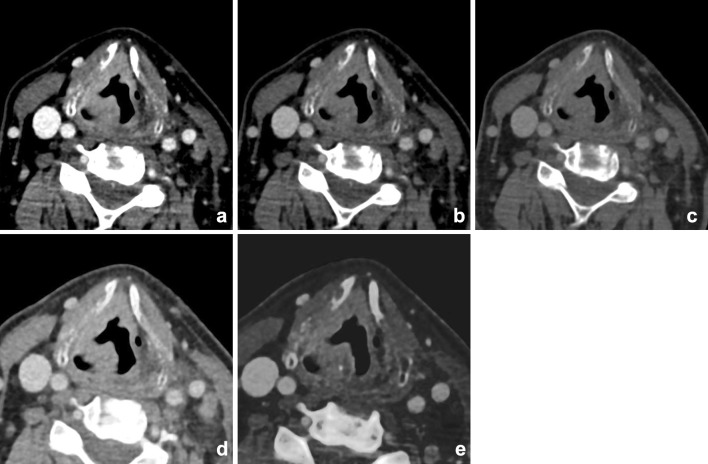
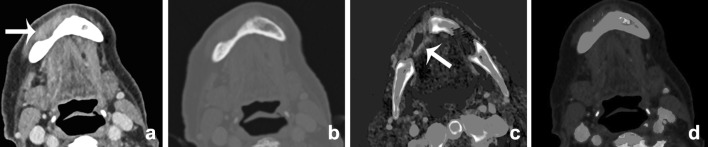
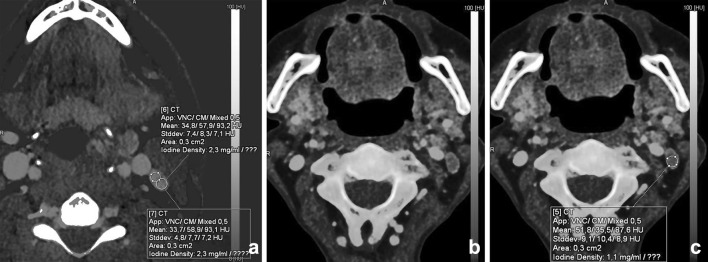
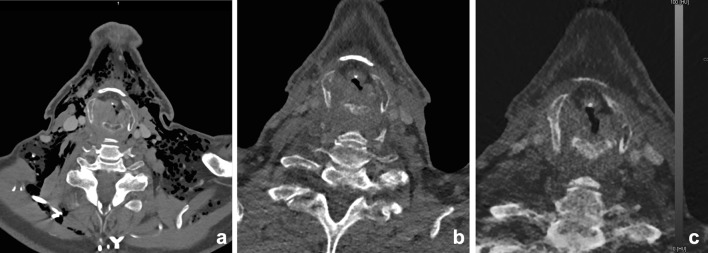
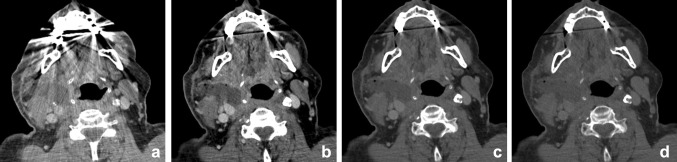
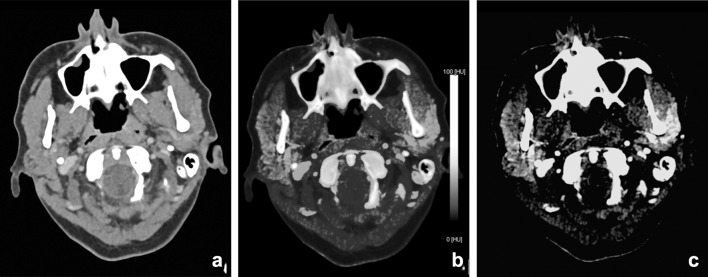
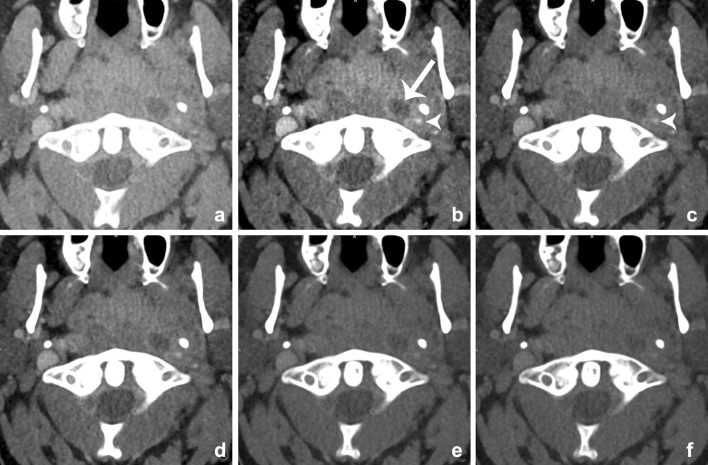
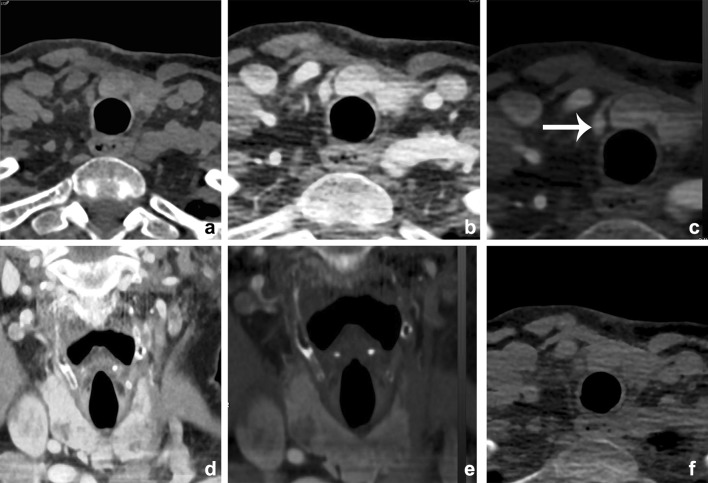
Recent findings: Using DECT, additional datasets can be created next to conventional images. In head and neck radiology, three material decomposition algorithms can be used for improved lesion detection and delineation of the tumor. Iodine concentration measurements can aid in differentiating malignant from nonmalignant lymph nodes and benign posttreatment changes from tumor recurrence. Virtual non-calcium images can be used for detection of bone marrow edema. Virtual mono-energetic imaging can be useful for improved iodine conspicuity at lower keV and for reduction of metallic artifacts and increase in signal-to-noise ratio at higher keV.

Summary: DECT and its additional reconstructions can play an important role in head and neck cancer patients, from initial diagnosis and staging, to therapy planning, evaluation of treatment response and follow-up. Moreover, it can be helpful in imaging of infections and inflammation and parathyroid imaging as supplementary reconstructions can be obtained at lower or equal radiation dose compared with conventional single energy scanning.

Keywords: Dual-energy CT; Head and neck cancer; Lymph node imaging; Metal artifact reduction; Parathyroid adenoma; Spectral CT.


Conflict of interest statement

Conflict of interest

Elise D. Roele, Veronique C. M. L. Timmer, Lauretta A. A. Vaassen, and Anna M. J. L. van Kroonenburgh, all declare no potential conflicts of interest. A. A. Postma reports speaker fees from Bayer and is a section editor for Current Radiology Reports.

Human and Animal Rights

All reported studies/experiments with human or animal subjects performed by the authors have been previously published and complied with all applicable ethical standards (including the Helsinki declaration and its amendments, institutional/national research committee standards, and international/national/institutional guidelines).

Figures

Fig. 1
Fig. 1
The spectral curves depicted from a DECT of the neck are shown for cerebrospinal fluid (water a, d), vessels (iodine b, e), and bone (calcium c, f). Hounsfield units (HU) are plotted against the mono-energetic energies ranging from 30 to 190 keV. Note that the HU scale differs for each plot. At lower energy, the HU increases, especially in calcium and iodine
Fig. 2
Fig. 2
Attenuation curves of iodine, calcium, and water plotted against energy (keV). At lower energy, the attenuation of iodine (Z = 53) is increasing with an additional increase at the k-edge. The attenuations of calcium (Z = 20) and water are significantly lower than that for iodine, providing the possibility for material differentiation in DECT
Fig. 3
Fig. 3
DECT systems. Dual-source dual-energy system (a): two separate X-ray tubes and detectors are orthogonally mounted for simultaneous data acquisition and processing. Each tube can be set at different voltage levels. The kVp settings can be adjusted between 70 and Sn150 kVp for the latest generation dual-source scanner (Siemens). Single-source dual-energy system: switching the kVp setting can generate two spectra. One method is fast kV switching (b), in which one X-ray tube rapidly switches between low and high kVps (GE). The second method is kVp switching between single rotations (c), the so-called dual spiral approach (Toshiba, Siemens). A single detector then processes the information from both voltage levels. Dual-layer system (d): a polychromatic spectrum from one tube passes on to a dual-layer detector. The upper layer is sensitive to the low-energy photons, while the second layer processes the high-energy photons. The combination of both detectors creates the combined image (Phillips). Single-source twin-beam system (e): the single X-ray beam is pre-filtered between the tube and the patient by gold (Au) and tin (Sn) filter. The 120-kVp X-ray beam is split into high- (Sn) and low-energy (Au) spectra (Siemens)
Fig. 4
Fig. 4
VMI at the range of 40–150 keV (al, 10-keV interval) scanned after administration of iodinated contrast. The patient presented with an osteomyelitis of the mandible and cutaneous fistula (see also Fig. 12). Iodine conspicuity was increased at lower keV, as can be noticed by the increased CNR around the vessels (arrow). Higher-energy VMI results in an increase in signal-to-noise (SNR) and a decrease in streak artifacts caused by metallic hardware
Fig. 5
Fig. 5
Contrast-enhanced DECT of the oral cavity with VMIs at 55 keV (a), 70 keV (b), and 100 keV (c). Significant beam-hardening artifacts in the oral cavity are present, due to dental fillings. These artifacts are reduced at higher VMI. This is accompanied by an increase of SNR, whereas iodine conspicuity decreases
Fig. 6
Fig. 6
VMIs at 60 (a), 80 (b), 100 (c), 120 (d), 140 (e), and 160 keV (f) of a patient with a cervical spondylodesis and metallic hardware of the mandible (see also Fig. 12). With the increasing virtual mono-energetic energy, further reduction of metallic artifacts of both the cervical spondylodesis and the metallic hardware of the mandible can be seen. At lower keV, streak artifacts obscure pathology at the right mandibular ramus. At higher keV, a fracture becomes visible at the mandible, which was undetectable at the mixed-imaging and low-keV images (arrow)
Fig. 7
Fig. 7
A 48-year-old male presented with a traumatic skull base lesion. Initial CT demonstrated a lesion at the petroclival fissure, apex, and sphenoid sinus. MR with T2-weighted (a) and T1-weighted post-gadolinium images (b) showed the presence of the lesion with relatively low T2-signal and enhancement after gadolinium. By performing a transnasal biopsy of the sphenoid part, it would be feasible to obtain a histopathological diagnosis of the skull base lesion. On CT, the lesion is well appreciated with osteolysis of the petrous apex and enhanced after iodinated contrast. However, after mono-energetic reconstructions (cf, 40–80 keV) and iodine fusion imaging, the lesion consists of two parts, with the medial part being more enhancing at lower keV, with higher iodine uptake at fusion imaging (g, h). The graphs of the spectral curves (i) demonstrate two different attenuation curves. It was concluded that the medial part of the lesion was different from the lateral part and probably herniated pituitary after trauma. The more lateral lesion of the skull base still has no definitive diagnosis, because of the difficulty in accessing for biopsy. Thus far, no growth of the lesion is noted during follow-ups
Fig. 8
Fig. 8
Supralaryngeal carcinoma of the right hemilarynx in a 74-year-old male. Increased conspicuity of the tumor was shown at the lower virtual mono-energetic reconstructions (40 (a), 55 (b), and 70 (c) keV). Note the increased differences between tumor and strap muscles at lower-keV settings, compared with mixed imaging (d) and higher-keV settings. These differences were even more enhanced on iodine fusion imaging (e). Also the extra-laryngeal extension was more easily appreciated at the iodine fusion images
Fig. 9
Fig. 9
A male with previous laryngeal cancer and oral implants presented with suspicion of oral cavity SCC at the site of the implants. MR showed considerable distortion and interpretation difficulties at the tumor site (T1-weighted (T1-w) (a). Fat-supressed T1-w after gadolinium (b) demonstrated abnormal signal and enhancement; however, delineation was challenging due to artifacts. 5 mm DECT with soft kernel at 50% linear blending (c), 90% (d), and 10% (e) blending demonstrated the implants and osseous destruction of the mandible, better visualized at higher energies. Tumor enhancement was, however, difficult at mixed imaging, but was easily visualized at iodine fusion imaging (fh). Bone marrow edema is demonstrated at BME imaging (i)
Fig. 10
Fig. 10
Different reconstructions from one dataset. DECT of a 77-year-old male showed a right-sided piriform sinus SCC (a, mixed), suggestive of thyroid invasion. The tumor delineation is better depicted at the lower-energy images of the VMI (b: 40 keV; c: 70 keV; and d: 100 keV), and on the iodine fusion images (e, f). Bone marrow edema (BME) image (d), which demonstrates edema at the thyroid cartilage. Visualization of direct tumor invasion is the easiest way to demonstrate cartilage invasion; this can be demonstrated made more easily by means of lower-energy images from VMI and iodine fusion images. Demonstration of edema of the thyroid in virtual non-calcium images can serve as an additional argument for invasion of the thyroid (arrow)
Fig. 11
Fig. 11
A 50-year-old female underwent cystostomy for a left-sided keratocyst of the mandible (a). After 6 months, therapy was evaluated by DECT(b, mixed). A residual lesion was found, with some residual edema (c, BME) and reparative bone apposition, but without signs of enhancement (d, e, iodine fusion (iodine concentration 0.3 mg/ml))
Fig. 12
Fig. 12
A 60-year-old male presented with a persistent fistula after mandibular reconstruction, due to chronic osteomyelitis of the mandible. Depicted are 5 mm Maximum intensity projections of the mandible, showing metallic hardware next to an osteolytic mandible (a). BME images demonstrate bone marrow edema at the right mandible (b). The fistula is demonstrated at (c) and clearly enhanced at iodine fusion images at (d, arrow)
Fig. 13
Fig. 13
A 90-year-old male was referred for staging of a gingival tumor originating at the right mandible. An MRI was contraindicated, and a DECT of the oral cavity was performed. Mixed images in soft tissue kernel (a) and bone kernel (b); iodine fusion images (c), and BME reconstructions (d). An enhancing tumor was found at the right mandible (a, arrow) overlying an area of eroded or remodeled mandible (b) with sclerosis. Iodine fusion images additionally suggested invasion of the floor of the mouth, which was not seen on the mixed images (c, arrow). BME images did not show bone marrow edema. At histopathology, no osseous invasion was found
Fig. 14
Fig. 14
Differentiation between malignant and benign or inflammatory lymph nodes is feasible with DECT. A patient with a parapharyngeal abscess demonstrated a level-2 lymph node; iodine uptake was 2.3 mg/ml (a); this in contrast to the iodine concentration of a lymph node in a patient with oropharyngeal squamous cell carcinoma of the vallecula (iodine concentration 1.1 mg/ml). Malignant lymph nodes have lower iodine uptake than normal or inflammatory lymph nodes, as is demonstrated in (b) and (c)
Fig. 15
Fig. 15
An 81-year old male patient with a hypopharyngeal carcinoma from the piriform sinus, presented 6 months after chemoradiation to evaluate therapy response. The initial CT with the presence of a bilateral tumor of the piriform sinus and massive (postoperative) subcutaneous emphysema (a). A mixed DECT at one year (b) was made for evaluation of therapy effect and exclusion of residual tumor. Bilateral swelling is present, without clear enhancement at mixed imaging. At the iodine overlay images (c), no increased iodine uptake was present; benign posttreatment changes without residual or recurrent tumor were concluded
Fig. 16
Fig. 16
Infection/abscesses: increased conspicuity at lower keV. A 65-year-old-male patient presented with a neck mass and a c-reactive protein of 180 μg/ml one week after carotid endarteriectomy. Mixed/blended imaging showed right-sided swelling of the neck (a). Anterior of the sternocleidomastoid muscle, a fluid collection was visible, without obvious rim enhancement at mixed imaging. bd The virtual mono-energetic reconstructions of 40 (b), 55 (c), and 70 (d) keV. At higher keV, SNR was increased, but showed decrease of lesion conspicuity. At 40 keV, the lesion conspicuity and rim enhancement of the lesion were most optimal and suggestive of abscess formation. Small air bubbles were visible at the anterior part of the lesion
Fig. 17
Fig. 17
A 48-year-old female with poor dental status presented with facial swelling and painful mouth opening. DECT was performed to rule out dental or neck abscesses, or arthritis of the temporomandibular joint. Mixed, 120-kVp-like images (a) demonstrated, besides a slight asymmetry no obvious abnormalities or fat stranding. The scan was initially interpreted as normal. However, Iodine map (b) and iodine fusion (c) images demonstrated clearly increased uptake of iodine at the superficial part of the parotid gland. Parotitis of the superficial lobe of the parotid gland was concluded
Fig. 18
Fig. 18
Images of a young male patient with prevertebral abscesses. Blended images (50%) (a) and VMIs (bf). VMIs demonstrate improved visualization of the infiltration and abscesses at lower energies (arrow): 40 keV (b), 50 keV (c), 60 keV (d), 70 keV (e), and 80 keV (f). There is better visualization of the internal carotid artery at lower mono-energetic reconstructions, compared with blended image and higher-energy images, although at the cost of increased noise (arrowhead)
Fig. 19
Fig. 19
A 63-year-old female presented with primary hyperparathyroidism. Initial Choline PET imaging and MIBI scanning were negative. A multiphase CT showed a small enhancing lesion just caudal to the right thyroid lobe, which was proven a parathyroid adenoma (arrow). Axial noncontrast images (a), 30-sec axial-mixed images (b), iodine fusion images (c), and coronal mixed (d), and fusion (e) images. A Virtual noncontrast image is shown at (f), the latter demonstrating more noise and streak artifacts than the true nonenhanced scan, although still diagnostic. Noncontrast CT: 80 kVp 277 mAs; CTDI 5.34 mGy; DLP 113.4 mGycm. DECT 30 s: 80/150 kVP 61/31 mAs; CTDI 5.52 mGy; DLP 113.0 mGycm

References

    1. Schulz B, Kuehling K, Kromen W, Siebenhandl P, Kerl MJ, Vogl TJ, et al. Automatic bone removal technique in whole-body dual-energy CT angiography: performance and image quality. AJR Am J Roentgenol. 2012;199(5):W646–W650. doi: 10.2214/AJR.12.9176. - DOI - PubMed
    1. Watanabe Y, Uotani K, Nakazawa T, Higashi M, Yamada N, Hori Y, et al. Dual-energy direct bone removal CT angiography for evaluation of intracranial aneurysm or stenosis: comparison with conventional digital subtraction angiography. Eur Radiol. 2009;19(4):1019–1024. doi: 10.1007/s00330-008-1213-5. - DOI - PubMed
    1. Graser A, Johnson TR, Hecht EM, Becker CR, Leidecker C, Staehler M, et al. Dual-energy CT in patients suspected of having renal masses: can virtual nonenhanced images replace true nonenhanced images? Radiology. 2009;252(2):433–440. doi: 10.1148/radiol.2522080557. - DOI - PubMed
    1. Boll DT, Patil NA, Paulson EK, Merkle EM, Simmons WN, Pierre SA, et al. Renal stone assessment with dual-energy multidetector CT and advanced postprocessing techniques: improved characterization of renal stone composition–pilot study. Radiology. 2009;250(3):813–820. doi: 10.1148/radiol.2503080545. - DOI - PubMed
    1. Bauer RW, Kerl JM, Weber E, Weisser P, Korkusuz H, Lehnert T, et al. Lung perfusion analysis with dual energy CT in patients with suspected pulmonary embolism–influence of window settings on the diagnosis of underlying pathologies of perfusion defects. Eur J Radiol. 2011;80(3):e476–e482. doi: 10.1016/j.ejrad.2010.09.009. - DOI - PubMed

LinkOut - more resources