

Featured Article: Depletion of HDL3 high density lipoprotein and altered functionality of HDL2 in blood from sickle cell patients
- PMID: 28436274
- PMCID: PMC5476340
- DOI: 10.1177/1535370217706966
Featured Article: Depletion of HDL3 high density lipoprotein and altered functionality of HDL2 in blood from sickle cell patients
Abstract
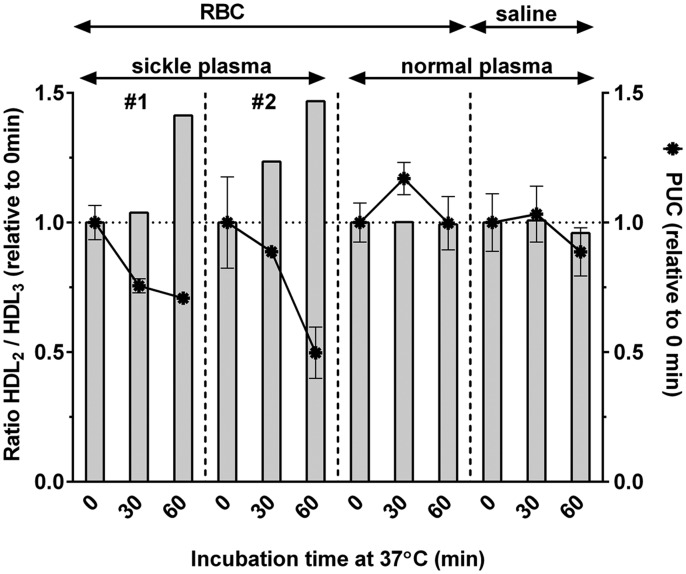
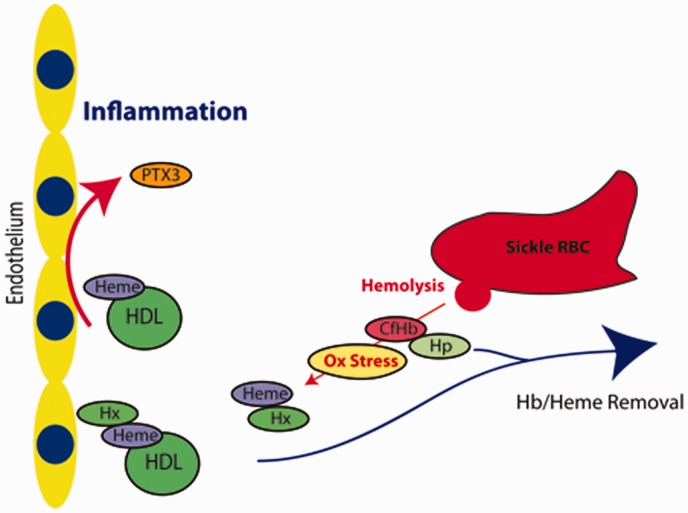
In sickle cell disease (SCD), alterations of cholesterol metabolism is in part related to abnormal levels and activity of plasma proteins such as lecithin cholesterol acyltransferase (LCAT), and apolipoprotein A-I (ApoA-I). In addition, the size distribution of ApoA-I high density lipoproteins (HDL) differs from normal blood. The ratio of the amount of HDL2 particle relative to the smaller higher density pre-β HDL (HDL3) particle was shifted toward HDL2. This lipoprotein imbalance is exacerbated during acute vaso-occlusive episodes (VOE) as the relative levels of HDL3 decrease. HDL3 deficiency in SCD plasma was found to relate to a slower ApoA-I exchange rate, which suggests an impaired ABCA1-mediated cholesterol efflux in SCD. HDL2 isolated from SCD plasma displayed an antioxidant capacity normally associated with HDL3, providing evidence for a change in function of HDL2 in SCD as compared to HDL2 in normal plasma. Although SCD plasma is depleted in HDL3, this altered capacity of HDL2 could account for the lack of difference in pro-inflammatory HDL levels in SCD as compared to normal. Exposure of human umbilical vein endothelial cells to HDL2 isolated from SCD plasma resulted in higher mRNA levels of the acute phase protein long pentraxin 3 (PTX3) as compared to incubation with HDL2 from control plasma. Addition of the heme-scavenger hemopexin protein prevented increased expression of PTX3 in sickle HDL2-treated cells. These findings suggest that ApoA-I lipoprotein composition and functions are altered in SCD plasma, and that whole blood transfusion may be considered as a blood replacement therapy in SCD. Impact statement Our study adds to the growing evidence that the dysfunctional red blood cell (RBC) in sickle cell disease (SCD) affects the plasma environment, which contributes significantly in the vasculopathy that defines the disease. Remodeling of anti-inflammatory high density lipoprotein (HDL) to pro-inflammatory entities can occur during the acute phase response. SCD plasma is depleted of the pre-β particle (HDL3), which is essential for stimulation of reverse cholesterol from macrophages, and the function of the larger HDL2 particle is altered. These dysfunctions are exacerbated during vaso-occlusive episodes. Interaction of lipoproteins with endothelium increases formation of inflammatory mediators, a process counteracted by the heme-scavenger hemopexin. This links hemolysis to lipoprotein-mediated inflammation in SCD, and hemopexin treatment could be considered. The use of RBC concentrates in transfusion therapy of SCD patients underestimates the importance of the dysfunctional plasma compartment, and transfusion of whole blood or plasma may be warranted.
Keywords: Inflammation; acute phase proteins; hemopexin; lipoproteins; sickle disease.
Figures


Similar articles
-
Featured Article: Alterations of lecithin cholesterol acyltransferase activity and apolipoprotein A-I functionality in human sickle blood.Exp Biol Med (Maywood). 2016 Nov;241(17):1933-1942. doi: 10.1177/1535370216657447. Epub 2016 Jun 27. Exp Biol Med (Maywood). 2016. PMID: 27354333 Free PMC article.
-
Human apolipoprotein A-II determines plasma triglycerides by regulating lipoprotein lipase activity and high-density lipoprotein proteome.Arterioscler Thromb Vasc Biol. 2010 Feb;30(2):232-8. doi: 10.1161/ATVBAHA.109.198226. Epub 2009 Nov 12. Arterioscler Thromb Vasc Biol. 2010. PMID: 19910634
-
Conversion of apolipoprotein-specific high-density lipoprotein populations during incubation of human plasma.Biochim Biophys Acta. 1989 Feb 20;1001(3):325-37. doi: 10.1016/0005-2760(89)90117-3. Biochim Biophys Acta. 1989. PMID: 2492827
-
High-density lipoprotein subclasses and their relationship to cardiovascular disease.J Clin Lipidol. 2012 Nov-Dec;6(6):496-523. doi: 10.1016/j.jacl.2012.03.001. Epub 2012 Mar 23. J Clin Lipidol. 2012. PMID: 23312047 Review.
-
The Red Blood Cell-Inflammation Vicious Circle in Sickle Cell Disease.Front Immunol. 2020 Mar 13;11:454. doi: 10.3389/fimmu.2020.00454. eCollection 2020. Front Immunol. 2020. PMID: 32231672 Free PMC article. Review.
Cited by
-
Cholesterol transport between red blood cells and lipoproteins contributes to cholesterol metabolism in blood.J Lipid Res. 2020 Dec;61(12):1577-1588. doi: 10.1194/jlr.RA120000635. Epub 2020 Sep 9. J Lipid Res. 2020. PMID: 32907987 Free PMC article.
-
Hemoglobin and High-Density Lipoprotein as Biomarker of Left Atrial Dilatation in Sickle Cell Disease.EJHaem. 2025 Aug 22;6(4):e70135. doi: 10.1002/jha2.70135. eCollection 2025 Aug. EJHaem. 2025. PMID: 40862241 Free PMC article.
-
Altered HDL particle in sickle cell disease: decreased cholesterol content is associated with hemolysis, whereas decreased Apolipoprotein A1 is linked to inflammation.Lipids Health Dis. 2019 Dec 20;18(1):225. doi: 10.1186/s12944-019-1174-5. Lipids Health Dis. 2019. PMID: 31861992 Free PMC article.
-
Acacia Senegal (Gum Arabic) Supplementation Modulate Lipid Profile and Ameliorated Dyslipidemia among Sickle Cell Anemia Patients.J Lipids. 2019 Jun 18;2019:3129461. doi: 10.1155/2019/3129461. eCollection 2019. J Lipids. 2019. PMID: 31316836 Free PMC article.
References
-
- Monnet D, Kane F, Konan-Waidhet D, Diafouka F, Sangare A, Yapo AE. Lipid, apolipoprotein AI and B levels in Ivorian patients with sickle cell anaemia. Annales de biologie clinique 1996; 54: 285–8. - PubMed
-
- Ozturk OH, Can Y, Yonden Z, Motor S, Oktay G, Kaya H, Aslan M. Lipoprotein subfraction profile and HDL-associated enzymes in sickle cell disease patients. Lipids 2013; 48: 1217–26. - PubMed
-
- Ren H, Ghebremeskel K, Okpala I, Ugochukwu CC, Crawford M, Ibegbulam O. Abnormality of erythrocyte membrane n-3 long chain polyunsaturated fatty acids in sickle cell haemoglobin C (HbSC) disease is not as remarkable as in sickle cell anaemia (HbSS). Prostaglandins Leukot Essent Fatty Acids 2006; 74: 1–6. - PubMed
-
- Sasaki J, Waterman MR, Buchanan GR, Cottam GL. Plasma and erythrocyte lipids in sickle cell anaemia. Clin Lab Haematol 1983; 5: 35–44. - PubMed
MeSH terms
Substances
LinkOut - more resources
Full Text Sources
Other Literature Sources
Medical
Miscellaneous