. 2017 Apr 24:8:15104.
doi: 10.1038/ncomms15104.

DNA single-strand break-induced DNA damage response causes heart failure

Affiliations

DNA single-strand break-induced DNA damage response causes heart failure

Tomoaki Higo et al. Nat Commun. .

Abstract

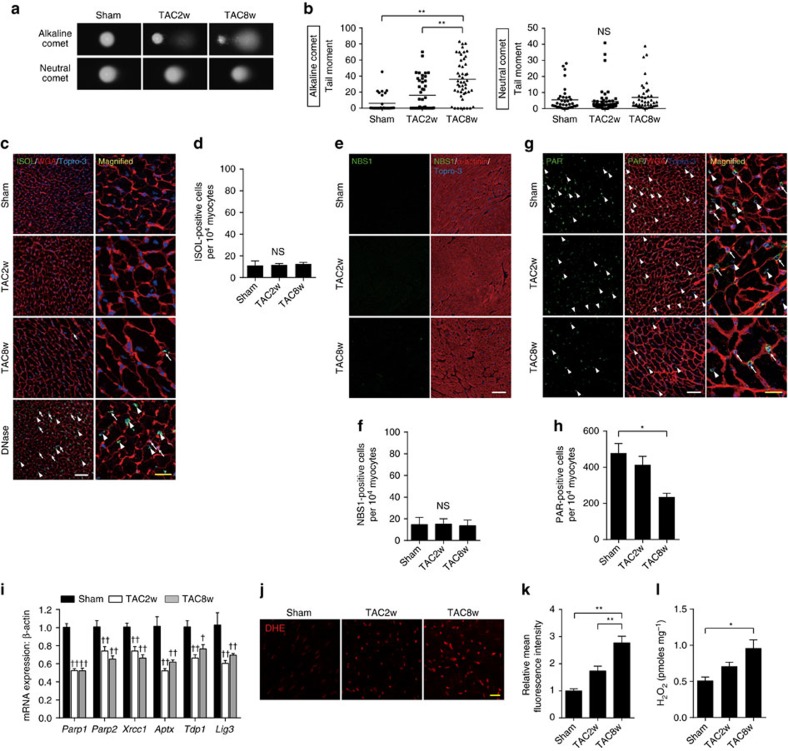
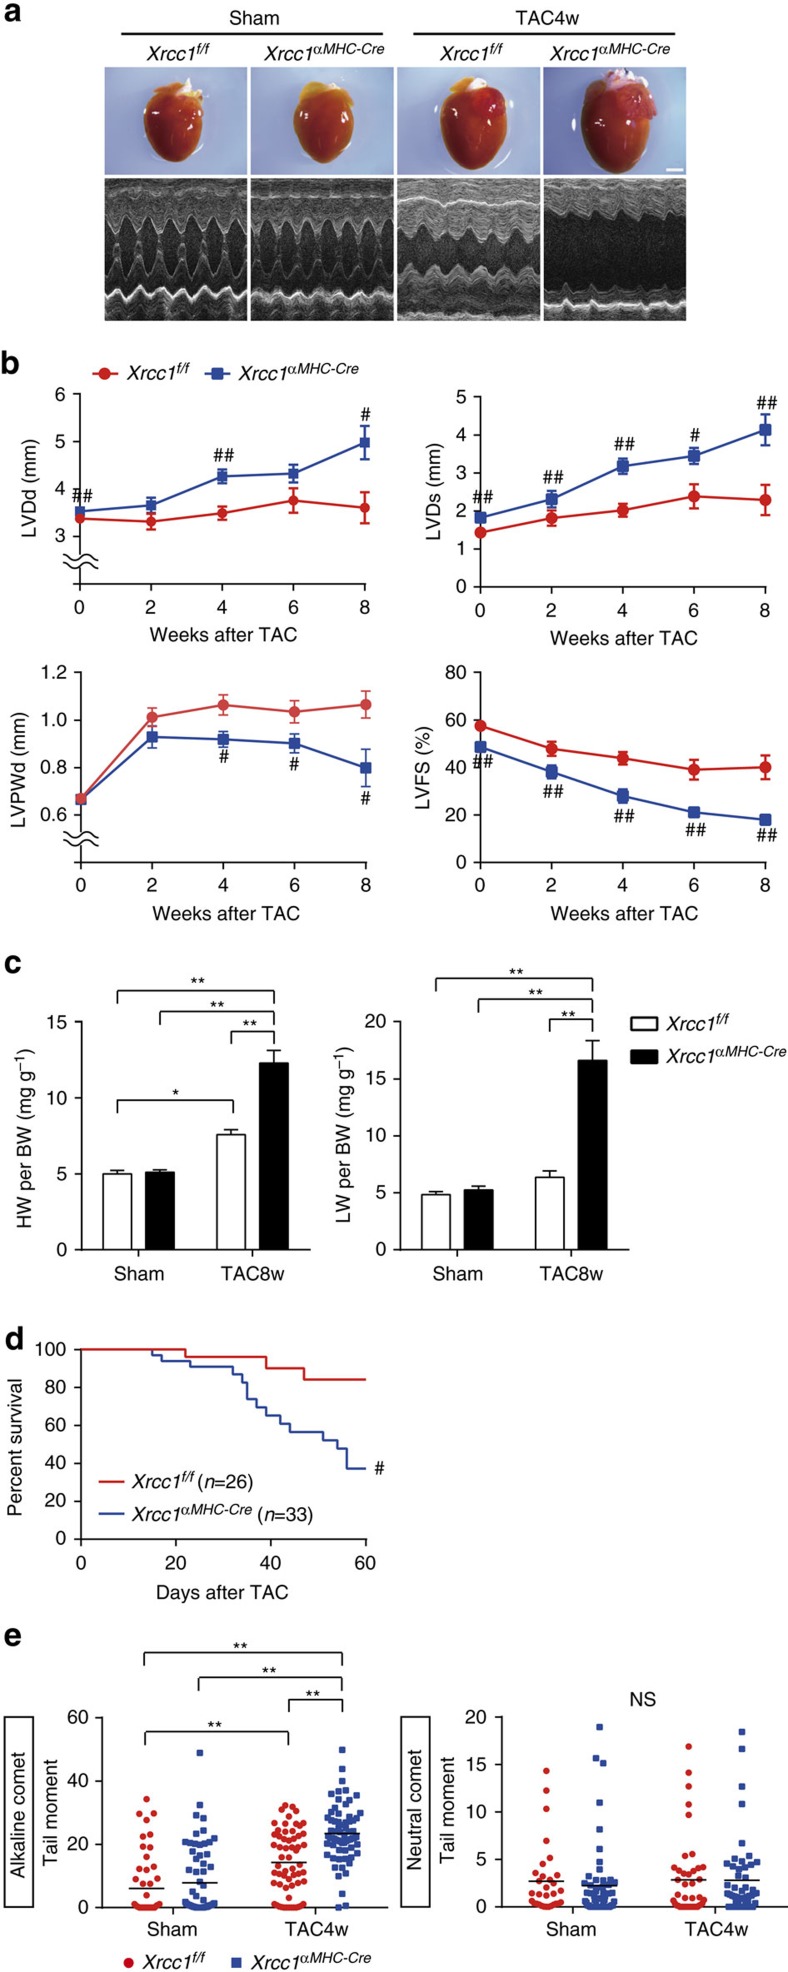
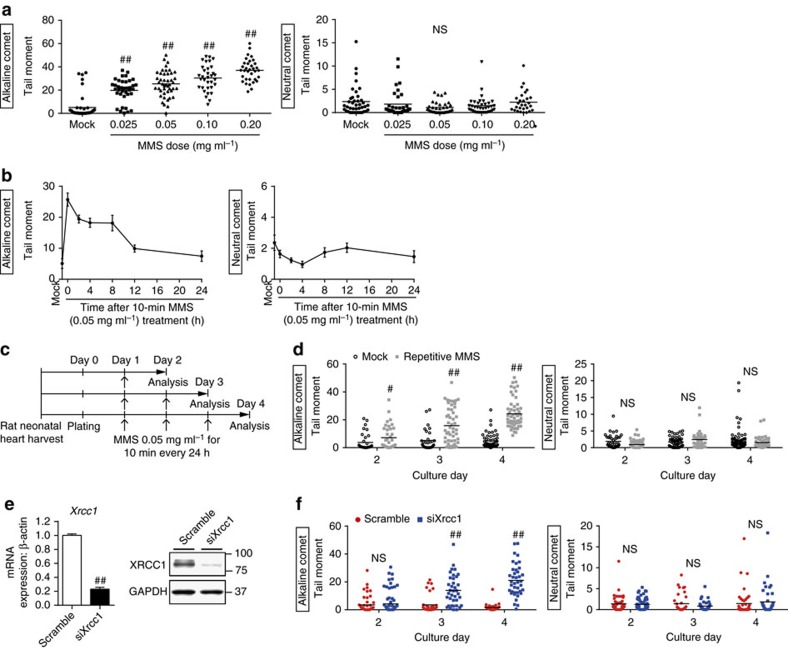
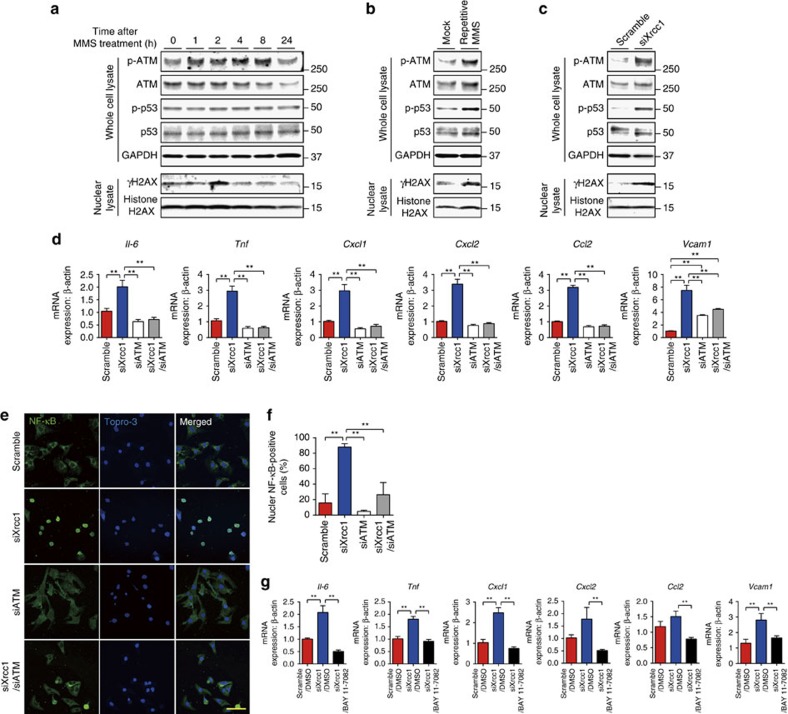
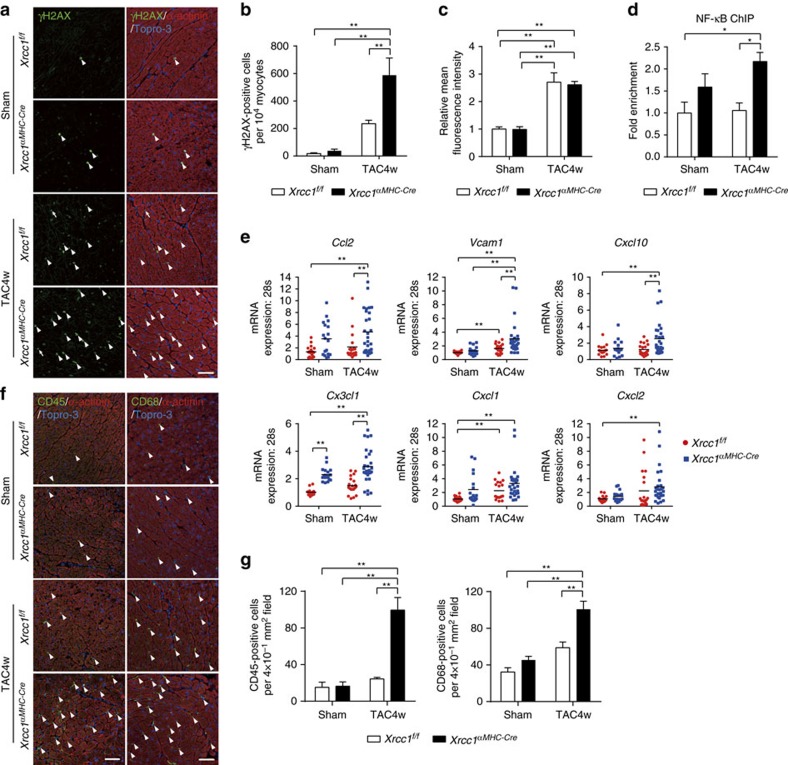
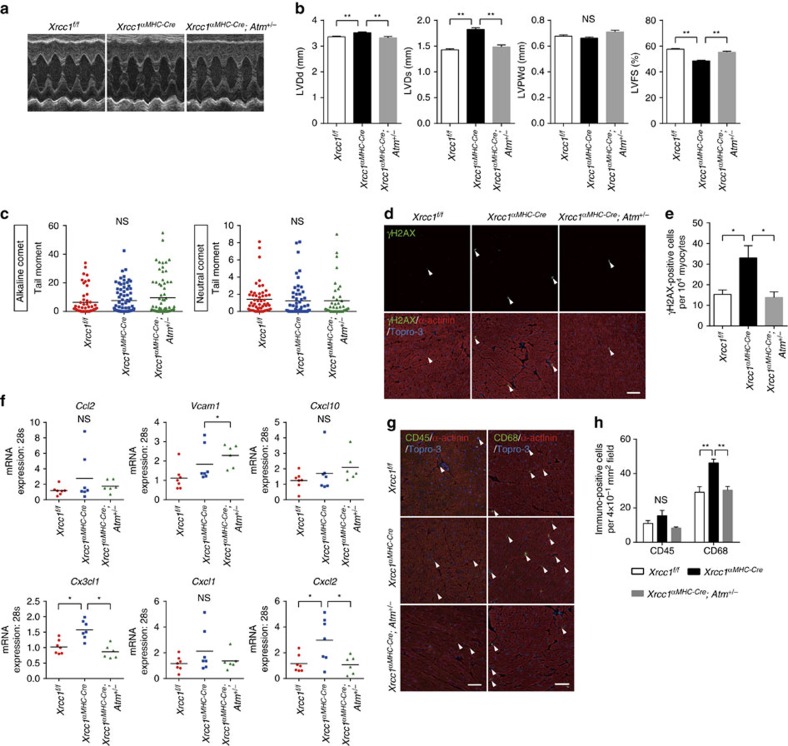
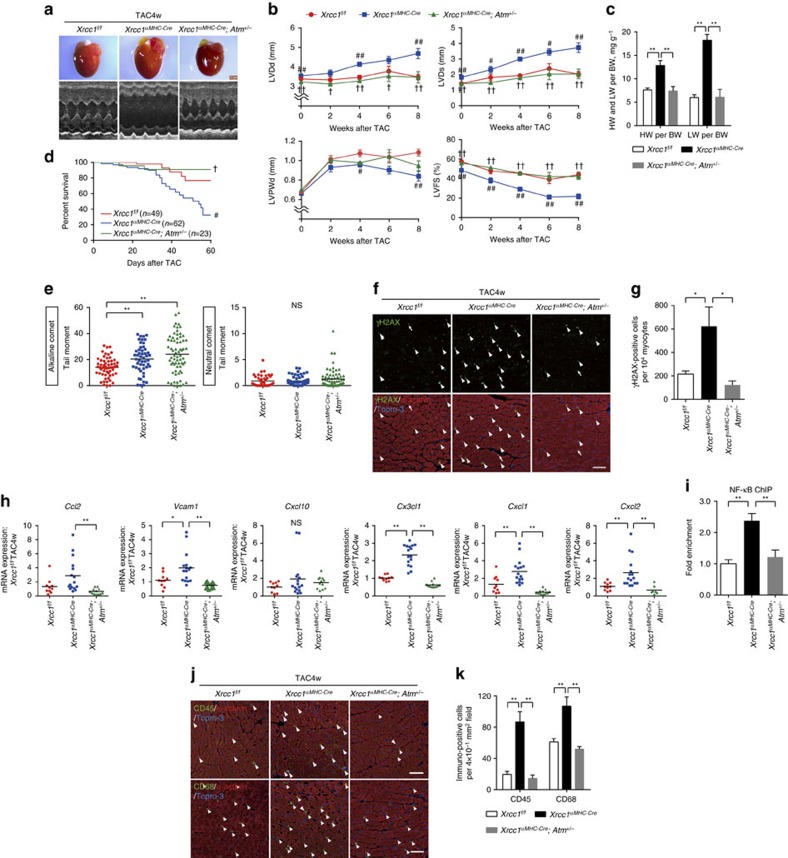
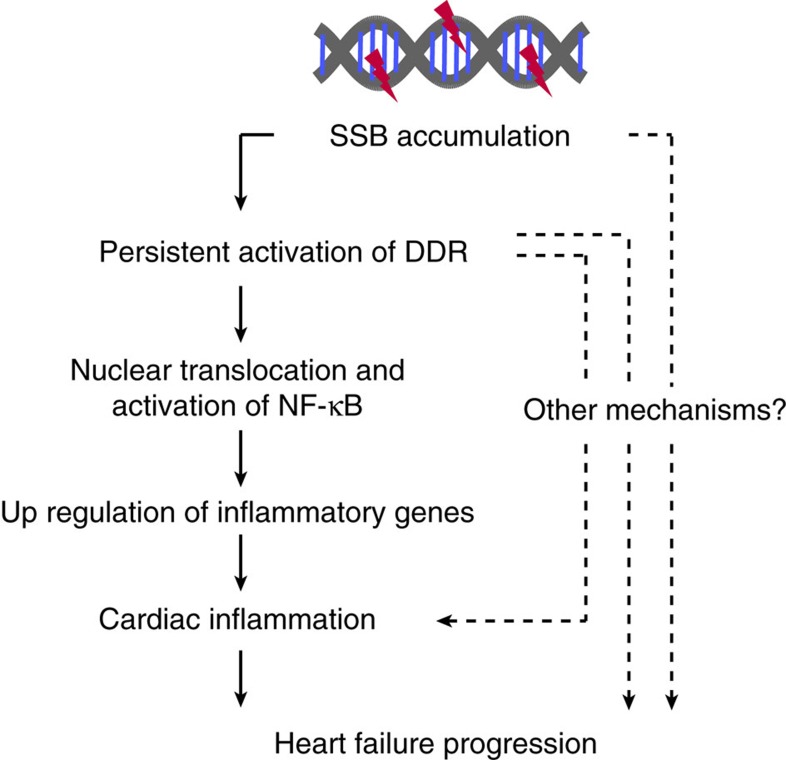
The DNA damage response (DDR) plays a pivotal role in maintaining genome integrity. DNA damage and DDR activation are observed in the failing heart, however, the type of DNA damage and its role in the pathogenesis of heart failure remain elusive. Here we show the critical role of DNA single-strand break (SSB) in the pathogenesis of pressure overload-induced heart failure. Accumulation of unrepaired SSB is observed in cardiomyocytes of the failing heart. Unrepaired SSB activates DDR and increases the expression of inflammatory cytokines through NF-κB signalling. Pressure overload-induced heart failure is more severe in the mice lacking XRCC1, an essential protein for SSB repair, which is rescued by blocking DDR activation through genetic deletion of ATM, suggesting the causative role of SSB accumulation and DDR activation in the pathogenesis of heart failure. Prevention of SSB accumulation or persistent DDR activation may become a new therapeutic strategy against heart failure.


Conflict of interest statement

The authors declare no competing financial interests.

Figures

Figure 1
Figure 1. Accumulation of DNA SSB in the failing heart.
(a,b) Cardiomyocytes were isolated from the TAC-operated heart at the indicated time points. The type of DNA damage in cardiomyocytes was assessed by comet assay. Representative images (a) and quantitative analyses are shown (b, Alkaline comet: n=28, 45, 48; Neutral comet: n=38, 56, 44 at each time point, respectively, biological replicates=3). (c,d) Fragmented DNA and DSB were labelled with ISOL staining (c, green). Wheat germ agglutinin (WGA, red) was used to visualize cardiomyocytes. DNase-treated section (DNase I, 10 Kunitz units ml−1) was used as a positive control. Arrowheads indicate ISOL-positive cardiomyocytes and arrows indicate ISOL-positive non-cardiomyocytes. White scale bar, 50 μm; yellow scale bar, 20 μm. The number of ISOL-positive cardiomyocytes was counted (d, n=4 each). (e,f) Heart tissue sections were immunostained for NBS1 (e, NBS1, green). Immunostaining for alpha-actinin (red) was used to label cardiomyocytes. Scale bar, 50 μm. The number of NBS1-positive cardiomyocytes was counted (f, n=4 each). (g,h) Heart tissue sections were immunostained for poly-ADP ribose (g, PAR, green) and the number of PAR-positive cardiomyocytes was counted (h, n=4, 4, 5 at each time point, respectively). Arrowheads indicate PAR-positive cardiomyocytes and arrows indicate PAR-positive non-cardiomyocytes. White scale bar, 50 μm; yellow scale bar, 20 μm. (i) Expression levels of SSB repair enzymes were analysed by real-time PCR (n=4, 6, 8 at each time point, respectively, technical duplicates). (j,k) Heart tissue sections were stained with dihydroethidium (i, DHE, 10 μΜ) and mean fluorescence intensity relative to Sham-operated mice was measured (k, n=4, 5, 5 at each time point, respectively). Scale bar, 50 μm. (l) The level of H2O2 in the TAC-operated heart was measured using Amplex Red assay (n=9, 5, 6 at each time point, respectively). Statistical significance was determined by Steel-Dwass test for (b) and by one-way analysis of variance followed by the Tukey–Kramer HSD test for (d,f,h,i,j) *P<0.05; **P<0.01 between arbitrary two groups. P<0.05; ††P<0.01 versus Sham. Column and error bars show mean and s.e.m., respectively.
Figure 2
Figure 2. Xrcc1 deficiency increase SSB accumulation and exacerbates heart failure.
(a) Macroscopic and echocardiographic images of Sham- or TAC-operated Xrcc1f/f and Xrcc1αMHC-Cre mice. Scale bar, 2 mm. (b) TAC surgery was performed to Xrcc1f/f and Xrcc1αMHC-Cre mice and cardiac function after the operation was assessed by echocardiogram. LVDd, LV end-diastolic dimension; LVDs, LV end-systolic dimension; LVPWd, LV posterior wall dimension; LVFS, LV fractional shortening (Xrcc1f/f mice: n=80, 22, 30, 11, 10; Xrcc1αMHC-Cre mice: n=85, 28, 40, 13, 9 at each time point, respectively). Statistical significance was determined by Student's t-test at each time point. #P<0.05; ##P<0.01 versus Xrcc1f/f mice. (c) Heart, lung, and body weight of Sham- or TAC-operated Xrcc1f/f and Xrcc1αMHC-Cre mice were weighed 8 weeks after the TAC surgery (n=8, 9, 12, 7, respectively). Statistical significance was determined by one-way analysis of variance followed by the Tukey–Kramer HSD test. *P<0.05; **P<0.01 between arbitrary two groups. (d) Survival curve of Xrcc1f/f and Xrcc1αMHC-Cre mice after the TAC surgery (n=26, 33, respectively). Statistical significance was determined by Wilcoxon test. #P<0.05 versus Xrcc1f/f mice. (e) The type of DNA damage in cardiomyocytes of Sham- or TAC-operated Xrcc1f/f and Xrcc1αMHC-Cre mice was assessed by comet assay (Alkaline comet: n=50, 64, 60, 67; Neutral comet: n=31, 57, 42, 50, respectively). Statistical significance was determined by Steel–Dwass test. **P<0.01 between arbitrary two groups. Column and error bars show mean and s.e.m., respectively.
Figure 3
Figure 3. Generation of an in vitro model of cardiomyocytes with SSB accumulation.
(a) Neonatal rat cardiomyocytes (NRCMs) were treated with MMS at the indicated concentration for 10 min and the DNA damage was analysed by comet assay (Alkaline comet: n=42, 37, 45, 33, 34; Neutral comet: n=40, 35, 35, 37, 29 at each concentration, respectively). Statistical significance was determined by Steel–Dwass test. ##P<0.01 versus Mock. (b) NRCMs were treated with MMS (0.05 mg ml−1 for 10 min) and the DNA damage was analysed by comet assay at the indicated time point (Alkaline comet: n=41, 21, 31, 29, 16, 81, 30; Neutral comet: n=40, 36, 41, 34, 35, 41, 56 at each time point, respectively). (c) Schedule for repetitive MMS treatment. (d) NRCMs were subjected to repetitive MMS treatment as described in c and the DNA damage was analysed by comet assay (Alkaline comet: n=35, 37, 32, 49, 52, 54; Neutral comet: n=47, 54, 55, 38, 68, 45 at each time point, respectively). Statistical significance was determined by Mann-Whitney U test. #P<0.05 and ##P<0.01 versus Mock at each time point. (e,f) NRCMs were transfected with siRNA against Xrcc1 (siXrcc1) or scrambled oligonucleotide (Scramble) as a control. Knockdown efficiency of siRNA against Xrcc1 was examined by real-time PCR and western blotting (e, n=6, 8, technical duplicates). Time-dependent changes of DNA damage after the knockdown of Xrcc1 was assessed by comet assay (f, Alkaline comet: n=52, 76, 38, 37, 34, 39; Neutral comet: n=52, 65, 37, 36, 45, 41 at each time point, respectively). Statistical significance was determined by Mann–Whitney U-test for (e,f) ##P<0.01 versus Scramble at each time point. Column and error bars show mean and s.e.m., respectively.
Figure 4
Figure 4. SSB activates DDR and induce inflammation through NF-κB.
(a) Neonatal rat cardiomyocytes (NRCMs) were treated with MMS (0.05 mg ml−1 for 10 min) or vehicle control (Mock) and activation of DDR was assessed by western blotting against phospho- or total ATM, H2AX and p53 at the indicated time point. Western blotting against GAPDH was used as a loading control. (b) NRCMs were treated with MMS (0.05 mg ml−1 for 10 min) or vehicle alone (Mock) for 3 consecutive days and activation of DDR was assessed as described in a. (c) NRCMs were transfected with siRNA against Xrcc1 (siXrcc1) or scrambled negative control oligonucleotide (Scramble). Four days later, activation of DDR was assessed as described in a. (d–f) NRCMs were transfected with siRNA against Xrcc1 and/or Atm. Expression levels of inflammatory cytokines were assessed by real-time PCR (d, n=6 each, technical duplicates). Nuclear translocation of NF-κB was assessed by immunofluorescence (e, green). The nuclei of the cells were counterstained with TO-PRO-3 iodide 642/661 (blue). Scale bar, 20 μm. Cells with positive nuclear NF-κB staining were counted (f, n=7, 8, 8, 5, respectively). Statistical significance was determined by one-way analysis of variance (ANOVA) followed by the Tukey-Kramer HSD test for (d,f) **P<0.01 between arbitrary two groups. (g) NRCMs were transfected with siRNA against Xrcc1 and treated with NF-κB inhibitor BAY 11-7082 (2 μM) or dimethylsulfoxide as a vehicle control. The expression levels of inflammatory cytokines were analysed by real-time PCR (n=6 each, technical duplicates). Statistical significance was determined by one-way ANOVA followed by the Tukey–Kramer HSD test. **P<0.01 between arbitrary two groups. Column and error bars show mean and s.e.m., respectively.
Figure 5
Figure 5. Xrcc1 deficiency exacerbates cardiac inflammation after pressure overload.
(a,b) Activation of DDR in Sham- or TAC-operated Xrcc1f/f and Xrcc1αMHC-Cre mice was assessed by immunostaining for phosphorylated H2AX (a, γH2AX, green). Immunostaining for alpha-actinin (red) was used to label cardiomyocytes. Arrowheads indicate γH2AX-positive cardiomyocytes and arrows indicate γH2AX-positive non-cardiomyocytes. Scale bar, 50 μm. The number of γH2AX-positive cardiomyocytes was counted (b, n=4 each). Statistical significance was determined by one-way analysis of variance (ANOVA) followed by the Tukey–Kramer HSD test. **P<0.01 between arbitrary two groups. (c) Heart tissue sections were stained with dihydroethidium and mean fluorescence intensity relative to Sham-operated Xrcc1f/f mice was measured (n=5 each). Statistical significance was determined by one-way ANOVA followed by the Tukey–Kramer HSD test. **P<0.01 between arbitrary two groups. (d) ChIP–qPCR analysis of binding of NF-κB to the Vcam1 promoter region in Sham- or TAC-operated Xrcc1f/f and Xrcc1αMHC-Cre mice. Data are presented as fold enrichment relative to Sham-operated Xrcc1f/f mice (n=4, 4, 5, 5, respectively). Statistical significance was determined by one-way ANOVA followed by the Tukey–Kramer HSD test. *P<0.05 between arbitrary two groups. (e) The expression levels of inflammatory cytokines in the isolated cardiomyocytes of Sham- or TAC-operated Xrcc1f/f and Xrcc1αMHC-Cre mice was assessed by real-time PCR (n=18, 18, 18, 28, respectively, technical duplicates). Statistical significance was determined by one-way ANOVA followed by the Tukey-Kramer HSD test. **P<0.01 between arbitrary two groups. (f,g) Heart tissues of Sham- or TAC-operated Xrcc1f/f and Xrcc1αMHC-Cre mice were immunostained for CD45 or CD68 (f, green). Immunostaining for alpha-actinin (red) was used to label cardiomyocytes. Arrowheads indicate CD45- or CD68-positive cells. Scale bar, 50 μm. The number of CD45- and CD68-positive cells was counted (g, n=5 each). Statistical significance was determined by one-way ANOVA followed by the Tukey-Kramer HSD test. **P<0.01 between arbitrary two groups. Column and error bars show mean and s.e.m., respectively.
Figure 6
Figure 6. Basal characters of Xrcc1αMHC-Cre and Xrcc1αMHC-Cre; Atm+/− mice.
(a,b) Echocardiographic images (a) and cardiac function (b) of Xrcc1f/f, Xrcc1αMHC-Cre and Xrcc1αMHC-Cre; Atm+/− mice. Statistical significance was determined by one-way analysis of variance (ANOVA) followed by the Tukey-Kramer HSD test. **P<0.01 between arbitrary two groups. (c) The type of DNA damage in cardiomyocytes of Xrcc1f/f, Xrcc1αMHC-Cre and Xrcc1αMHC-Cre; Atm+/− mice was assessed by comet assay (Alkaline comet: n=50, 76, 77; Neutral comet: n=53, 56, 42, respectively). Statistical significance was determined by Steel-Dwass test. (d,e) Activation of DDR in Xrcc1f/f, Xrcc1αMHC-Cre and Xrcc1αMHC-Cre; Atm+/− mice was assessed by immunostaining for phosphorylated H2AX (d, γH2AX, green, arrowheads). Immunostaining for alpha-actinin (red) was used to label cardiomyocytes. Arrowheads indicate γH2AX-positive cardiomyocytes. Scale bar, 50 μm. The number of γH2AX-positive cardiomyocytes was counted (e, n=4 each). Statistical significance was determined by one-way ANOVA followed by the Tukey-Kramer HSD test. *P<0.05 between arbitrary two groups. (f) The expression levels of inflammatory cytokines in the isolated cardiomyocytes of Xrcc1f/f, Xrcc1αMHC-Cre and Xrcc1αMHC-Cre; Atm+/− mice was assessed by real-time PCR (n=7, 7, 6 for each genotype, respectively, technical duplicates). Statistical significance was determined by one-way ANOVA followed by the Tukey–Kramer HSD test. *P<0.05 between arbitrary two groups. (g,h) Heart tissues of Xrcc1f/f, Xrcc1αMHC-Cre and Xrcc1αMHC-Cre; Atm+/− mice were immunostained for CD45 or CD68 (g, green, arrowheads). Immunostaining for alpha-actinin (red) was used to label cardiomyocytes. Arrowheads indicate CD45- or CD68-positive cells. Scale bar, 50 μm. The number of CD45- and CD68-positive cells was counted (h, n=6, 6, 4 for each genotype, respectively). Statistical significance was determined by one-way ANOVA followed by the Tukey–Kramer HSD test. **P<0.01 between arbitrary two groups. Column and error bars show mean and s.e.m., respectively. LVDd, left ventricular end-diastolic dimension; LVDs, left ventricular end-systolic dimension; LVPWd, left ventricular posterior wall dimension; LVFS, left ventricular fractional shortening (n=83, 88, 23 for each genotype, respectively).
Figure 7
Figure 7. ATM gene deletion rescues the cardiac phenotypes of Xrcc1 deficient mice.
(a,b) Macroscopic and echocardiographic images (a) and cardiac function (b) of TAC-operated Xrcc1f/f, Xrcc1αMHC-Cre and Xrcc1αMHC-Cre; Atm+/− mice (Xrcc1f/fmice: n=83, 21, 46, 11, 27; Xrcc1αMHC-Cre mice: n=88, 28, 60, 13, 16; Xrcc1αMHC-Cre; Atm+/− mice: n=28, 22, 22, 7, 7 at each time point, respectively). Scale bar, 2 mm. (c) Heart, lung, and body weight of TAC-operated Xrcc1f/f, Xrcc1αMHC-Cre and Xrcc1αMHC-Cre; Atm+/− mice were weighed 8 weeks after the surgery (n=8, 5, 6 for each genotype, respectively). (d) Survival curves of TAC-operated Xrcc1f/f, Xrcc1αMHC-Cre and Xrcc1αMHC-Cre; Atm+/− mice (n=49, 62, 23, respectively). (ek) TAC-operated Xrcc1f/f, Xrcc1αMHC-Cre and Xrcc1αMHC-Cre; Atm+/− mice were analysed 4 weeks after the surgery. The type of DNA damage in cardiomyocytes was assessed by comet assay (e, Alkaline comet: n=50, 76, 77; Neutral comet: n=53, 56, 42, respectively). Activation of DDR was assessed by immunostaining for phosphorylated H2AX (f, γH2AX, green, arrowheads). Arrowheads indicate γH2AX-positive cardiomyocytes and arrows indicate γH2AX-positive non-cardiomyocytes. Scale bar, 50 μm. The number of γH2AX-positive cardiomyocytes was counted (g, n=4 each). Expression levels of inflammatory cytokines in the isolated cardiomyocytes were assessed by real-time PCR (h, n=10, 16, 12 for each genotype, respectively, technical duplicates). ChIP–qPCR analysis of binding of NF-κB to the Vcam1 promoter region. Data is presented as fold enrichment relative to TAC-operated Xrcc1f/f mice (i, n=4, 5, 5, respectively). Heart tissues were immunostained for CD45 or CD68 (j, green, arrowheads). Arrowheads indicate CD45- or CD68-positive cells. Scale bar, 50 μm. The number of CD45- and CD68-positive cells was counted (k, n=4 each). Statistical significance was determined by one-way analysis of variance followed by the Tukey–Kramer HSD test for (b) (at each time point), (c,g,h,i,k), by Wilcoxon test for d and by Steel–Dwass test for e, #P<0.05; ##P<0.01 between Xrcc1f/f and Xrcc1αMHC-Cre mice. †P<0.05; ††P<0.01 between Xrcc1αMHC-Cre and Xrcc1αMHC-Cre; Atm+/− mice. *P<0.05; **P<0.01 between arbitrary two groups. Column and error bars show mean and s.e.m., respectively.
Figure 8
Figure 8. Possible roles of SSB accumulation in pathogenesis of heart failure.
Accumulation of DNA SSB in cardiomyocytes induces persistent activation of DDR and subsequent activation of NF-κB pathway, resulting in increased expressions of inflammatory cytokines. These mechanisms may contribute, at least in part, to increased cardiac inflammation and the progression of pressure overload-induced heart failure.

References

    1. Shiloh Y. & Ziv Y. The ATM protein kinase: regulating the cellular response to genotoxic stress, and more. Nat. Rev. Mol. Cell Biol. 14, 197–210 (2013). - PubMed
    1. Sulli G., Di Micco R. & d'Adda di Fagagna F. Crosstalk between chromatin state and DNA damage response in cellular senescence and cancer. Nat. Rev. Cancer 12, 709–720 (2012). - PubMed
    1. Lee J. H. & Paull T. T. Activation and regulation of ATM kinase activity in response to DNA double-strand breaks. Oncogene 26, 7741–7748 (2007). - PubMed
    1. Rodier F. et al.. Persistent DNA damage signalling triggers senescence-associated inflammatory cytokine secretion. Nat. Cell Biol. 11, 973–979 (2009). - PMC - PubMed
    1. Siggens L., Figg N., Bennett M. & Foo R. Nutrient deprivation regulates DNA damage repair in cardiomyocytes via loss of the base-excision repair enzyme OGG1. FASEB J. 26, 2117–2124 (2012). - PMC - PubMed

Publication types