. 2017 Jun 1;127(6):2206-2221.
doi: 10.1172/JCI91363. Epub 2017 Apr 24.

The U2AF1S34F mutation induces lineage-specific splicing alterations in myelodysplastic syndromes

Affiliations

The U2AF1S34F mutation induces lineage-specific splicing alterations in myelodysplastic syndromes

Bon Ham Yip et al. J Clin Invest. .

Erratum in

Abstract

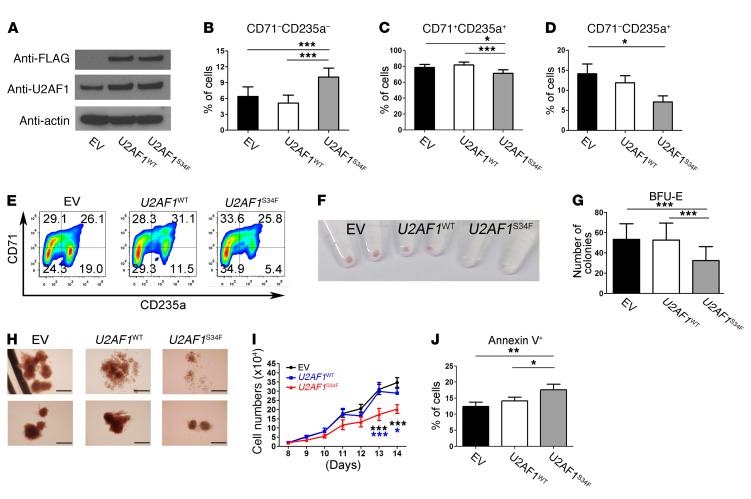
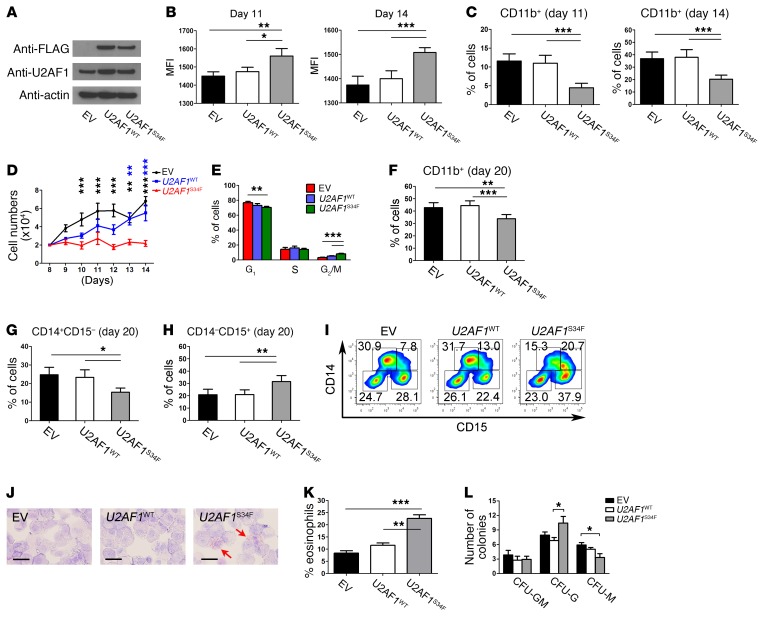
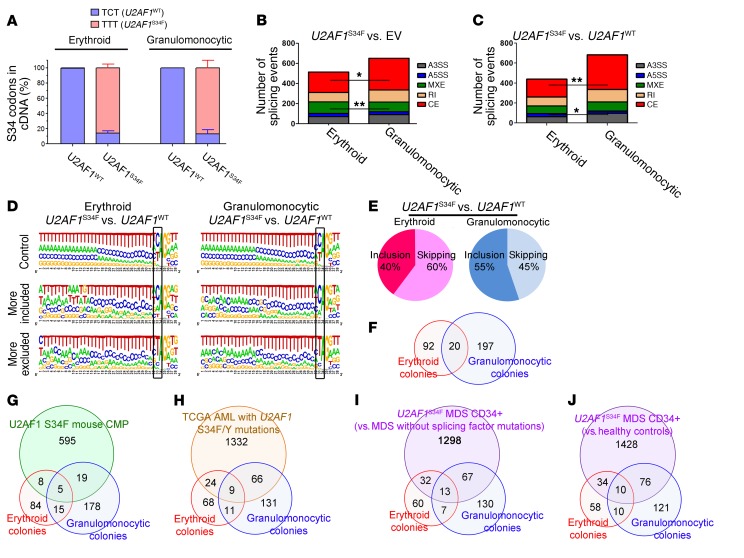
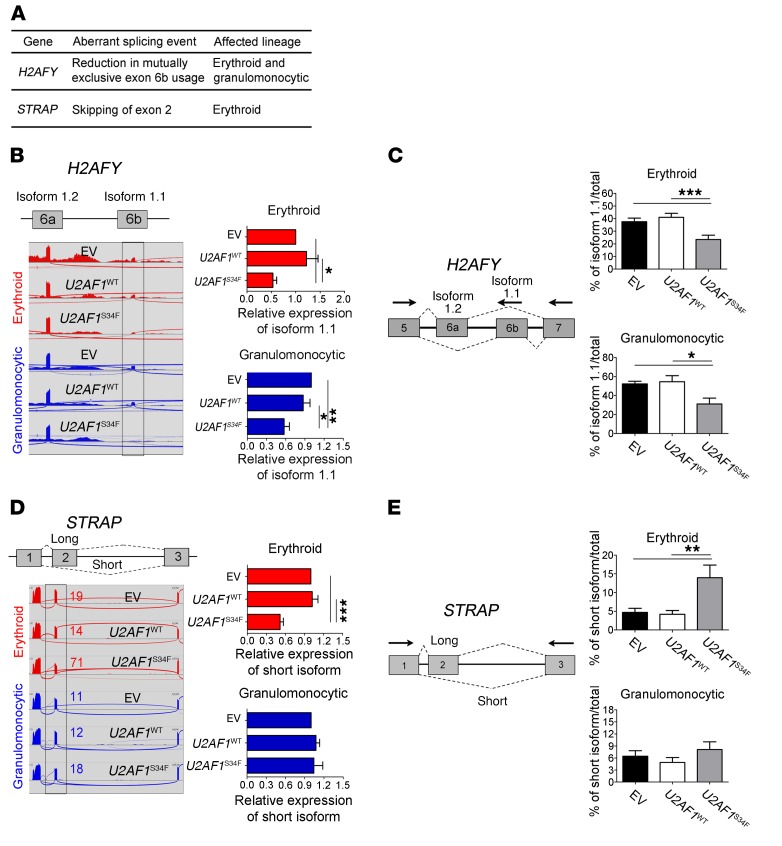
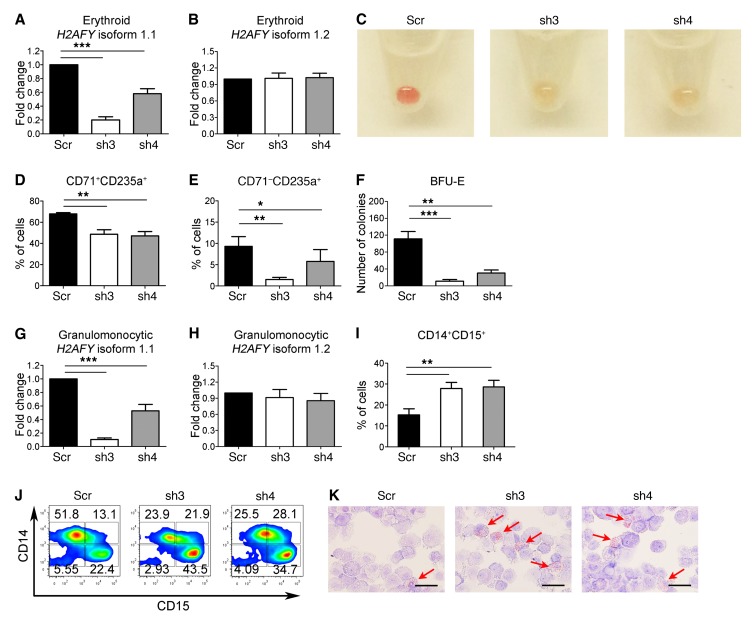
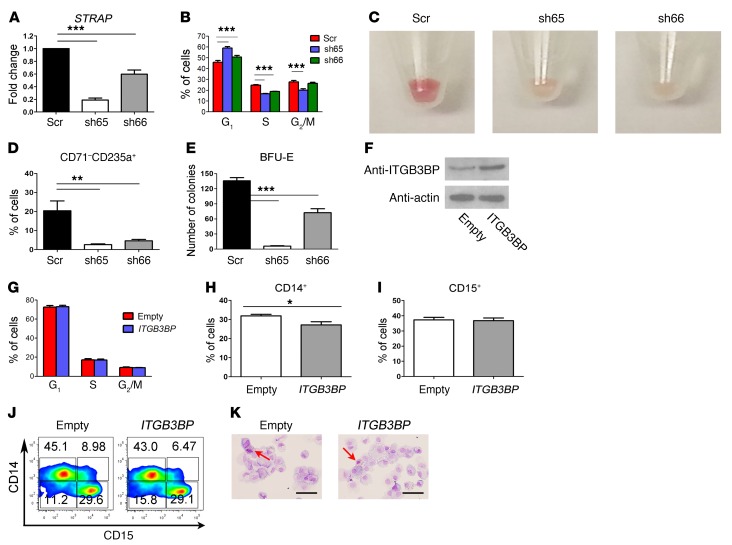
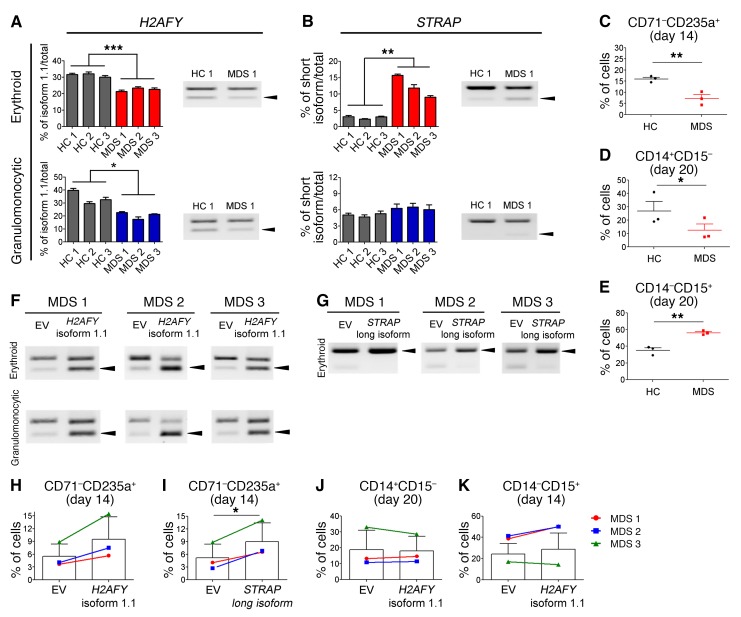
Mutations of the splicing factor-encoding gene U2AF1 are frequent in the myelodysplastic syndromes (MDS), a myeloid malignancy, and other cancers. Patients with MDS suffer from peripheral blood cytopenias, including anemia, and an increasing percentage of bone marrow myeloblasts. We studied the impact of the common U2AF1S34F mutation on cellular function and mRNA splicing in the main cell lineages affected in MDS. We demonstrated that U2AF1S34F expression in human hematopoietic progenitors impairs erythroid differentiation and skews granulomonocytic differentiation toward granulocytes. RNA sequencing of erythroid and granulomonocytic colonies revealed that U2AF1S34F induced a higher number of cassette exon splicing events in granulomonocytic cells than in erythroid cells. U2AF1S34F altered mRNA splicing of many transcripts that were expressed in both cell types in a lineage-specific manner. In hematopoietic progenitors, the introduction of isoform changes identified in the U2AF1S34F target genes H2AFY, encoding an H2A histone variant, and STRAP, encoding serine/threonine kinase receptor-associated protein, recapitulated phenotypes associated with U2AF1S34F expression in erythroid and granulomonocytic cells, suggesting a causal link. Furthermore, we showed that isoform modulation of H2AFY and STRAP rescues the erythroid differentiation defect in U2AF1S34F MDS cells, suggesting that splicing modulators could be used therapeutically. These data have critical implications for understanding MDS phenotypic heterogeneity and support the development of therapies targeting splicing abnormalities.


Conflict of interest statement

Conflict of interest: The authors have declared that no conflict of interest exists

Figures

Figure 1
Figure 1. Expression of U2AF1S34F impairs erythroid differentiation.
(A) Western blots showing expression levels of U2AF1S34F and U2AF1WT protein in transduced erythroid cells harvested on day 11. An anti-U2AF1 antibody was used to measure total U2AF1 protein, while an anti-FLAG antibody was used to measure the exogenous U2AF1S34F or U2AF1WT protein produced by the vector. (BD) Erythroid differentiation was measured by flow cytometry using expression of CD71 and CD235a cell-surface markers. (B) Nonerythroid (CD71CD235a) and (C) intermediate erythroid (CD71+CD235a+) cell populations on day 11 of culture and (D) late erythroid (CD71CD235a+) cell population on day 14 of culture. (E) Representative flow cytometric plots showing impaired erythroid differentiation on day 14 (n = 8). (F) Image of erythroid cell pellets on day 14 of culture for visual determination of hemoglobinization (n = 8). (G) Number of BFU-E colonies obtained from hematopoietic CD34+ progenitors transduced with EV, U2AF1WT, or U2AF1S34F after 14 days in methylcellulose (colony-forming cell assays). (H) Representative images of BFU-E colonies produced from hematopoietic CD34+ progenitors transduced with EV, U2AF1WT, or U2AF1S34F, respectively (n = 7). Scale bars: 100 μm. (I) Cell counts for U2AF1S34F erythroid cells from day 8 to day 14 of culture compared with counts for EV and U2AF1WT controls. (J) Apoptosis as measured by annexin V staining and flow cytometry in erythroblasts harvested on day 11 of culture. Results shown in panels BD were obtained from 8 independent experiments, those shown in panels G and I were obtained from 7 independent experiments, and results shown in panel J were obtained from 6 independent experiments. Data represent the mean ± SEM. P values in panels BD, G, and J were calculated by repeated-measures 1-way ANOVA with Tukey’s post-hoc test. P values in panel I were calculated by 2-way ANOVA with Bonferroni’s post test. *P < 0.05, **P < 0.01, and ***P < 0.001.
Figure 2
Figure 2. Expression of U2AF1S34F skews granulomonocytic differentiation toward granulocytes.
(A) Expression levels of U2AF1S34F and U2AF1WT protein in transduced granulomonocytic cells on day 11. Anti-U2AF1 and anti-FLAG antibodies were used to measure total U2AF1 protein and exogenous U2AF1S34F or U2AF1WT protein produced by the vector, respectively. (B) Median fluorescence intensity (MFI) of forward scatter (an indication of cell size) of granulomonocytic cells on days 11 and 14. (C) Percentage of CD11b+ cells in granulomonocytic cultures on days 11 and 14. (D) Cell counts for U2AF1S34F granulomonocytic cells from day 8 (the day when Geneticin selection was complete) to day 14 compared with EV and U2AF1WT controls. (E) Cell-cycle analysis of granulomonocytic cells on day 11. (F) Percentage of CD11b+ cells in granulomonocytic cultures on day 20. (G and H) Percentages of (G) CD14+CD15 monocytic cells and (H) CD14CD15+ granulocytic cells in granulomonocytic cultures on day 20. (I) Representative flow cytometric plots on day 20 (n = 7). (J) Representative images of May-Grünwald-Giemsa–stained granulomonocytic cells on day 20 (n = 7). The red arrows indicate eosinophils. Scale bars: 25 μm. (K) Percentage of eosinophils per 100 cells on day 20. (L) Number of CFU granulocytes-macrophages (CFU-GM), CFU granulocytes (CFU-G), and CFU macrophages (CFU-M) obtained from hematopoietic CD34+ progenitors transduced with EV, U2AF1WT, or U2AF1S34F after 14 days in methylcellulose. Results shown in panels BH, K, and L were obtained from 6, 8, 7, 6, 7, 7, 7, 6, and 7 independent experiments, respectively. Data represent the mean ± SEM. P values in panels B, C, EH, K and L were calculated by repeated-measures 1-way ANOVA with Tukey’s post-hoc test. P values in panel D were calculated by 2-way ANOVA with Bonferroni’s post test. *P < 0.05, **P < 0.01, and ***P < 0.001.
Figure 3
Figure 3. U2AF1S34F differentially alters splicing of target genes in erythroid and granulomonocytic colonies.
(A) Quantification of U2AF1 WT (TCT) and S34F mutant (TTT) mRNA in erythroid and granulomonocytic colonies, determined by pyrosequencing. (B and C) Aberrant splicing events associated with U2AF1S34F, including breakdown by event type, in erythroid and granulomonocytic colonies for (B) U2AF1S34F versus EV and (C) U2AF1S34F versus U2AF1WT. (D) Sequence logos for 3′ splice sites of cassette exons that were unaffected (top row), more included (middle row), or more skipped (bottom row) in response to U2AF1S34F compared with U2AF1WT. (E) Distribution of exon inclusion and skipping events within the total number of regulated cassette exon events in the comparison of U2AF1S34F versus U2AF1WT in erythroid and granulomonocytic colonies. (F) Venn diagram showing the overlap among the genes that contained aberrant splicing events induced by U2AF1S34F in erythroid and granulomonocytic colonies in our study. (GJ) Venn diagrams showing the overlap among the genes that contained aberrant splicing events induced by U2AF1S34F in different RNA-seq data sets: (G) transgenic mouse CMPs expressing U2AF1S34F and erythroid colonies and granulomonocytic colonies in our study; (H) TCGA AML patient samples with U2AF1 S34 mutations and erythroid colonies and granulomonocytic colonies in our study; (I) U2AF1S34F MDS CD34+ bone marrow cells (versus MDS cases without splicing factor gene mutations) and erythroid colonies and granulomonocytic colonies in our study; and (J) U2AF1S34F MDS CD34+ bone marrow cells (versus healthy controls) and erythroid colonies and granulomonocytic colonies in our study. Results in panel A are shown as the mean ± SEM and were obtained from 3 independent experiments. P values in panel B and C were calculated by Fisher’s exact test with Bonferroni’s correction. *P < 0.05 and **P < 0.01. A3SS, alternative 3′ splice site; A5SS, alternative 5′ splice site; MXE, mutually exclusive exon; RI, retained intron; SE, skipped (cassette) exon.
Figure 4
Figure 4. Confirmation of lineage-specific splicing alterations in U2AF1S34F erythroid and granulomonocytic cells.
(A) Genes of interest (H2AFY and STRAP) that exhibited differential aberrant splicing between U2AF1S34F erythroid and granulomonocytic colonies. (B and C) Mutually exclusive exons in H2AFY measured by (B) isoform-specific qRT-PCR and confirmed by (C) RT-PCR and gel electrophoresis. (D and E) Exon skipping in STRAP measured by (D) isoform-specific qRT-PCR and confirmed by (E) RT-PCR and gel electrophoresis. In panels B and D, sashimi plots illustrate RNA-seq results for H2AFY and STRAP in erythroid and granulomonocytic colonies. For each gene, the region affected by aberrant splicing is shown, and the aberrant splicing event is highlighted in gray. In panel D, the qRT-PCR was specific for the long STRAP isoform, as it was not possible to design a qRT-PCR specific for the short isoform (as there are no unique exons that are specific for the short isoform). The decrease in expression levels of the long STRAP isoform observed in U2AF1S34F erythroid cells is due to the aberrant splicing, which removes exon 2 from the long isoform, resulting in the generation of the short isoform and a concomitant depletion of the long isoform. Expression of the isoform associated with aberrant splicing by U2AF1S34F in transduced cells was measured by isoform-specific qRT-PCR relative to U2AF1WT and EV controls (red bars: erythroid cells; blue bars: granulomonocytic cells). In panels C and E, quantification of altered splicing events in gel was performed using ImageJ. Results for each bar graph were obtained from 5 independent experiments in panels BE. Data represent the mean ± SEM. P values in panels BE were calculated by repeated-measures 1-way ANOVA with Tukey’s post-hoc test. *P < 0.05 and **P < 0.01.
Figure 5
Figure 5. Knockdown of H2AFY isoform 1.1 perturbs erythroid and granulomonocytic differentiation.
(A and B) Expression levels of H2AFY (A) isoform 1.1 and (B) isoform 1.2 were determined using isoform-specific qRT-PCR in erythroid cells with H2AFY isoform 1.1 knockdown. (C) Images of erythroid cell pellets on day 14 of culture for visual determination of hemoglobinization (n = 6). (D and E) Erythroid differentiation measured by expression of CD71 and CD235a cell-surface markers using flow cytometry. (D) Intermediate erythroid (CD71+CD235a+) cell population on day 11 of culture and (E) late erythroid (CD71CD235a+) cell population on day 14 of culture. (F) Number of BFU-E obtained from hematopoietic CD34+ progenitors with H2AFY isoform 1.1 knockdown after 14 days in methylcellulose (colony-forming cell assays). (G and H) Expression levels of H2AFY (G) isoform 1.1 and (H) isoform 1.2 determined using isoform-specific qRT-PCR in granulomonocytic cells with H2AFY isoform 1.1 knockdown. (I) Percentage of CD14+CD15+ cells in granulomonocytic cultures on day 20 of culture. (J) Representative flow cytometric contour plots showing expression of CD14 and CD15 on day 20 of culture (n = 8). (K) Representative images of May-Grünwald-Giemsa–stained granulomonocytic cells on day 20 of culture (n = 8). The red arrows indicate eosinophils. Scale bars: 25 μm. Results in each bar graph were obtained from 6 independent experiments for panels A, B, and DH, and from 8 independent experiments for panel I. Data represent the mean ± SEM. P values in panels A, B, and DI were calculated by repeated-measures 1-way ANOVA with Tukey’s post-hoc test. *P < 0.05, **P < 0.01, and ***P < 0.001. Scr, scramble; sh3, shRNA 3; sh4, shRNA 4.
Figure 6
Figure 6. Knockdown of STRAP impairs erythroid differentiation, and overexpression of ITGB3BP is dispensable for granulomonocytic differentiation.
(A) Expression levels of STRAP determined using qRT-PCR in erythroid cells with STRAP knockdown. (B) Cell-cycle analysis of erythroid cells on day 11 of culture. (C) Images of erythroid cell pellets on day 14 of culture for visual determination of hemoglobinization (n = 6). (D) Percentage of late erythroid (CD71CD235a+) cells on day 14 of culture. (E) Number of BFU-E obtained from hematopoietic CD34+ progenitors with STRAP knockdown after 14 days in methylcellulose (colony-forming cell assays). (F) Western blots showing the expression levels of the ITGB3BP protein in granulomonocytic cells with ITGB3BP overexpression. (G) Cell-cycle analysis of granulomonocytic cells on day 11 of culture. (H) Percentage of CD14+ cells in granulomonocytic cultures on day 20 of culture. (I) Percentage of CD15+ cells in granulomonocytic cultures on day 20 of culture. (J) Representative flow cytometric contour plots (from 6 independent experiments) showing expression of CD14 and CD15 on day 20 of culture. (K) Representative images of May-Grünwald-Giemsa–stained granulomonocytic cells on day 20 of culture (n = 6). The red arrows indicate eosinophils. Scale bars: 25 μm. Results in each bar graph in panels A, B, D, E, and GI were obtained from 6 independent experiments. Data represent the mean ± SEM. P values in panels A, B, D, and E were calculated by repeated-measures 1-way ANOVA with Tukey’s post-hoc test. P values in panels H and I were calculated by a paired, 2-tailed t test. *P < 0.05, **P < 0.01, and ***P < 0.001.
Figure 7
Figure 7. Effects of H2AFY isoform 1.1 and STRAP long isoform overexpression on erythroid and granulomonocytic differentiation in hematopoietic progenitors from U2AF1S34F MDS patients.
(A) H2AFY isoform 1.1 ratio in U2AF1S34F MDS–differentiated erythroblasts and granulomonocytic cells (day 7 in culture) compared with that in healthy controls (HC). Arrowheads in blot indicate H2AFY isoform 1.1. (B) STRAP short isoform ratio in U2AF1S34F MDS–differentiated erythroblasts (day 7 in culture) compared with healthy controls. Arrowheads in blot indicate the STRAP short isoform. (CE) Impaired erythropoiesis and skewed differentiation toward granulocytes in U2AF1S34F MDS hematopoietic progenitors compared with healthy controls. (C) Late erythroid (CD71CD235a+) cell population on day 14 of culture and (D) monocytic (CD14+CD15) and (E) granulocytic (CD14CD15+) cell populations on day 20 of culture were measured by flow cytometry. (F and G) Overexpression of (F) H2AFY isoform 1.1 and (G) STRAP long isoform in U2AF1S34F MDS hematopoietic progenitors differentiating toward erythroid and granulomonocytic lineages. Arrowheads in blots indicate H2AFY isoform 1.1 or the STRAP short isoform. (HK) Effects of H2AFY isoform 1.1 and STRAP long isoform overexpression on erythroid and granulomonocytic differentiation of U2AF1S34F MDS hematopoietic progenitors. Late erythroid (CD71CD235a+) cell population in transduced erythroblasts expressing H2AFY isoform 1.1 (H) or the STRAP long isoform (I), measured by flow cytometry on day 14 of culture compared with the EV control. (J) Monocytic (CD14+CD15) and (K) granulocytic (CD14CD15+) cell populations in transduced granulomonocytic cells expressing H2AFY isoform 1.1 were measured by flow cytometry on day 20 of culture compared with the EV control. In panels A and B, quantification of altered splicing events in gel was performed using ImageJ. Bar graph results in A and B were obtained from 4 technical replicates. Data represent the mean ± SEM. P values in panels AE were calculated by an unpaired, 2-tailed t test. P values in panels HK were calculated by a paired, 2-tailed t test. *P < 0.05, **P < 0.01, and ***P < 0.001.

References

    1. Cazzola M, Della Porta MG, Malcovati L. The genetic basis of myelodysplasia and its clinical relevance. Blood. 2013;122(25):4021–4034. doi: 10.1182/blood-2013-09-381665. - DOI - PMC - PubMed
    1. Greenberg PL, et al. Revised international prognostic scoring system for myelodysplastic syndromes. Blood. 2012;120(12):2454–2465. doi: 10.1182/blood-2012-03-420489. - DOI - PMC - PubMed
    1. Pellagatti A, Boultwood J. The molecular pathogenesis of the myelodysplastic syndromes. Eur J Haematol. 2015;95(1):3–15. doi: 10.1111/ejh.12515. - DOI - PubMed
    1. Vardiman JW, et al. The 2008 revision of the World Health Organization (WHO) classification of myeloid neoplasms and acute leukemia: rationale and important changes. Blood. 2009;114(5):937–951. doi: 10.1182/blood-2009-03-209262. - DOI - PubMed
    1. Papaemmanuil E, et al. Clinical and biological implications of driver mutations in myelodysplastic syndromes. Blood. 2013;122(22):3616–3627. doi: 10.1182/blood-2013-08-518886. - DOI - PMC - PubMed