. 2017 Jun;18(6):642-653.
doi: 10.1038/ni.3734. Epub 2017 Apr 24.

Vitamin A mediates conversion of monocyte-derived macrophages into tissue-resident macrophages during alternative activation

Affiliations

Vitamin A mediates conversion of monocyte-derived macrophages into tissue-resident macrophages during alternative activation

Uma Mahesh Gundra et al. Nat Immunol. 2017 Jun.

Abstract

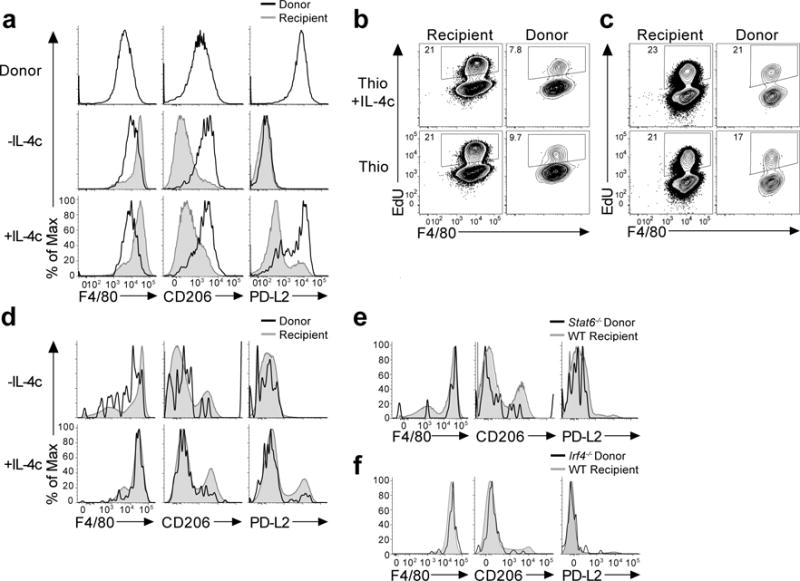
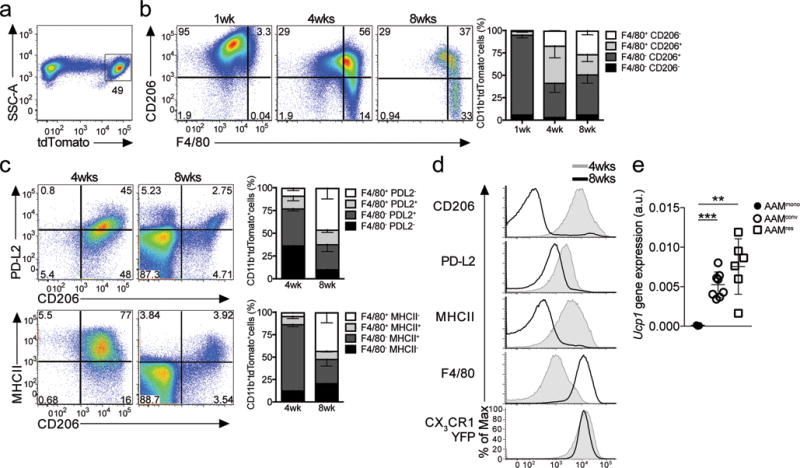
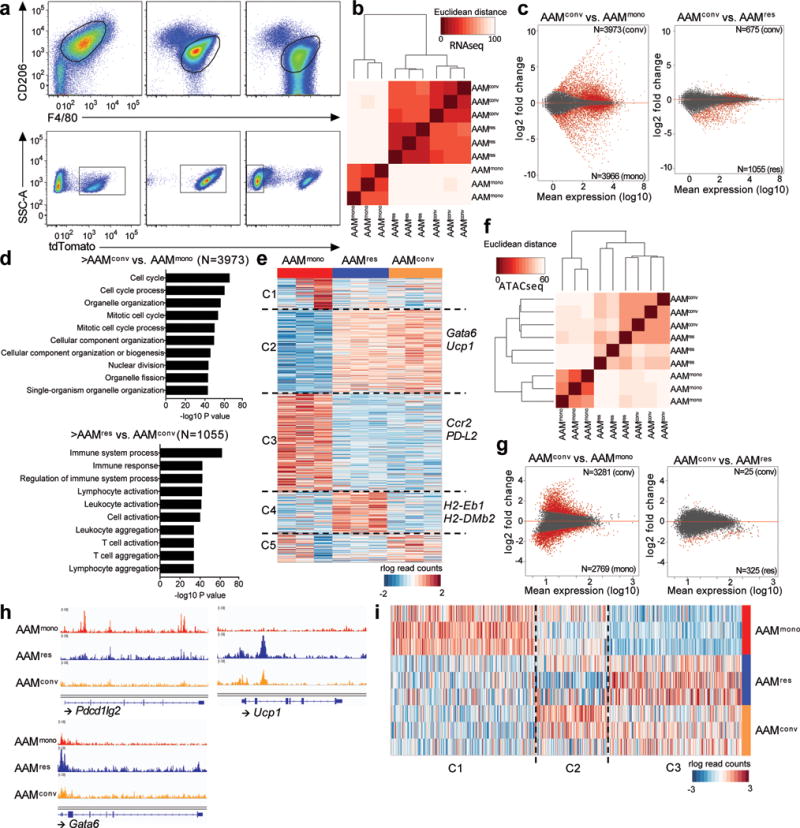
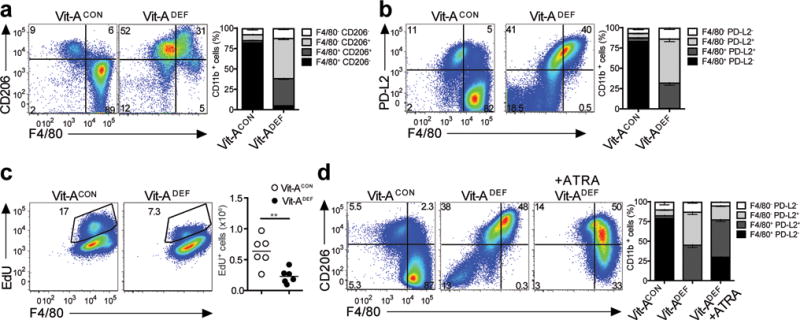
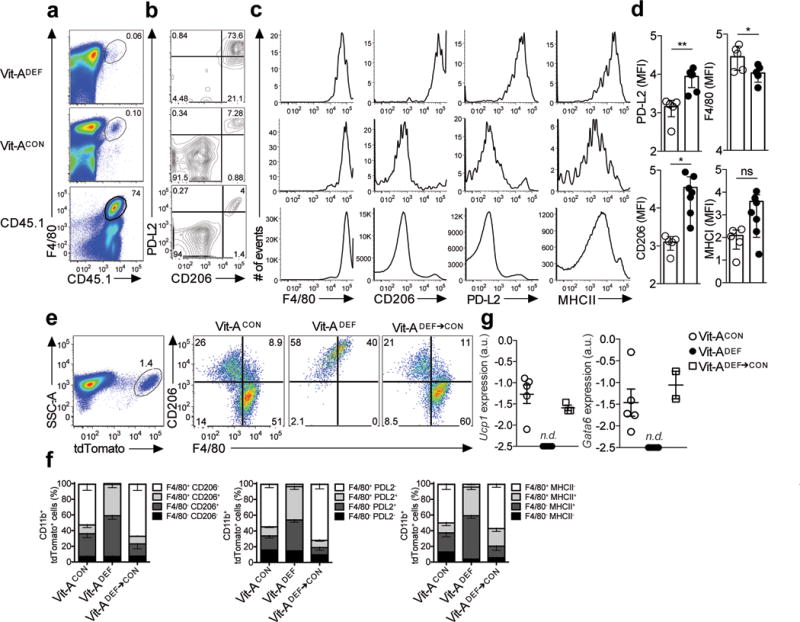
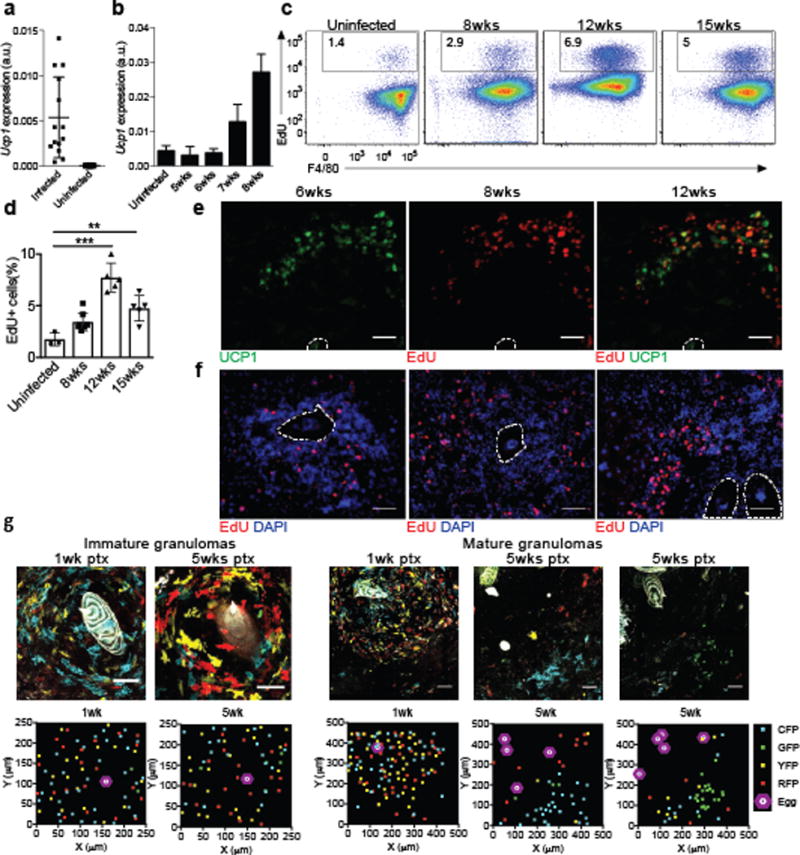
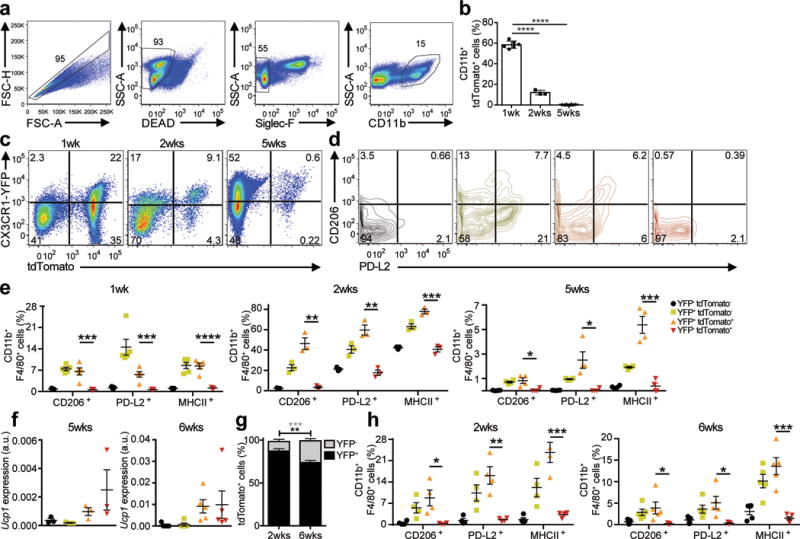
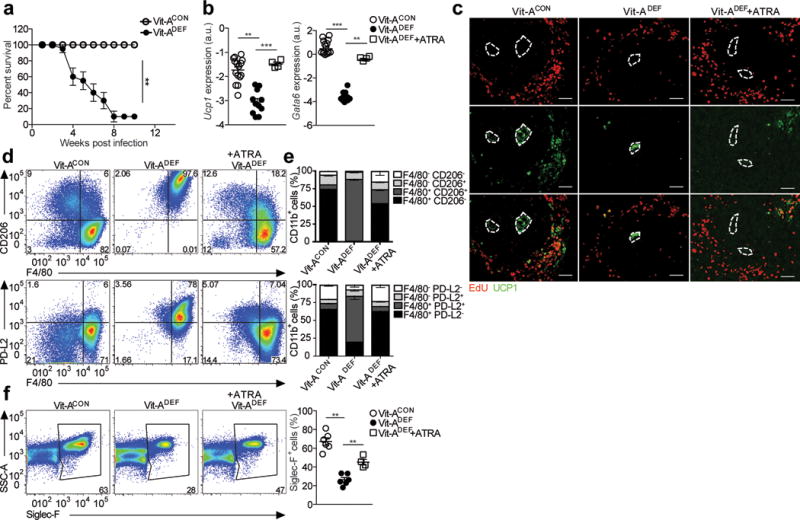
It remains unclear whether activated inflammatory macrophages can adopt features of tissue-resident macrophages, or what mechanisms might mediate such a phenotypic conversion. Here we show that vitamin A is required for the phenotypic conversion of interleukin 4 (IL-4)-activated monocyte-derived F4/80intCD206+PD-L2+MHCII+ macrophages into macrophages with a tissue-resident F4/80hiCD206-PD-L2-MHCII-UCP1+ phenotype in the peritoneal cavity of mice and during the formation of liver granulomas in mice infected with Schistosoma mansoni. The phenotypic conversion of F4/80intCD206+ macrophages into F4/80hiCD206- macrophages was associated with almost complete remodeling of the chromatin landscape, as well as alteration of the transcriptional profiles. Vitamin A-deficient mice infected with S. mansoni had disrupted liver granuloma architecture and increased mortality, which indicates that failure to convert macrophages from the F4/80intCD206+ phenotype to F4/80hiCD206- may lead to dysregulated inflammation during helminth infection.


Conflict of interest statement

COMPETING FINANCIAL INTERESTS

The authors declare that there are no conflicts of interest.

Figures

Figure 1
Figure 1. Monocyte-derived inflammatory macrophages adopt a tissue resident phenotype after long-term residency in the peritoneal cavity
(a) PD-L2 is rapidly downregulated while CD206 expression is retained on AAMmono. Adoptive transfer i.p.of thioglycollate + IL-4c elicited monocyte-derived macrophages from CD45.1 donor mice into CD45.2 recipient mice, rested for 24hrs and then treated +/- IL-4c prior to analysis. Representative FACS plots displaying expression of CD206, PD-L2, and F4/80 on Thio+IL-4c macrophages before transfer and gated on recipient (grey) or donor (blue) cells from recipient mice treated +/− IL-4c, 8 weeks after transfer. Representative histograms display surface expression of F4/80, CD206, PD-L2 in Donor CD45.1+ CD45.2 (Black line) and recipient CD45.1, CD45.2+ (Grey shaded) CD11b+, F4/80+ macrophages. (b) Long-term transfer of monocyte-derived inflammatory macrophages from CD45.1 donor mice treated with either thioglycollate or thioglycollate and IL-4c, into CD45.2 recipient mice and rested for 8 weeks prior to treatment with +/- IL- 4c. Representative histograms of CD206, PD-L2, and F4/80 expression on donor and recipient CD11b+ macrophages. (c-d) Increased proliferative capacity of macrophages after long-term residency. Representative FACS plots showing the frequency of EdU+ cells in recipient (Rec) and donor (Don) populations in response to IL-4c given after transfer of thioglycollate elicited (Thio) or (Thio+IL-4c) elicited macrophages and resting for 24hrs for short term residency (c) or long term residency for 8 weeks (d). (e) STAT6 is not required for conversion to a tissue resident phenotype. Representative expression of F4/80, CD206 and PD-L2 on donor CD45.2+ CD45.1Stat6−/− (Black) and CD45.1+ CD45.2 WT recipient (Grey shaded) CD11b+ cells. (f) IRF4 is not required for conversion to a tissue resident phenotype. Expression of F4/80, CD206, PD-L2 in donor CD45.2+ CD45.1 (Black) and recipient CD45.2, CD45.1+ (Grey shaded) CD11b+ cells.
Figure 2
Figure 2. Fate mapping monocyte derived macrophages adopting a tissue resident phenotype after long-term residency in the peritoneal cavity
(a) Tamoxifen (TAM) pulse-administration and IL-4c treatment (i.p.) in Cx3cr1CreERT2-IRESYFP/+Rosa26floxed-tdTomato/+ mice previously injected with thioglycollate at 1 week (n=4), 4 weeks (n=4) or 8 weeks (n=4) post-tamoxifen gavage. (a–c) Representative flow cytometric analysis of CD206 (a) or PD-L2 or MHCII (b) and F4/80 expression on (singlet, live, Siglec-F) CD11b+ tdTomato+ cells (a) from Cx3cr1CreERT2-IRESYFP/+ Rosa26floxed-tdTomato/+ mice injected with thioglycollate + IL- 4c and analyzed at 1, 4, and 8 weeks post-tamoxifen gavage. (a) Stacked bar graph showing the relative proportion of F4/80 and/or CD206 expression (a) in CD11b+ tdTomato+ cells, or (c–d) F4/80 and/or PDL2/MHCII expression. (c) Representative flow cytometry plots of PD-L2, CD206 and MHCII expression in CD11b+ tdTomato+ cells after IL-4c treatment in Cx3cr1CreERT2-IRESYFP/+Rosa26floxed- tdTomato/+ mice pulsed with TAM and injected with thioglycollate 4 weeks (n=6) or 8 weeks (n=3) prior. (d) Converted macrophages (AAMconv) gain expression of UCP1. Expression of UCP1 by RT-PCR on FACS sorted in CD11b+ tdTomato+CD206+F4/80int 4 days after Thio+IL-4c treatment (AAMmono; n=3), relative to CD11b+ tdTomatoCD206F4/80high cells from naïve Cx3cr1CreERT2-IRESYFP/+Rosa26floxed- tdTomato/+ mice treated with IL-4c only (AAMres; n=6) and CD11b+ tdTomato+ CD206F4/80high cells 8 weeks post thioglycollate treatment (AAMconv; n=8).
Figure 3
Figure 3. Transcriptional and chromatin landscape re-programming during macrophage conversion
(a) Representative flow plots showing gating strategies for three different populations of macrophages (AAMmono: n=3, AAMres: n=3, AAMconv, n=3). (b) Pairwise Euclidean distance with respect to the transcriptional profiles from each sample showing AAMconv transcriptionally resembles AAMres. (c) MA plots of differential analyses comparing the transcriptional profiles of AAMconv to that of AAMmono and AAMres, respectively. Differential genes (FDR 10%, |LFC| > 0) are highlighted in red. (d) GO analysis of genes upregulated in AAMconv when compared to AAMmono (top), as well as genes downregulated in AAMconv when compared to AAMres (bottom). (e) Clustering of rlog-transformed read counts of expressed genes in AAMmono, AAMres and AAMconv showing 5 different clusters of genes (C1–C5). (f) Pairwise Euclidean distance with respect to the accessible REs from each sample showing the open chromatin landscape in AAMconv resembles that of AAMres. (g) MA plots of differential analyses comparing the accessible Res in AAMconv to that of AAMmono and AAMres, respectively. Differential regions (FDR 10%, |LFC| > 0) are highlighted in red. (h) Genome browser views of the Pdcd1lg2 (PDL2), Ucp1 and Gata6 gene bodies in AAMmono (red track), AAMconv (blue track) and AAMres (orange track). Each track represents normalized read counts of accessible chromatin regions. (i) Clustering of rlog-transformed read counts of accessible REs in AAMmono, AAMres and AAMconv showing 3 different clusters of REs (C1–C3).
Figure 4
Figure 4. Vitamin A deficiency disrupts tissue resident macrophages
Peritoneal macrophages were evaluated from either vitamin A deficient (Vit-ADEF) mice or control (Vit-ACON) mice after treatment with IL-4c or without treatment. Representative FACS plots for (a) Flow cytometry analysis of peritoneal macrophage Vit-ADEF(n=7) and Vit-ACON(n=7) mice. Stacked bar graph shows increased frequencies of F4/80+ CD206+and F4/80+ CD206expressing CD11b+populations; and (b) Flow cytometry analysis of peritoneal macrophages from Vit-ADEF(n=5) and Vit-ACON(n=5) mice. Stacked bar graph shows increased frequencies PD-L2 and F4/80 expression. (c) EdU incorporation from peritoneal macrophages of IL-4c treatedVit-ADEF(n=8) and Vit-ACON(n=6) mice. (d) Vit-ADEFmice were treated with all-trans RA every 2 days for 14 days prior to IL-4c treatment. Representative FACS plots of PD-L2 expression in peritoneal macrophages of Vit-ACON(n=5), Vit-ADEF(n=5), and Vit-ADEFmice treated with all-trans RA (ATRA) (n=5). Stacked bar graph indicates frequencies of F4/80 and PD-L2 in CD11b+ cells. **P < 0.01. Unpaired Students T-test.
Figure 5
Figure 5. Phenotypic conversion of inflammatory macrophages to a tissue resident phenotype is disrupted in Vitamin A-deficient mice
(a) Long-term transfer of monocyte-derived inflammatory macrophages from thioglycollate treated CD45.1 donor mice into CD45.2 recipient vitamin A deficient (Vit-ADEF) mice or control (Vit-ACON) mice, rested for 8 weeks and subsequently treated with IL-4c. Naïve CD45.1 mice were also treated with IL-4c (a) Representative FACS plots of F4/80+ CD45.1+ events and (b) PD-L2 and CD206 expression in CD45.1 cells after 8 weeks post reconstitution in Vit-ACON(n=5) or Vit-ADEF(n=5) mice. (c) Flow cytometry analysis of mean fluorescence intensity for F4/80, CD206, PD-L2 and MHCII in CD45.1 peritoneal macrophages. (d) Quantification of mean fluorescence intensities of F4/80, CD206, PD-L2 and MHCII in CD45.1 macrophages from Vit-ACON(n=5) or Vit-ADEF (n=7) mice. (e) Representative flow cytometry plots of CD206 and F4/80 frequencies in tdTomato+ peritoneal macrophages from Vit-ACON(n=9), Vit-ADEF(n=9) or Vit-ADEF mice switched onto Vit-ACON diet (Vit-ADEF→CON;n=3). (f) Stacked bar graph represents frequencies of F4/80 and CD206 from CD11b+ tdTomato+ cells. (g) RT-PCR analysis of Ucp1 and Gata6 expression in CD11b+ tdTomato+ peritoneal macrophages from (e) normalized to expression of GAPDH. Graphs depict mean ± standard error of the mean of individual mice pooled from 2 independent experiments. Data shown are the mean and s.e.m. ns = not significant, *P<0.05, ***P<0.001 unpaired Students T-test.
Figure 6
Figure 6. Increased Ucp1 expression and proliferation in mature egg liver granulomas of S. mansoni infected mice
(a) Transcript expression of Ucp1 in whole liver from mice infected with S. mansoni at 8 weeks post infection (b) Time course of Ucp1 expression in the liver during S. mansoni infection. (c) Flow cytometric analysis showing the frequency of EdU+ F4/80+ cells from S. mansoni infected liver at the indicated time point. (d) Quantification of EdU+ F4/80+ cells at different time points during S. mansoni infection. (e) Representative immunofluorescence images of S. mansoni-infected liver mature granulomas stained with anti-UCP1 (green), and Click-it EdU (red). (f) Representative immunofluorescence images of S. mansoni-infected liver granulomas at different timepoints post infection stained with DAPI (blue) and Click-it EdU (red) taken from mice pulsed with EdU 3 hours prior to sacrifice. Eggs are outlined in white and scale bars represent 50 microns. (g) TAM pulse experiments with Cx3cr1CreERT2-IRESYFP/+Rosa26Brainbow2.1/+ mice infected with S. mansoni. Confocal images of immature granulomas (left) or mature granulomas (right) from livers of Cx3cr1CreERT2-IRESYFP/+Rosa26Brainbow2.1/+ mice infected with S. mansoni at 12 weeks post-infection given tamoxifen 1 week or 5 weeks prior to the sac. Scale bars = 50μm. XY scatter plots represent approximate localization of Brainbow2.1 fluorescent cells within above image. **P<0.01, ***P<0.001, unpaired Students T test.
Figure 7
Figure 7. Fate mapping monocyte-derived macrophages in the liver granulomas of S. mansoni infected mice
(a) TAM pulse administration via oral gavage in the S. mansoni infected Cx3cr1CreER-IRESYFP/+Rosa26floxed-tdTomato/+ mice. Representative gating scheme for tdTomato+ monocyte-derived macrophages in the liver (singlet, live, Siglec-F, CD11b+) in TAM treated Cx3cr1CreERT2-IRESYFP/+ Rosa26floxed-tdTomato/+ mice infected with S. mansoni. (b) Quantitation of tdTomato+ cells reveals rapid turnover of CX3CR1+ derived cells during S. mansoni infection. Graph indicates percentage of CD11b+ tdTomato+ cells after 1, 2, or 5 weeks post-TAM gavage. (c) Representative flow cytometry plots of YFP+ and/or tdTomato+ cells isolated from the liver of Cx3cr1CreERT2-IRESYFP/+Rosa26floxed− tdTomato/+ mice infected with S. mansoni after 1 week, 2 weeks or 5 weeks post- tamoxifen gavage. (d) Representative flow cytometry plots of PD-L2 and CD206 expression in CD11b+ cells based on the YFP and/or tdTomato expression. (e) Quantification of the frequency of F4/80+ CD206+ or F4/80+ PD-L2+ cells (gated on single, live, Siglec-F, CD11b+) after 1 week (n=8), 2 weeks (n=3) or 5 weeks (n=10) post-tamoxifen gavage. (f) Ucp1 mRNA expression in sorted CX3CR1-YFP+ and/or tdTomato+ cells from Cx3cr1CreERT2-IRESYFP/+Rosa26floxed-tdTomato/+ mice infected with S. mansoni given a TAM pulse 5 weeks prior (left) or from mice on TAM diet for 6 weeks (right). (g) Cx3cr1CreERT2-IRESYFP/+ Rosa26floxed-tdTomato/+ mice infected with S. mansoni given tamoxifen (TAM) diet for 2 weeks Increased accumulation of tdTomato+ cells that have downregulated YFP expression at 2 weeks (n=3) or 6 weeks (n=5). (h) Quantification of CD11b+ event frequencies after 2 weeks or 6 weeks TAM diet of F4/80+ CD206+, F4/80+ PD-L2+, or F4/80+ MHCII+ events. **P<0.01, ***P<0.001, unpaired Students T test.
Figure 8
Figure 8. Disruption of Ucp1 expression and proliferation in granulomas and increased mortality of S. mansoni infection in vitamin A-deficient mice
(a) Vitamin A deficient (Vit-ADEF) or control (Vit-ACON) mice infected with S. mansoni and treated with all-trans RA starting at 5 weeks post-infection, every other day for 14 days. Mice were sacrificed at 7.5 weeks post infection. Survival curve of Vit-ACON (n=32) and Vit-ADEF (n=28) mice infected with S. mansoni. (b) RT-PCR analysis of Ucp1 and Gata6 expression in the liver of S. mansoni infected Vit-ACON(n=15), Vit-ADEF(n=11) or Vit-ADEF treated with all-trans RA (ATRA) (n=4) mice normalized to expression of GAPDH. Graphs depict mean ± standard error of the mean of individual mice pooled from 3 independent experiments. (c) Representative images from immunofluorescence microscopy of liver granulomas from Vit-ACONand Vit-ADEFinfected with S. mansoni stained for EdU (red) UCP1 (green). (d-h) Analysis results for S. mansoni infected Vit-ACON(n=8), Vit-ADEF(n=8), and Vit-ADEFmice treated with ATRA (n=4). (d) Representative FACS plots of CD206, PD-L2 expression of macrophages. (e) Stacked bar graph indicates frequencies of F4/80 and PD-L2 in CD11b+ cells. (f) Representative FACS plots of Siglec-F+ eosinophils. Quantification of Siglec-F+ cells. Scale bar 50μm. *P < 0.05 and **P<0.01 ***P < 0.0001. One-way ANOVA with Bonferroni post-test correction. Data representative of two independent experiments involving 5 to 6 mice per group.

Comment in

References

    1. Sieweke MH, Allen JE. Beyond stem cells: self-renewal of differentiated macrophages. Science. 2013;342:1242974. - PubMed
    1. Zigmond E, Jung S. Intestinal macrophages: well educated exceptions from the rule. Trends Immunol. 2013;34:162–168. - PubMed
    1. Ingersoll MA, Platt AM, Potteaux S, Randolph GJ. Monocyte trafficking in acute and chronic inflammation. Trends Immunol. 2011;32:470–477. - PMC - PubMed
    1. Shi C, Pamer EG. Monocyte recruitment during infection and inflammation. Nat Rev Immunol. 2011;11:762–774. - PMC - PubMed
    1. Gosselin D, et al. Environment drives selection and function of enhancers controlling tissue-specific macrophage identities. Cell. 2014;159:1327–1340. - PMC - PubMed

MeSH terms