. 2017 Jun;23(6):753-762.
doi: 10.1038/nm.4328. Epub 2017 Apr 24.

Pyruvate kinase M2 activation may protect against the progression of diabetic glomerular pathology and mitochondrial dysfunction

Affiliations

Pyruvate kinase M2 activation may protect against the progression of diabetic glomerular pathology and mitochondrial dysfunction

Weier Qi et al. Nat Med. 2017 Jun.

Abstract

Diabetic nephropathy (DN) is a major cause of end-stage renal disease, and therapeutic options for preventing its progression are limited. To identify novel therapeutic strategies, we studied protective factors for DN using proteomics on glomeruli from individuals with extreme duration of diabetes (ł50 years) without DN and those with histologic signs of DN. Enzymes in the glycolytic, sorbitol, methylglyoxal and mitochondrial pathways were elevated in individuals without DN. In particular, pyruvate kinase M2 (PKM2) expression and activity were upregulated. Mechanistically, we showed that hyperglycemia and diabetes decreased PKM2 tetramer formation and activity by sulfenylation in mouse glomeruli and cultured podocytes. Pkm-knockdown immortalized mouse podocytes had higher levels of toxic glucose metabolites, mitochondrial dysfunction and apoptosis. Podocyte-specific Pkm2-knockout (KO) mice with diabetes developed worse albuminuria and glomerular pathology. Conversely, we found that pharmacological activation of PKM2 by a small-molecule PKM2 activator, TEPP-46, reversed hyperglycemia-induced elevation in toxic glucose metabolites and mitochondrial dysfunction, partially by increasing glycolytic flux and PGC-1α mRNA in cultured podocytes. In intervention studies using DBA2/J and Nos3 (eNos) KO mouse models of diabetes, TEPP-46 treatment reversed metabolic abnormalities, mitochondrial dysfunction and kidney pathology. Thus, PKM2 activation may protect against DN by increasing glucose metabolic flux, inhibiting the production of toxic glucose metabolites and inducing mitochondrial biogenesis to restore mitochondrial function.


Figures

Figure 1
Figure 1
Elevation of glucose metabolic enzymes in glomeruli from individual with diabetes, but without DN. (a) Enrichment pathways from proteomics analysis on glomeruli from protected (n = 7) and nonprotected (n = 11) groups, using gene-ontology annotations and modified Fisher’s exact test. The numbers in parentheses indicate the number of proteins in each gene-ontology term biological process. (b) Heat map of top 45 proteins in the glomeruli from protected (n = 7) and nonprotected (n = 11) Medalists. Peptide levels from proteomics analysis. P < 0.05 and fold change ≥2 cutoff in order of P value, analyzed by Mann–Whitney U test. (c) Schema illustrating the significant alterations of glucose-metabolism and glycolysis pathway proteins from protected (n = 7) and nonprotected (n = 11) individuals. AR, aldose reductase; HK, hexokinase; G6PC, glucose-6-phosphatase, catalytic subunit; GPI, glucose phosphate isomerase; SORD, sorbitol dehydrogenase; PFK, phosphofructokinase; FBP, fructose-1,6-diphosphatase; aldo A/B, aldolase A and B; DAG, diglyceride; GAPDH, glyceraldehyde 3-phosphate dehydrogenase; TPI1, triosephosphate isomerase 1; PGK, phosphoglycerate kinase; PGM1, phosphoglucomutase-1; ENO1, enolase 1; PKM, pyruvate kinase isoenzyme type M2; PDH, pyruvate dehydrogenase; LDHB, lactate dehydrogenase; HAGH, hydroxyacyl glutathione hydrolase; GLO1, glyoxalase 1. PHGDH, 3-phosphoglycerate dehydrogenase. (d) Representative blot images from human glomeruli. All proteins were normalized to actin. Nondiabetic controls, n = 5; protected, n = 7; nonprotected, n = 11. M, molecular-weight marker lane. Box plots, center lines represent the median; limits represent quartiles; whiskers represent minimum and maximum values. Comparisons among groups were conducted using analysis of variance (ANOVA). When overall F tests were significant (P < 0.05), post hoc comparisons using Tukey’s method of adjustment were conducted to determine the location of any significant pairwise differences. *P < 0.05. (e) Representative periodic acid Schiff (PAS) images (mean number of glomeruli evaluated = 226; range = 105–421) of kidney samples from aged-matched controls without diabetes (n = 5) and protected (n = 7) and nonprotected (n = 11) individuals. Scale bars, 32 μm. (f) PKM peptide levels from glomeruli of protected (n = 7) and nonprotected (n = 11) individuals by proteomic analysis. All values are means ± s.d. and analyzed by unpaired Student’s t-test. **P < 0.01. (g) Pearson correlation; protected, n = 7; nonprotected, n = 11.
Figure 2
Figure 2
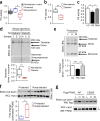
Regulation of PKM2 activity by high glucose and diabetes. (a) PK activity in glomeruli from age-matched controls without diabetes (n = 5) and protected (n = 6) and nonprotected (n = 10) individuals. (b) PK activity in glomeruli from nondiabetic mice (n = 5) and diabetic DBA/2J mice (n = 4) at 2 months post-STZ. (c) PK activity in podocytes treated with LG (5-mM D-glucose), HG (25-mM D-glucose) and Man (20-mM mannitol + 5-mM D-glucose) for 24 h. n = 4 independent experiments. (d) Representative blot image (n = 2 western blots with n = 7 mice per group) of cross-linked glomeruli from nondiabetic and diabetic DBA2/J mice at 2 months post-STZ. (e) Representative blot image (n = 3 western blots) from cross-linked podocytes at 24 h. Independent cross-linked experiments LG and HG (n = 9), and Man (n = 3). (f) Sulfenylated and oxidized PKM2 in human kidney cortex, normalized to PKM2 from whole-cell-lysate input. Protected (n = 4); nonprotected (n = 6). (g) Podocytes expressing Flag-PKM2 or Flag-PKM2(C358S) were treated with LG (5.5-mM D-glucose), HG (25-mM D-glucose) and Man (20-mM D-mannitol) for 24 h. Sulfenylated and oxidized PKM2 were probed with Flag antibody. WT, wild-type PKM2. Representative blot image (n = 4 western blots). * and ** refer to lower panel of western blot (PKM2). * refers to upper band of PKM2 (Flag-PKM2); ** refers to lower band of PKM2 (endogenous PKM2). For box plots (a,b,d,f), center lines represent the median; limits represent quartiles; whiskers represent minimum and maximum values. For other bar graphs (c,e), all values are means ± s.e.m. For two-group comparisons (b,d,f), data were analyzed by unpaired Student’s t-test. Comparison of more than two groups was analyzed using ANOVA. When overall F tests were significant (P < 0.05), post hoc comparisons using Tukey’s method of adjustment were conducted to determine the location of any significant pairwise differences. **P < 0.005; *P < 0.05.
Figure 3
Figure 3
Pkm2 deletion in podocytes accelerates DN progression. (a) Methylglyoxal in control (shCntrl) and Pkm-knockdown (shPKM) podocytes treated with LG and HG for 72 h. Independent MG analysis shCntrl-LG, n = 11; shPKM-LG, n = 5; shCntrl-HG, n = 9; shPKM-HG n = 5. (b) PKC-δ from culture conditions, as described in a. Representative blot images from n = 4 independent experiments. (c) Ppargc1a mRNA, MMP and MitoTracker Green. Independent experiments n = 4. (d) DNA fragmentation in podocytes at 72 h. n = 7 independent experiments. (e) Schema illustrating generation of podocyte-specific Pkm2-KO mice. (f) Representative blot images (n = 2 western blots with n = 4 mice per group) of PKM2 and PKM1 protein in podocytes isolated from WT and PPKM2-KO mice. (g) Fasting blood glucose 6 months post-STZ. Nondiabetic WT mice (n = 14); PPKM2-KO mice (n = 11); diabetic WT mice (n = 10); diabetic PPKM2-KO mice (n = 16). (h) ACR 3 months post-STZ. Nondiabetic WT mice (n = 5); nondiabetic PPKM2-KO mice (n = 6); diabetic WT mice (n = 8); diabetic PPKM2-KO mice (n = 8). (i) Mesangial expansion 6 months post-STZ. Representative n = 20–43 images of PAS-stained kidney sections for each mouse. Nondiabetic WT mice (n = 7); nondiabetic PPKM2-KO mice (n = 5); diabetic WT mice (n = 6); diabetic PPKM2-KO mice (n = 7). Scale bars, 10 μm. (j) Glomerular fibronectin (Fn) mRNA 6 months post-STZ. Non-diabetic WT mice (n = 7); nondiabetic PPKM2-KO mice (n = 6); diabetic WT mice (n = 5); diabetic PPKM2-KO mice (n = 6). For box plots (g,h,i,j), center lines represent the median; limits represent quartiles; whiskers represent minimum and maximum values. All values are means ± s.e.m. in bar graphs. All data throughout this figure are analyzed using ANOVA. When overall F tests were significant (P < 0.05), post hoc comparisons using Tukey’s method of adjustment were conducted to determine the location of any significant pairwise differences. ***P < 0.001; **P < 0.005; *P < 0.05. #P = 0.068.
Figure 4
Figure 4
PKM2 activation normalizes abnormalities in glucose metabolism and mitochondrial function and prevents podocyte apoptosis induced by high glucose. Podocytes were treated with low-glucose vehicle (LG), high-glucose vehicle (HG), low glucose with 10-μM TEPP-46 (LT) or 10-μM Agio and high-glucose, 10-μM TEPP-46 (HT) or 10-μM Agio. (a) Sorbitol in podocytes treated for 72 h. n = 5 independent experiments. (b) PKC-δ membrane translocation in podocytes treated for 72 h. Representative blot images; n = 3 independent experiments. (c) Methylglyoxal in podocytes treated with LG-vehicle n = 4; HG-vehicle n = 4; LG-Agio n = 5; HG-Agio n = 6. (d) Sorbitol derived from D-[U-13C6] glucose over a period of 12 h; n = 4 independent experiments. (e) DAG derived from D-[U-14C6] glucose in podocytes treated for 72 h. Independent experiments n = 2 at 0 h, n = 5 at 4 h, n = 8 at 6 h, n = 3 at 12 h. *P < 0.05 versus LG-vehicle at 6 h; &P < 0.05 versus HG-vehicle at 6 h. (f) Podocytes were treated with LG or HG for 72 h before the addition of vehicle or 10-μM TEPP-46 for a further 24 h in the presence of LG or HG. Representative curve was shown (n = 4 replicates for each cell culture condition) and four independent experiments were performed. (g) CO2 derived from D-[6-14C] glucose over a period of 3 h in podocytes treated with LG-vehicle, n = 8; HG-vehicle, n = 7; LG-TEPP-46, n = 6; HG-TEPP-46, n = 5. (h) Podocytes were treated under the same conditions as described in f. ATP was presented as fold change. Four replicates for each cell culture condition are included in each experiment, and two independent experiments were performed. (i) MitoTracker Green, n = 6 independent experiments. MMP, LG-vehicle n = 6; HG-vehicle, n = 5; LG-TEPP-46, n = 3; HG-TEPP-46, n = 10. (j) Podocytes were treated for 8 h (Ppargc1a mRNA) and 4 d (MitoTracker Green and MMP). Independent experiments n = 4. (k) Podocytes were treated with LG or HG for 24 h before the addition of vehicle or 10-μM TEPP-46 for a further 24 h in the presence of LG or HG. Independent experiments n = 4; (l) ROS in podocytes treated for 24 h. LG-vehicle, n = 7; HG-vehicle, n = 7; LG-TEPP-46, n = 4; HG-TEPP-46, n = 6. (m) Representative blot images (n = 6 western blots) from podocytes treated for 72 h. LG-vehicle, n = 8; HG-vehicle, n = 10; LG-TEPP-46, n = 5; HG-TEPP-46, n = 9. (n) Podocytes treated for 72 h. Independent experiments n = 4. All values are means ± s.e.m. ***P < 0.001; **P < 0.005; *P < 0.05. All data throughout this figure are analyzed using ANOVA. When overall F tests were significant (P < 0.05), post hoc comparisons using Tukey’s method of adjustment were conducted to determine the location of any significant pairwise differences.
Figure 5
Figure 5
PKM2 activation reverses diabetes-induced defects in glucose metabolism and mitochondrial function in a mouse model of DN. (a) Schema of intervention-study design using STZ-induced diabetic DBA2/J mice treated with 30 mg/kg body weight TEPP-46 daily by oral gavage for 3 months after onset of STZ-induced diabetes. Mice were harvested 6 months post-STZ “4–6M” indicates that mice were given vehicle or TEPP-46 from 4–6 months onset of diabetes. (b) Sorbitol from kidney cortex. Nondiabetic vehicle treatment, n = 5 mice; diabetic vehicle, n = 11 mice; diabetic TEPP-46, n = 9 mice. (c) DAG (C16:0/18:0) from kidney cortex; n = 5 mice per group. (d) Methylglyoxal from kidney cortex. Nondiabetic vehicle, n = 7 mice; diabetic vehicle, n = 6 mice; diabetic TEPP-46, n = 7 mice. (e) Glomerular Ppargc1a and Opa1 mRNA. Nondiabetic vehicle, n = 6 mice; diabetic vehicle, n = 5 mice; diabetic TEPP-46, n = 7 mice. Tubular Ppargc1a and Opa1 mRNA, n = 6 mice. (f) Representative electron microscopy (EM) micrographs of mitochondria in podocytes from each group. Number of mitochondria was counted and normalized to area. Scale bar (top), 1 μm. Mitochondria area was quantified: nondiabetic vehicle, 333 mitochondria from 5 mice evaluated; diabetic vehicle, 732 mitochondria from 6 mice evaluated; diabetic TEPP-46, 1011 mitochondria from 7 mice evaluated. Scale bars (bottom), 0.5 μm. (g) Ppargc1a mRNA in primary podocytes isolated from WT and PPKM2-KO mice. Cells were treated with vehicle or 10-μM TEPP-46 for 8 h. WT, n = 5 mice, PPKM2-KO, n = 7 mice. (h) ACR at 6 months post-STZ. All mice were treated with vehicle or 50 mg/kg body weight TEPP-46 daily after 3 months of diabetes for a further 3 months. Nondiabetic WT vehicle (n = 4 mice); nondiabetic PPKM2-KO vehicle (n = 6 mice); diabetic WT vehicle (n = 11 mice); diabetic PPKM2-KO vehicle (n = 12 mice); diabetic WT TEPP-46 (n = 5 mice); diabetic PPKM2-KO TEPP-46 (n = 5 mice). For box plots, center lines represent the median; limits represent quartiles; whiskers represent minimum and maximum values. All data throughout this figure are analyzed using ANOVA. When overall F tests were significant (P < 0.05), post hoc comparisons using Tukey’s method of adjustment were conducted to determine the location of any significant pairwise differences. ***P < 0.001; **P < 0.005; *P < 0.05.
Figure 6
Figure 6
Pharmacologically activating PKM2 by TEPP-46 prevents the development of glomerular pathology. (a) ACR after 1 month of TEPP-46 treatment. Nondiabetic vehicle (n = 6 mice); diabetic vehicle (n = 9 mice); diabetic TEPP-46 (n = 10 mice). ACR after 3 months of TEPP-46 treatment. Nondiabetic vehicle treatment (n = 11 mice); diabetic vehicle (n = 17 mice); diabetic TEPP-46 (n = 15 mice). (b) Representative mesangial expansion at 6 months post-STZ by PAS staining. n = 350 images of kidney sections per group. Nondiabetic vehicle (n = 6 mice); diabetic vehicle (n = 6 mice); diabetic TEPP-46 (n = 7 mice). Scale bars, 10 μm. Representative images of thickness of glomerular basement membrane (GBM). Average of 100 measurements for each mouse and n = 6 mice per group. Scale bar, 0.5 μm. (c) mRNA for glomerular extracellular matrix genes. Nondiabetic vehicle (n = 6 mice); diabetic vehicle (n = 6 mice); diabetic TEPP-46 (n = 7 mice). mRNA for tubular extracellular matrix genes, n = 6 mice per group. (d) Representative confocal immunofluorescence images of Wilms tumor-1 (WT-1) staining. WT-1-positive cell number was normalized to glomerular tuft area. Nondiabetic vehicle, 60 glomeruli from 5 mice evaluated; diabetic vehicle, 91 glomeruli from 5 mice evaluated; diabetic TEPP-46, 88 glomeruli from 6 mice evaluated. Scale bars, 20 μm. (e) ACR at 13 weeks post-STZ eNos-KO mice. Nondiabetic vehicle, n = 5 mice; diabetic vehicle, n = 8 mice; diabetic TEPP-46, n = 7 mice. (f) Representative mesangial expansion (average of 42 glomeruli were assessed) at 13 weeks post-STZ eNos KO mice. Nondiabetic vehicle, n = 5 mice; diabetic vehicle, n = 6 mice; diabetic TEPP-46, n = 6 mice. Scale bars, 10 μm. (g) Extracellular matrix mRNA from kidney cortex. Nondiabetic vehicle (n = 5 mice); diabetic vehicle (n = 6); diabetic TEPP-46 (n = 6 mice). For box plots, center lines represent the median; limits represent quartiles; whiskers represent minimum and maximum values. All data throughout this figure are analyzed using ANOVA. When overall F tests were significant (P < 0.05), post hoc comparisons using Tukey’s method of adjustment were conducted to determine the location of any significant pairwise differences. ***P < 0.001; **P < 0.005; *P < 0.05.

Comment in

Similar articles

Cited by

References

    1. Breyer MD, Susztak K. The next generation of therapeutics for chronic kidney disease. Nat Rev Drug Discov. 2016;15:568–588. - PMC - PubMed
    1. Khan SS, Quaggin SE. Therapies on the horizon for diabetic kidney disease. Curr Diab Rep. 2015;15:111. - PMC - PubMed
    1. United States Renal Data System. 2015 USRDS Annual Data Report. USRDS; 2015.
    1. Brownlee M. The pathobiology of diabetic complications: a unifying mechanism. Diabetes. 2005;54:1615–1625. - PubMed
    1. Nishikawa T, et al. Normalizing mitochondrial superoxide production blocks three pathways of hyperglycaemic damage. Nature. 2000;404:787–790. - PubMed

MeSH terms

Substances