. 2017 Jun;23(6):775-781.
doi: 10.1038/nm.4324. Epub 2017 Apr 24.

Local clearance of senescent cells attenuates the development of post-traumatic osteoarthritis and creates a pro-regenerative environment

Affiliations

Local clearance of senescent cells attenuates the development of post-traumatic osteoarthritis and creates a pro-regenerative environment

Ok Hee Jeon et al. Nat Med. 2017 Jun.

Abstract

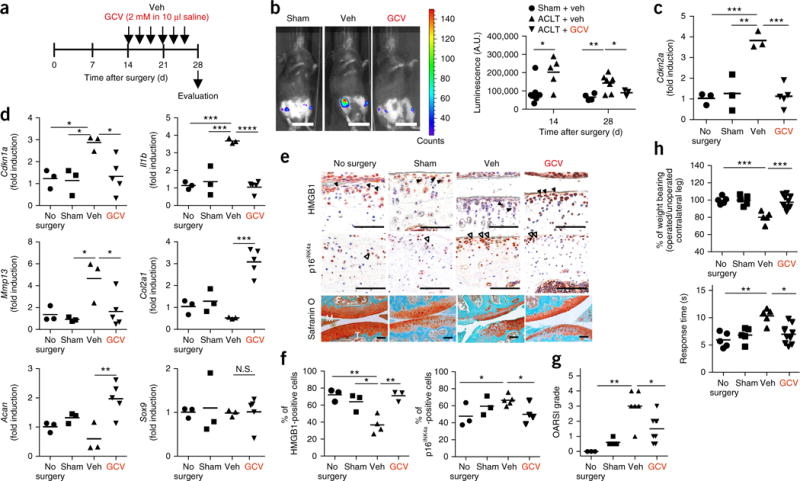
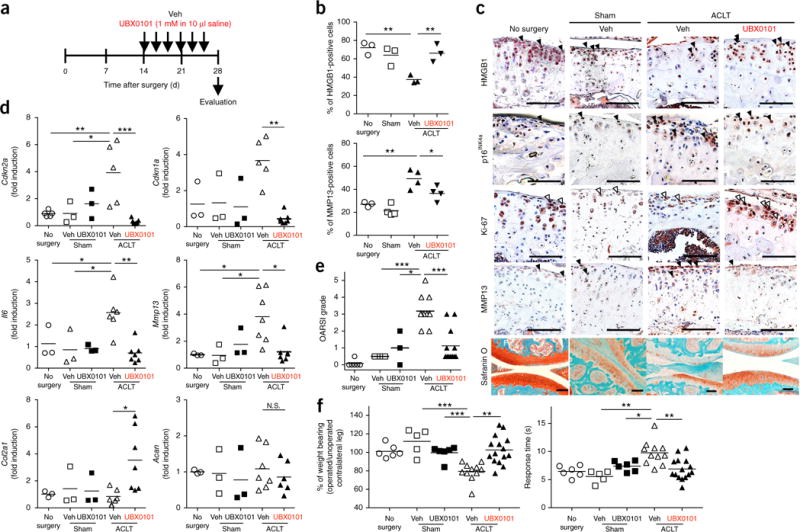
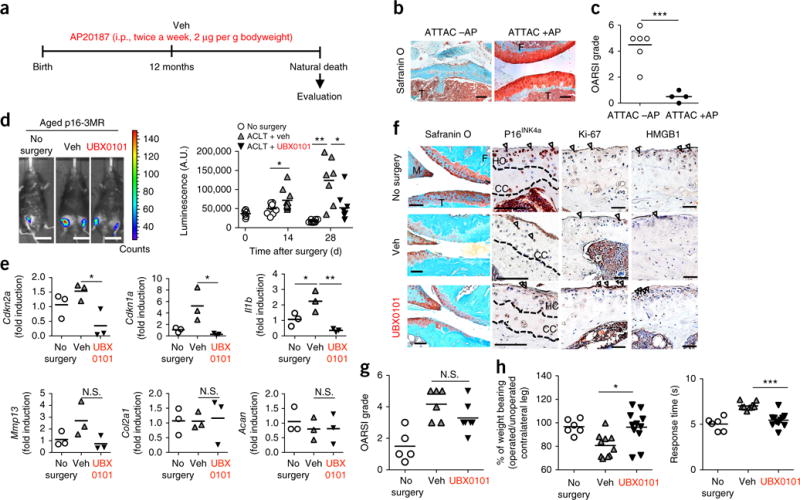
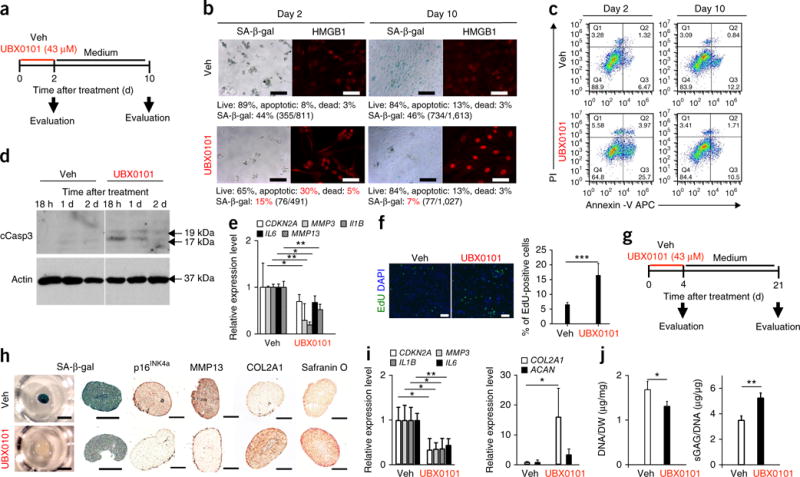
Senescent cells (SnCs) accumulate in many vertebrate tissues with age and contribute to age-related pathologies, presumably through their secretion of factors contributing to the senescence-associated secretory phenotype (SASP). Removal of SnCs delays several pathologies and increases healthy lifespan. Aging and trauma are risk factors for the development of osteoarthritis (OA), a chronic disease characterized by degeneration of articular cartilage leading to pain and physical disability. Senescent chondrocytes are found in cartilage tissue isolated from patients undergoing joint replacement surgery, yet their role in disease pathogenesis is unknown. To test the idea that SnCs might play a causative role in OA, we used the p16-3MR transgenic mouse, which harbors a p16INK4a (Cdkn2a) promoter driving the expression of a fusion protein containing synthetic Renilla luciferase and monomeric red fluorescent protein domains, as well as a truncated form of herpes simplex virus 1 thymidine kinase (HSV-TK). This mouse strain allowed us to selectively follow and remove SnCs after anterior cruciate ligament transection (ACLT). We found that SnCs accumulated in the articular cartilage and synovium after ACLT, and selective elimination of these cells attenuated the development of post-traumatic OA, reduced pain and increased cartilage development. Intra-articular injection of a senolytic molecule that selectively killed SnCs validated these results in transgenic, non-transgenic and aged mice. Selective removal of the SnCs from in vitro cultures of chondrocytes isolated from patients with OA undergoing total knee replacement decreased expression of senescent and inflammatory markers while also increasing expression of cartilage tissue extracellular matrix proteins. Collectively, these findings support the use of SnCs as a therapeutic target for treating degenerative joint disease.


Conflict of interest statement

COMPETING FINANCIAL INTERESTS

The authors declare competing financial interests: details are available in the online version of the paper.

COMPETING FINANCIAL INTERESTS J.C., R.-M.L., Y.P., D.J.B., J.M.v.D., M.D., N.D. and J.H.E. own equity in Unity Biotechnology. Johns Hopkins University and Unity Biotechnology own intellectual property related to the research. O.H.J., C.K. and J.H.E. are inventors of Johns Hopkins University intellectual property licensed to Unity Biotechnology.

Figures

Figure 1
Figure 1
Clearance of SnCs by GCV reduces the development of post-traumatic OA. (a) Schematic of the time course for the experiments in bh. Male p16-3MR mice undergoing ACLT were injected intra-articularly with vehicle (Veh) or ganciclovir (GCV) and evaluated as indicated. (b) Representative luminescence images (sham surgery, n = 7; Veh treated, n = 7; GCV treated, n = 3) of ACLT mice after vehicle or GCV treatment on day 28 after surgery (left) and quantification of the luminescence (right) at the indicated time s(in arbitrary units, A.U.). Scale bars, 2 cm. (c) Quantification of mRNA expression for Cdkn2a in articular joints treated on day 28 after surgery (no surgery, sham surgery and Veh treated, n = 3; GCV treated, n = 5). (d) Quantification of mRNA expression for Cdkn1a, Il1b, Mmp13, Col2a1, Acan and Sox9, normalized to Actb expression, in joints from no-surgery, sham-operated and ACLT mice that were treated as indicated (no surgery, sham surgery and Veh treated, n = 3; GCV treated, n = 5). (e) Representative images of HMGB1 (brown, closed arrowheads; no surgery, sham surgery and GCV treated, n = 3; Veh treated, n = 4) and p16INK4a (brown, open arrowheads; no surgery and sham surgery, n = 3; Veh treated, n = 5; GCV treated, n = 4) immunostaining and safranin O and methyl green (no surgery, n = 3; sham surgery, n = 5; Veh treated, n = 6; GCV treated, n = 8) in p16-3MR mice. F, femur; T, tibia; M, meniscus. Scale bars, 100 μm. (f) Quantification of non-SnCs positive for nuclear HMGB1 (no surgery and sham surgery, n = 3; Veh treated, n = 4; GCV treated, n = 3) and SnCs positive for p16INK4a (no surgery and sham surgery, n = 3; Veh treated, n = 5; GCV treated, n = 4) in articular cartilage. (g) Medial tibial plateau joint score in p16-3MR mice based on the OARSI scoring system (no surgery, n = 3; sham surgery, n = 5; Veh treated, n = 6; GCV treated, n = 8). (h) The percentage of weight placed on the operated limb versus the contralateral control (top) and the response time of mice after placement onto a 55 °C hotplate (bottom) (no surgery, sham surgery and Veh treated, n = 5; GCV treated, n = 10). All data are expressed as means, and each data point represents an individual mouse. One-way ANOVA with Tukey’s multiple-comparisons test was used for statistical analysis in c and d; a two-tailed t-test (unpaired) was used for b and fh. *P < 0.05, **P < 0.01, ***P < 0.001, ****P < 0.0001; N.S., not significant.
Figure 2
Figure 2
SnC clearance by UBX0101 attenuates post-traumatic OA and creates a prochondrogenic environment. (a) Schematic of the time course for the experiments in bf. Male C57BL mice that underwent ACLT were injected intra-articularly every other day with vehicle (Veh) or UBX0101 (UBX) and evaluated as indicated. (b,c) Quantification of non-SnCs positive for nuclear HMGB1 and MMP13 immunostaining (b) and representative immunostaining images of HMGB1 (brown, closed arrowheads; n = 3 for each group), p16INK4a (brown, closed arrowheads), n = 3, Ki-67 (brown, open arrowheads; no surgery, n = 3; sham surgery, Veh treated and UBX0101 treated, n = 4) and MMP13 (brown, closed arrowheads; no surgery, n = 2; sham surgery, n = 3; Veh and UBX0101 treated, n = 4) and the medial tibial plateau stained with safranin O and methyl green in articular cartilage from no-surgery (n = 6), sham-operated (n = 5) and ACLT mice treated with vehicle (n = 11) or UBX0101 (n = 12) (c). Scale bars, 100 μm. (d) Quantification of mRNA expression for Cdkn2a (no surgery, n = 6; sham operated with vehicle or UBX0101, n = 3; ACLT with vehicle, n = 5; ACLT with UBX, n = 7), Cdkn1a (no surgery, sham operated with vehicle or UBX0101, n = 3; ACLT with vehicle, n = 6; ACLT with UBX, n = 7), Il6 (no surgery, sham operated with vehicle or UBX0101, n = 3; ACLT with vehicle, n = 5; ACLT with UBX, n = 7), Mmp13 (no surgery, sham operated with vehicle or UBX0101, n = 3; ACLT with vehicle, n = 7; ACLT with UBX, n = 7), Col2a1 (no surgery, sham operated with vehicle or UBX0101, n = 3; ACLT with vehicle, n = 6, ACLT with UBX; n = 7) and Acan (no surgery, sham operated with vehicle or UBX0101, n = 3; ACLT with vehicle, n = 7; ACLT with UBX, n = 6) normalized to Actb levels in joints. (e) OARSI scores of articular joints (no surgery, n = 6; sham operated with vehicle, n = 5; sham operated with UBX, n = 3; ACLT with vehicle, n = 11; ACLT with UBX, n = 12). (f) The percentage of weight placed on the operated limb versus the contralateral control limb (left) and the response time after placement onto a 55 °C platform (right) (no surgery, n = 6; sham operated with vehicle, n = 5; sham operated with UBX, n = 6; ACLT with vehicle, n = 11; ACLT with UBX, n = 15). All data are expressed as means, and each data point represents an individual mouse. One-way ANOVA with Tukey’s multiple-comparisons test was used for statistical analysis in d; a two-tailed t-test (unpaired) was used for b, e and f. *P < 0.05, **P < 0.01, ***P < 0.001.
Figure 3
Figure 3
Clearance of SnCs slows the development of naturally occurring OA and post-traumatic OA in aged mice. (a) Study design for clearance of naturally occurring p16INK4a-positive SnCs in female INK-ATTAC mice. AP20187 (AP) was administrated intraperitoneally (i.p.) twice a week starting at 12 months of age. (b) Representative images of safranin O and methyl green staining from vehicle-treated (−AP; n = 6) and AP20187-treated (+AP; n = 4) mice. F, femur; T, tibia. Scale bars, 100 μm. (c) OARSI grade for vehicle-treated (n = 6 mice aged 20, 21, 25, 28, 28 and 32 months) and AP20187-treated (n = 4 mice aged 21, 28, 28 and 34 months) mice. (d) Representative whole-body luminescence images on day 28 after ACLT surgery (no surgery, n = 8; Veh treated, n = 7; UBX0101 treated, n = 8) (left) and quantification of luminescence (in arbitrary units, A.U.) at the indicated times after the surgery of male p16-3MR mice aged 19–20 months treated as indicated in Figure 2a (right). Scale bars, 2 cm (no surgery, n = 8; Veh treated, n = 7; UBX treated, n = 8). (e) Quantification of mRNA levels for Cdkn2a, Cdkn1a, Mmp13, Col2a1 and Acan normalized to Actb levels in joints 28 d after ACLT (n = 3 for all groups). (f) Representative images of safranin O and methyl green staining and immunostaining for p16INK4a (brown, arrows; no surgery, n = 4; Veh treated, n = 3; UBX0101 treated, n = 4), Ki-67 (no surgery and Veh treated, n = 3; UBX0101 treated, n = 4) and HMGB1 (brown, arrowheads; no surgery, n = 5; Veh treated and UBX0101 treated, n = 3) on articular cartilage. HC, hyaline cartilage; CC, calcified cartilage. Scale bars, 100 μm. (g) OARSI grade for no-surgery, vehicle-treated and UBX0101-treated ACLT mice (no surgery, n = 5; Veh treated, n = 6; UBX treated, n = 7). (h) The percentage of weight placed on the operated limb versus the contralateral control (left) and the response time of mice after placement onto a 55 °C platform (right) (no surgery, n = 6; Veh treated, n = 10; UBX treated, n = 11). All data are expressed as means, and each data point represents an individual mouse. One-way ANOVA with Tukey’s multiple-comparisons test was used for statistical analysis in e; a two-tailed t-test (unpaired) was used for c, d, g and h. *P < 0.05, **P < 0.01, ***P < 0.001.
Figure 4
Figure 4
UBX0101 clears SnCs by inducing apoptosis and improves the cartilage-forming ability of chondrocytes from human OA tissue. (a) Schematic of the monolayer experiments in be. (b) Quantification of SA-β-gal-positive cells and the percentage of live (gate Q2, PI−Annexin V−), apoptotic (gate Q3, PI−Annexin V+ and gate Q4, PI+Annexin V+), and dead (gate Q1, PI+Annexin V−) SnCs in monolayer-cultured human OA chondrocytes treated with vehicle or 43 μM UBX0101. Representative images are shown of cells with nuclear HMGB1 (red) visualized by immunostaining (n = 10 images per group). Scale bars, 100 μm. (c) Representative flow cytometric plots measuring apoptosis from three independent experiments. (d) Immunoblot analysis of cleaved caspase-3 (cCasp3) and actin in human OA chondrocytes at 18 h, 1 d and 2 d after incubation with vehicle or 43 μM UBX0101. The experiment was performed two independent times. See Supplementary Figure 13 for uncropped immunoblots. (e) Quantification of mRNA levels for CDKN2A, MMP3, IL1B, IL6 and MMP13 normalized to ACTB levels; n = 3 for each group. (f) Representative EdU staining (left; green) and quantification of the percentage of EdU-positive cells remaining (right) in human OA chondrocyte cultures after removing SnCs using UBX0101; n = 5 for each group. Scale bars, 100 μm. (g) Schematic of the 3D pellet culture experiments in hj. (h) SA-β-gal staining (left; scale bars, 1 mm) and sectioned images immunostained for p16INK4a, MMP13 and COL2A1 and stained for safranin O (right; scale bars, 100 μm) in 3D pellet cultures of human OA chondrocytes treated with vehicle or 43 μM UBX0101; n = 3 for each group. (i) Quantification of mRNA levels for CDKN2A, MMP3, IL1B, IL6, COL2A1 and ACAN normalized to ACTB levels; n = 3 for each group. (j) DNA content normalized to dry weight (DW) and sGAGs normalized to DNA content; n = 3 for each group. In e, f, i and j, data are shown as averages ± s.d. Statistical analysis was performed using two-tailed t-tests (unpaired). *P < 0.05, **P < 0.01, ***P < 0.001.

Comment in

References

    1. Campisi J. Aging, cellular senescence, and cancer. Annu Rev Physiol. 2013;75:685–705. - PMC - PubMed
    1. van Deursen JM. The role of senescent cells in ageing. Nature. 2014;509:439–446. - PMC - PubMed
    1. Campisi J. Senescent cells, tumor suppression, and organismal aging: good citizens, bad neighbors. Cell. 2005;120:513–522. - PubMed
    1. Coppé JP, et al. Senescence-associated secretory phenotypes reveal cell-nonautonomous functions of oncogenic RAS and the p53 tumor suppressor. PLoS Biol. 2008;6:2853–2868. - PMC - PubMed
    1. Campisi J. Cancer, aging and cellular senescence. In Vivo. 2000;14:183–188. - PubMed

MeSH terms